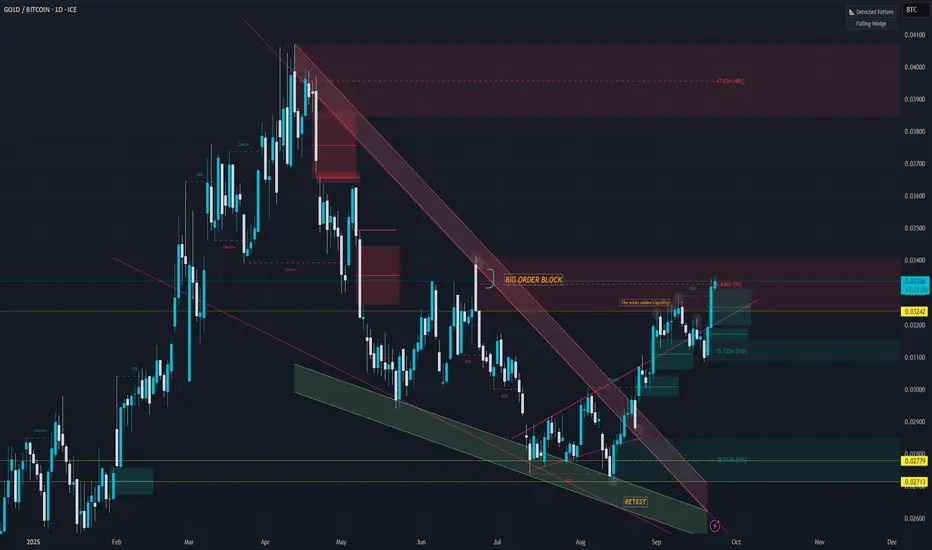
Market will continue to eat the current bearish Order blockI had the vision from the retest of the double bottom (Wickoff reversal pattern) that Gold had the possibility to outperform Gold from now on) (+12% Past Month)
I believe that BTC has currently begun a Mark Down process after his last point of supply.
Currently holding Gold Long and BTC Short for long term.
For Scalp Play I'm about to try Gold Short and BTC Short. There's a probability that this Big Order block will be Eaten slowly with a BTC underperforming Gold in % drop.
I will be more aggressive on BTC short and and will leave some margin on Gold if it climb a bit up.(up to my SL 3839)
Contains IO script
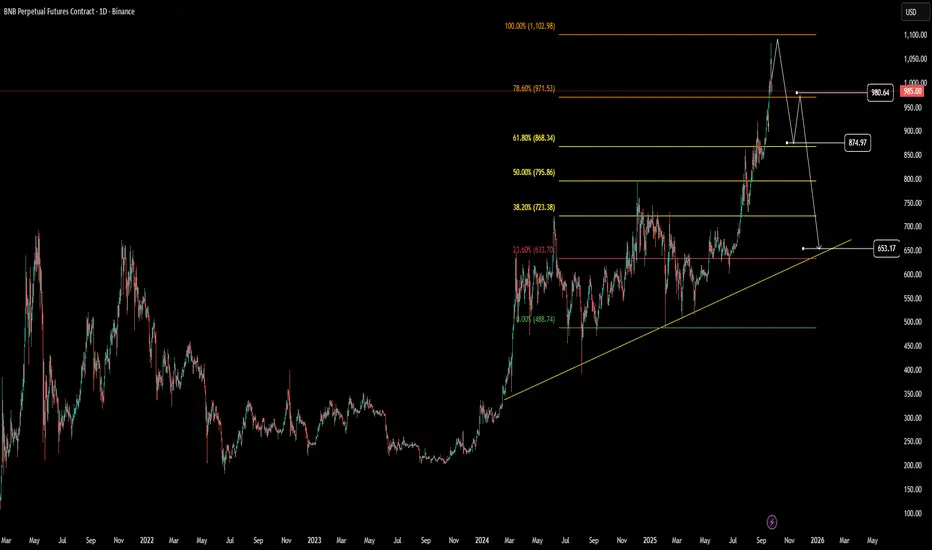
$BNB has now tapped into the 100% Fibonacci extension level. CRYPTOCAP:BNB has now tapped into the 100% Fibonacci extension level.
Looking at previous data and current chart analysis, there’s a strong chance that the price could retrace back to the $650 support trendline(medium term).
Clean Break & RetestZScaler formed a base and is breaking out on the daily. I think $310 is within reach, and I will use that as my first price target.

Showing second chance wayching multi timeframe RSI'sShowing second chance wayching multi timeframe RSI's - More of swing ideas using Price Action Reader

XAUUSD time to take profitXAUUSD hit big target XOP around @ 3737 usd. or wait for sell signal in daily timeframe when price below 3660.

Outlandish XRP IdeaI took a fractal from the 2017 XRP Bull Run and took the 50 moving average and the 250 moving average and found a pattern. A similar flush happened before extreme take off. Not saying the same thing will happen, cause my base case idea is posted, but just wanted to put it out there cause it would be awesome if it did.

BTC.D (Bitcoin Dominance) Update🚨 BTC.D (Bitcoin Dominance) Update 🚨
After completing the bearish wave I mentioned in my last analysis, BTC.D has now started retracing. The timing is very important here, because it happened exactly when Bitcoin was rejected from its bullish move. ⚡
👉 This is dangerous for altcoins – if Bitcoin falls while dominance rises, alts can face heavy pressure.
📌 Key retracement levels (Arrows):
* Arrow #3 → First retracement level. If dominance breaks this, expect continuation.
* Arrow #2 & Arrow #1 → Next important levels.
* Arrow #1 is the MOST important because it aligns with both weekly & daily retracement zones from the bearish move.
💡 But as I always remind: Monday is not a pattern day. We need the daily candle close to confirm the real direction.
✅ What to do if analysis confirms?
* Take profits on alts and park liquidity to re-enter later when reversal is confirmed.
* If you still want to hold, at least scale out partially to protect gains.
⚠️ Second Scenario: If BTC.D breaks Arrow #4 and the 58% level on the daily, that’s the bearish confirmation for alts.
🚀 Stay sharp, stay disciplined! The key is preserving profits and being ready for the next golden entry. Market always rewards patience.

BTC Weekly Update – Critical Zone Ahead!🚨 BTC Weekly Update – Critical Zone Ahead! 🚨
Bitcoin has just made a very dangerous move on the weekly chart. We’ve closed with a Doji candle right at a major weekly resistance level – and price already broke down from that candle’s range. ⚠️
Why is this dangerous?
👉 Because the market has only done a shallow retracement on the higher timeframe so far. If BTC had broken above the yellow line (Arrow #1), it would’ve been a strong bullish signal. But since the breakout failed, rejection here could send price back for a deeper retracement.
📍 The deeper retracement zone sits near 100k (Arrow #5) – a level to watch very closely.
At the same time, I’ve marked two critical decision points on the chart:
* 116,310 (Arrow #1)
* 113,460 (Arrow #2)
✅ Breaking above/below these levels will be the real decision point for Bitcoin’s next big move – whether we go higher or prepare for a deeper correction.
⚡️ Reminder: Mondays are usually manipulation-heavy days in crypto. Best strategy is to wait for today’s candle to close before deciding on a buy or sell.
Next step 👉 I’ll also publish the BTC.D (Bitcoin Dominance) chart to see how altcoins might react. Stay patient, stay sharp – the market is about to reveal its hand!
🔥 Discipline + Patience = Profit 🔥

Bitcoin | Falling Wedge Breakout – Bulls Eye $123K📖 Bitcoin has been consolidating inside a falling wedge on the 4H timeframe.
A breakout has just occurred, with the first target zone near $117,000.
Multiple CHoCH + BOS signals hint at a possible bullish trend reversal.
If momentum holds, upside continuation toward $123K is on the table.
🔹 Invalidation: Below $107K (wedge low).
🔹 Confluence: Liquidity sweep + market structure shift.

Solana's short-term pullback resets Overbought RSISolana's 1st attempt to break out from the $252 Multi-year resistance failed and triggered a short-term bearish reaction, causing the price to fall all the way to $213.87. A long wick was created due to a quick bounce from $213.87; it is also showing good support on the Fib .618 ($220.49) level.
The pullback also resets the overbought RSI of Solana, which is a healthy move, seeing it as an opportunity to gather strength for another leg up. The over-extended MA20 has also crossed the daily candle, showing another sign of good retracement gearing for another bounce.
The weekly cup-and-handle pattern was still intact, targeting a measured move of $520.
From a fundamental perspective, given that Solana has institutional adoption and pending ETF approvals in October 2025, Solana is still considered highly undervalued.

Silver 3 Month chart📊 Silver 3M Long-Term Chart Analysis
🚀 Price has once again approached historical resistance levels near $45 - $47.9 after decades of consolidation.
🔹 Major Support: $37.90
🔹 Resistance Zone: $47.90 – $49.83
🔹 Next Psychological Level: $55.70
Disclaimer (SEBI guidelines):
This chart and analysis is shared only for educational and informational purposes. It should not be considered as investment advice or a recommendation to buy/sell any security. Past performance is not indicative of future results. Please consult your financial advisor before making any investment decisions. I am not a SEBI registered advisor.
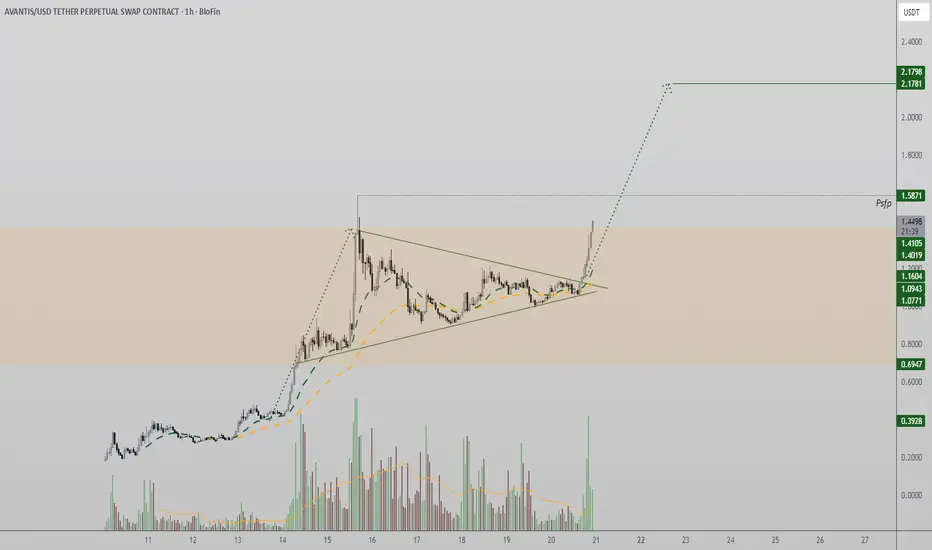
Avantis Breakout Targets $2.17 After Apex ResolutionAfter consolidating in an apex formation of higher lows and lower highs, Aventis has broken out decisively. Strong bullish influxes backed the move, confirming that buyers are in control of the trend.
Key Technical Points
- Apex Zone: Breakout from dynamic support and resistance convergence.
- Measured Move: Target calculated at $2.17.
- 55% Upside: Potential gains from current trade location.
The equilibrium pattern reflected tightening price action before pressure resolved to the upside. The breakout aligns with rising demand and volume, both essential for continuation. The technical target of $2.17 is measured from the preceding pole of price action before equilibrium formed.
This suggests that momentum could carry Aventis significantly higher if inflows persist. Failure to maintain volume could lead to a retest of the breakout zone, but structure currently favors bulls.
What to Expect
Aventis is likely to continue its bullish expansion toward $2.17. Traders should monitor volume, as continuation depends on sustained buying pressure.
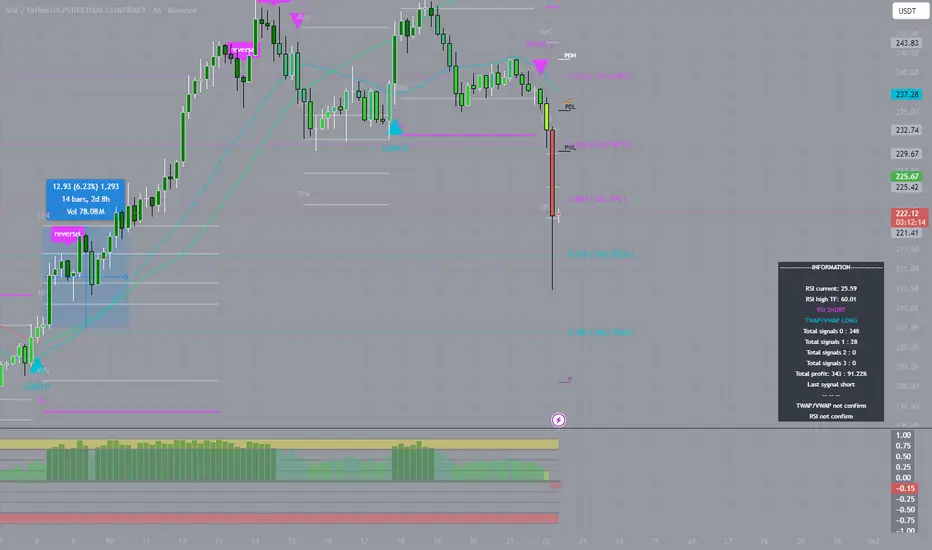
SOL: Clear ReversalOn September 15, I opened a short on the 4-hour chart at $237 with 10x leverage. The move down was quick: TP1 was closed at $233 and TP2 at $230. A $7 difference per coin, amplified by leverage, delivered a solid result. The maximum of the trade came exactly at $230 before the market reversed.
The focus here was not on trying to take everything but on following structure. Levels had been mapped in advance, and I executed step by step according to plan. This allowed me to control the trade calmly, without panic or guesswork.
When trading is built systematically, even sharp moves become manageable. It’s clear where to take profit, where to hold, and where to stop. With leverage, this becomes especially critical: risk stays under control, and decisions are made without emotional pressure.
The market will always move in its own way, sometimes offering more, sometimes less. But discipline and consistency make the outcome predictable. Every such trade proves that success comes not from luck, but from a systematic approach and the ability to stay on course.

SOL: Controlled Growth On September 8, I entered a long on the 4-hour chart at $206.16 with 15x leverage. The trade is still active, but the fourth profit level has already been secured at $222. The move was strong: about $16 per coin difference, with the maximum push before reversal reaching $248.
The key in this trade was not trying to squeeze everything out but strictly following the plan. Levels were defined in advance, and each of them worked out clearly. This allowed me to hold the position calmly, even as the market accelerated.
When trading is built on a systematic approach, decisions are made without rush. Clear profit-taking points, well-defined control zones, and structured scenarios guide the process. Even when using leverage, risk stays manageable, and emotions do not interfere with logic.
The market will always deliver moves bigger or smaller than expected. But discipline and structure make the outcome predictable. When trading shifts from chaos to a plan, every position becomes a step in a consistent strategy where results are defined not by chance but by the system.
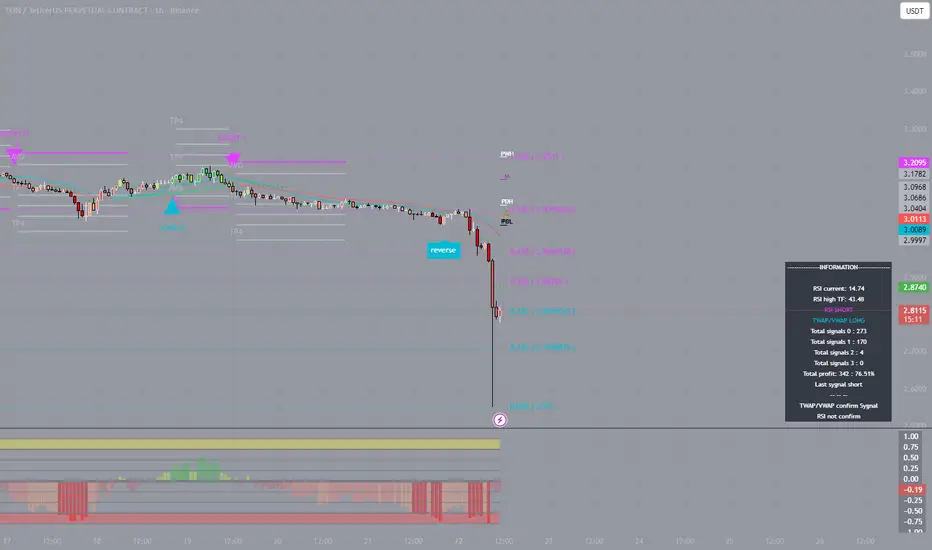
TON: Precise ExecutionOn September 19, I entered a short at $3.1313 on the 1-hour chart, using 20x leverage. The trade is still active, but the first two profit stages have already been secured. TP1 was closed at $3.0941, and TP2 at $3.0536. The difference of about 8 cents per coin, with such leverage, delivered a noticeable result.
The key here was not prediction but consistency. Levels were marked in advance, and the entire trade unfolded strictly according to plan. This approach makes it easier to handle each price swing calmly and to hold the position without chaotic reactions.
When trading is built on structure, trade management becomes straightforward. Clear profit-taking points, control zones, and development scenarios are already defined. Even with aggressive leverage, risk stays manageable, and emotions do not interfere with the process.
Yes, the move down showed potential for more, but the trader’s task is not to take everything. The real goal is to work systematically and steadily. Discipline and a clear plan turn the market from chaos into a space of opportunities, where results are defined by logic rather than chance.
The IMPORTANCE of a Structure Break - SELL EURAUDAll the information you need to find a high probability trade are in front of you on the charts so build your trading decisions on 'the facts' of the chart NOT what you think or what you want to happen or even what you heard will happen. If you have enough facts telling you to trade in a certain direction and therefore enough confluence to take a trade, then this is how you will gain consistency in you trading and build confidence. Check out my trade idea!!
www.tradingview.com

Fartcoin Faces Breakdown Risk Below $0.93After two failed attempts to reclaim $0.93, Fartcoin has slipped back to key Fibonacci support. The market is at a decisive point where either a bounce occurs or further downside accelerates.
Key Technical Points
- Double Rejection: $0.93 resistance rejected twice.
- 0.618 Fibonacci: Current support under test.
- Breakdown Target: Loss of support opens path to $0.51.
Analysis
Price action highlights clear weakness, with $0.93 acting as a ceiling. Holding the Fibonacci level is critical; a bounce here could rotate price back to retest $0.93. However, if broken, the next logical support lies at $0.51, representing a significant technical breakdown.
Market structure suggests sellers remain in control until price reclaims resistance. Bulls must defend current levels to avoid continuation lower.
What to Expect
Fartcoin sits at a make-or-break level. A rebound keeps $0.93 in play, but a breakdown exposes $0.51 as the next downside target.

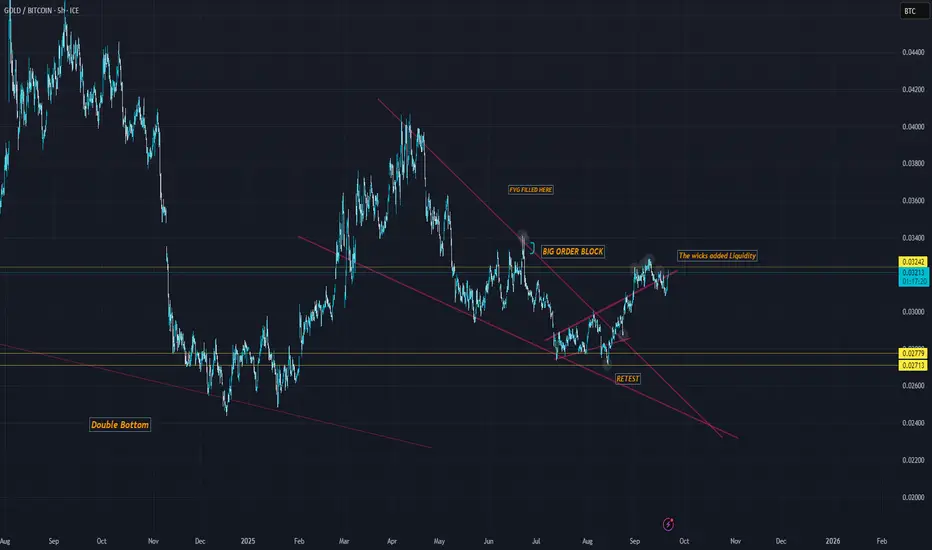
Heading North if you study XAU-BTC (TV) we have also a possible Wickoff reversal with that clean retest of the last double bottom.
When I check the cluster of liquidity on BTC we have fuel to start the Mark down.
Remember that the recent drop at 107k 98k and 74k could have strategically made to have a cost efficiency in the next market correction with those daily liquidation pool from the Long. (sell order)
Supports are 100k; 89k and 79k on BTC.
For Gold. I see liquidaiton daily level up to 4500$, I believe we can go higher.
Remember if BTC down abrutly, the chart XAU-BTC will go up if Gold keep Steady or hold better...
Big Market Correction incoming ?if you study the USDT.D we have a possible retest off the double bottom at 3.98 (possible Wickoff reversal) + we have big huge fair value gap around 7%.
I know it sounds a bit impossible to reach at the moment, be careful still.
if you study XAU-BTC (TV) we have also a possible Wickoff reversal with that clean retest of the last double bottom.
When I check the cluster of liquidity on BTC we have fuel to start the Mark down.
Remember that the recent drop at 107k 98k and 74k could have strategically made to have a cost efficiency in the next market correction with those daily liquidation pool from the Long. (sell order)
Supports are 100k; 89k and 79k on BTC

incoming Mark Down ? if you study the USDT.D we have a possible retest off the double bottom at 3.98 (possible Wickoff reversal) + we have big huge fair value gap around 7%
if you study XAU-BTC (TV) we have also a possible Wickoff reversal with that clean retest of the last double bottom.
When I check the cluster of liquidity on BTC we have fuel to start the Mark down.
Remember that the recent drop at 107k 98k and 74k could have strategically made to have a cost efficiency in the next market correction with those daily liquidation pool from the Long. (sell order)
Supports are 100k; 89k and 79k

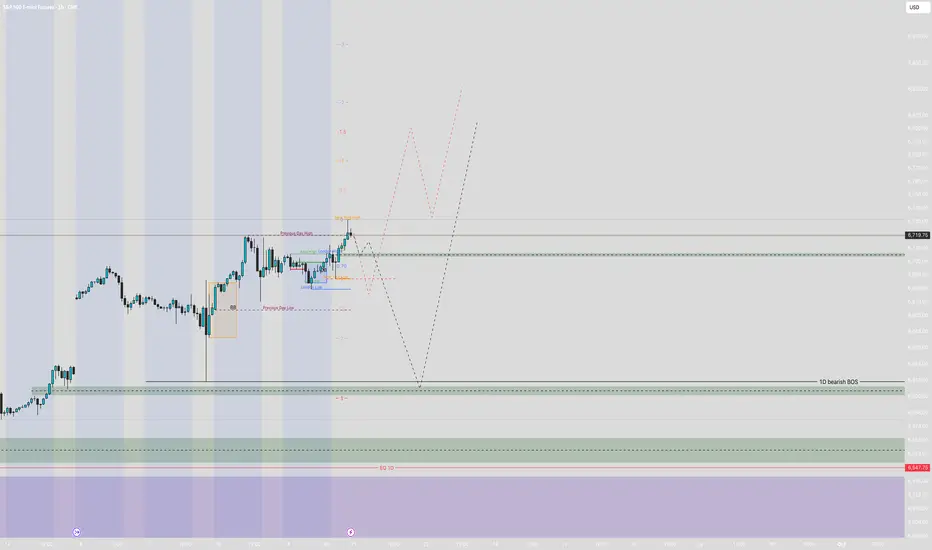
Super Bear on NQ for week 22/10 - 03/11 2025This week will show if the bears are gonna step in! A lot of positivity in the markets due to rate cuts but I'm not buying it. Sell the news will be on. Predicting NQ back to 24000 till end of the month. Bearish setup only for the rest of the month.
Always remember, Caution, Patience and Risk!
GL!
If you like the content give me a follow on X!
Check Bio. Cheers!

GBPJPY Bearish for the week commencing 22nd SeptExpecting a bullish move back into some of the internal liquidity left over from the move on friday, with a strong bearish move to counter aiming for TP's at the lower levels of low resistance liquidity.
Could decide to react off the 1H FVG left over but expecting a move to above EQ before another leg down. Will be looking to take a short at the marked areas either of 4H FVG or 1H OB above it.

ES! bearish start to the week bullish overall. We took ATH on ES & NQ last week again. Expecting a continuation on the bullish action but I think we will have a retrace into an area of liquidity first, We have this area marked below with the 4H FVG, we could wick into this while still maintaining bullish orderflow.
Could have a smaller retrace into EQ from thursdays price action before we get another leg up but will need to see what happens with price action at these points.