HBAR | Technical Analysis & Market OutlookDescription:
Hedera Hashgraph (HBAR) is a decentralized public network designed for fast, secure, and scalable transactions. Unlike traditional blockchains, Hedera uses a hashgraph consensus mechanism, enabling low fees, high throughput, and strong enterprise adoption. HBAR powers the network’s services such as smart contracts, file storage, and tokenization.
This chart presents key technical levels, potential market structure, and momentum signals to help identify possible price reactions. The focus remains on risk management and disciplined trading strategies.
📌 Remember: Markets are volatile, and no outcome is guaranteed. Always manage risk and use proper position sizing.
Disclaimer:
This is not financial advice. This content is for educational and informational purposes only. Do your own research before making any investment decisions.
Hashtags & Keywords:
#HBAR #Hedera #Crypto #TechnicalAnalysis #Trading #Blockchain #Altcoins #PriceAction #CryptoTrading #ChartAnalysis
Contains IO script

TON: Work according to planOn September 17, I opened a short position on the hourly chart from $3.1558, using 15x leverage. The trade is ongoing, but I've already managed to take three profit levels. The price dropped to $3.0508, and the difference was more than 10 cents per coin. With high leverage, the result is immediately noticeable, although the market, of course, recouped some of the movement.
The key here was consistency, not guesswork. The zones were identified in advance, and I followed them step by step. This allowed me to calmly hold the position, without chaos and unnecessary pressure.
When trading is structured, managing the trade becomes easier. It's clear where to partially close, where to wait for the next target, and where to simply keep a cool head. Even with aggressive leverage, risk remains under control, and emotions fade into the background.
The market will always offer more than you can take. But it's discipline and consistency that turn every move into a controlled process, where the outcome is determined not by luck, but by the ability to follow through. plan.


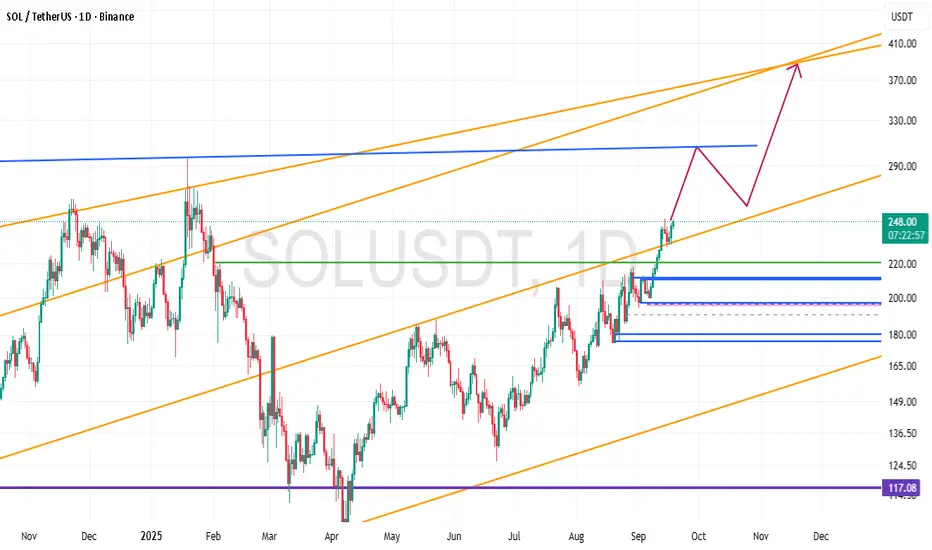
Technical Analysis Report: Solana (SOL/USDT)Current Price: ~$248
Solana is currently trading within a bullish ascending channel on the daily timeframe. The overall mid-term trend remains positive, supported by higher highs and higher lows.
🔑 Key Levels
Support Zones:
$220 → psychological support and trendline retest
$200 → major structural support (critical level)
$180 → strong support in case of a deeper correction
Resistance Zones:
$290 → short-term resistance and potential rejection area
$370 → upper boundary of the channel and main bullish target
📈 Possible Scenario
Price may extend its rally toward $290.
A corrective pullback to the $250–260 range could follow.
If momentum holds, the next bullish target lies around $370 at the channel top.
⚠️ Risk Notes
As long as SOL holds above $200, the bullish trend remains intact.
Losing the $200 support could trigger a decline toward $180.
Risk management and stop-loss placement are essential due to possible short-term volatility.
📌 Summary
Solana maintains a bullish outlook while trading inside its ascending channel. The medium-term upside targets stand at $290 and $370, with key supports at $220–200. Short-term corrections are possible, but the overall structure favors further upside as long as $200 holds.
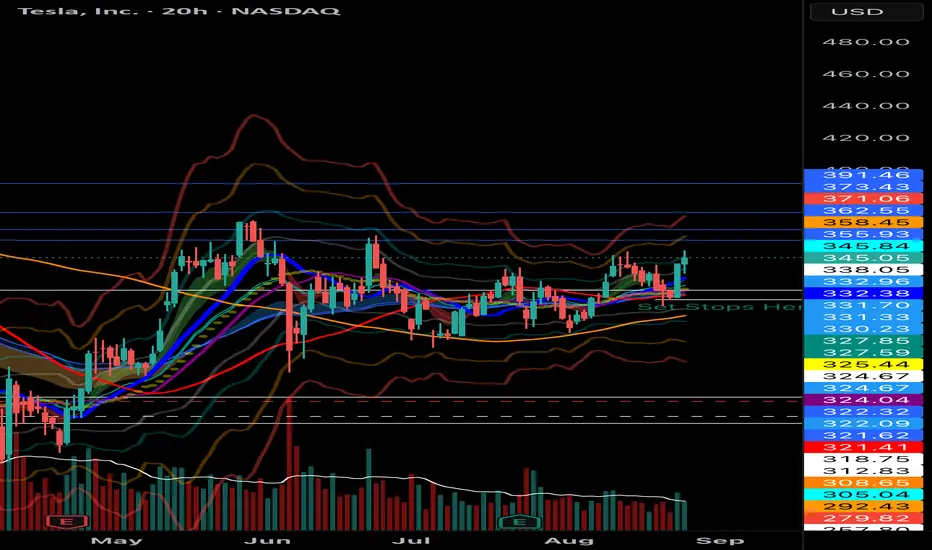
TSLA Volatility Contraction Pattern (VCP) LONG When TSLA breaks above 350 and closes, the price will launch to $390 very quickly.
A VCP is a technical pattern, showing lessening declines in a range bound formation. A bull flag showing higher-lows is the best, as seen with TSLA.
Volatility is going to breakout sharply to the upside. If you TSLA above 350 just buy and hold, you’re too late trying to get a better deal.
🚀🚀🚀🌖
Will this be a meaningful chart?internet bubble vs AI bubble.
back in 2000 internet speculation lead markets, today same is happening but for A.I euphoria.
Stay safe

CRO Pushing Toward 8.6BPrice is moving steady above 8.3B support.
Buyers pushing toward the next level at 8.6B target.
Momentum looks strong with clean upward candles.
As long as 8.3B holds, upside remains open.

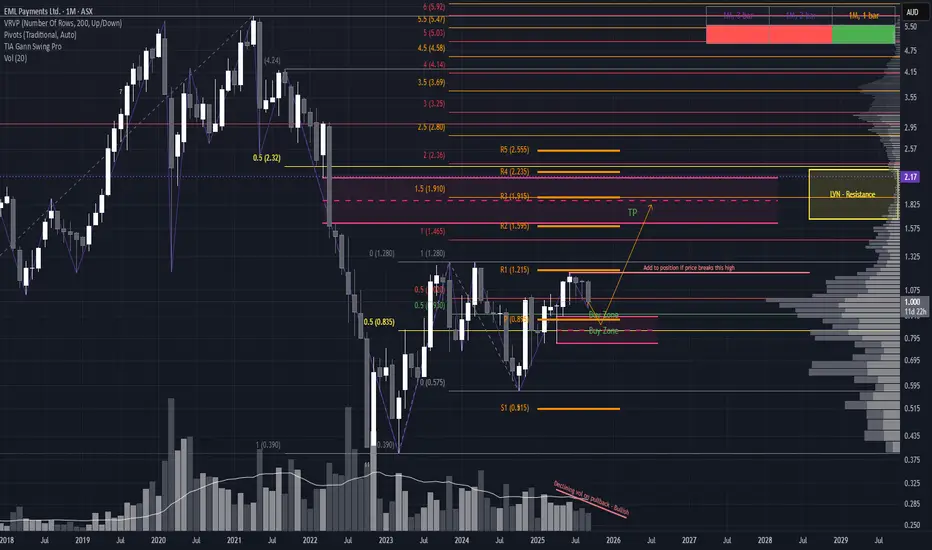
Small-Cap Setup with Big PotentialAnother promising setup is forming on EML. As always, keep in mind this is a small-cap play, so risk management is key. While the monthly uptrend isn’t yet fully established, the current structure offers multiple trade scenarios worth watching.
Trade Scenarios
1. Conservative Breakout Entry For those preferring confirmation, a long entry could be triggered on a clean break and close above $1.195 (as highlighted on the chart).
Stop Loss: Below the newly formed swing low
Target: $1.825, where notable resistance resides
2. Ideal Pullback Entry The optimal setup would be a pullback into a strong Area of Interest, supported by:
50% range retracement
Yearly pivot
Demand structure from the large April wick
If price forms a hammer/bullish candle in this zone, it could signal a high-probability reversal and offer a strong entry point.
SL placement depends on candle structure, but should invalidate below the demand zone
🎯 TP remains at $1.825, aligning with historical resistance
XAUUSDPrice action trading is a methodology where traders make decisions based on the interpretation of actual price movements on a chart, rather than relying primarily on lagging indicators. It involves observing and analyzing candlestick patterns, trend lines, support and resistance levels, and volume to identify potential trading opportunities and manage risk. The focus is on understanding the story the market is telling through its price behavior.

MemeCore (MEMECORE) – Technical Outlook & Key LevelsDescription:
MemeCore (MEMECORE) is a trending digital asset in the meme ecosystem, gaining attention for its strong community-driven growth and speculative interest. While its fundamentals are still developing, the token shows increasing trading volume and social sentiment, which often drives momentum in similar assets.
In this analysis, I highlight critical support and resistance levels, potential breakout zones, and areas of interest for both short-term and mid-term traders. Market structure and price action remain the primary focus, supported by volume analysis and trend confirmation.
⚠️ Disclaimer: This is not financial advice. The content is for educational and informational purposes only. Please do your own research and manage risk accordingly.
#MemeCore #MEMECORE #Crypto #Altcoins #TechnicalAnalysis #TradingView #CryptoTrading #PriceAction #CryptoCommunity #AltcoinGems
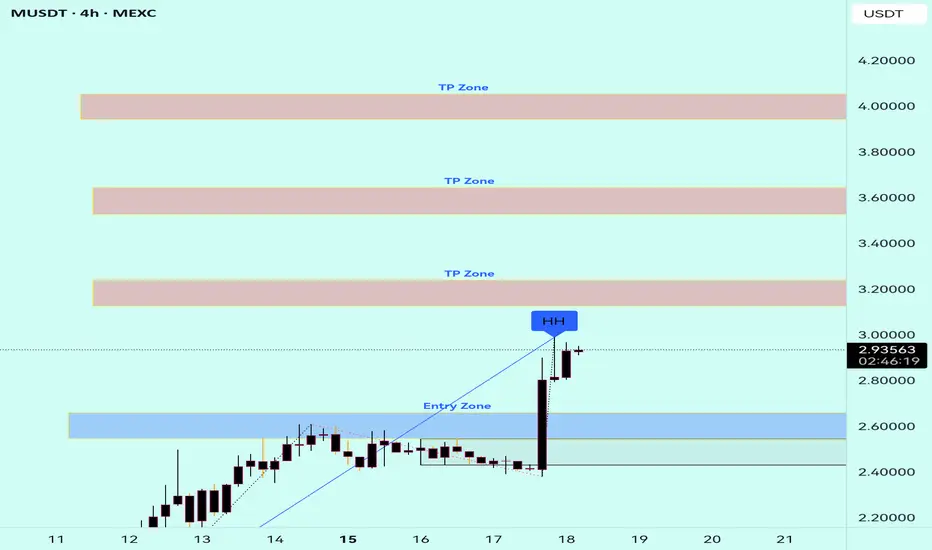
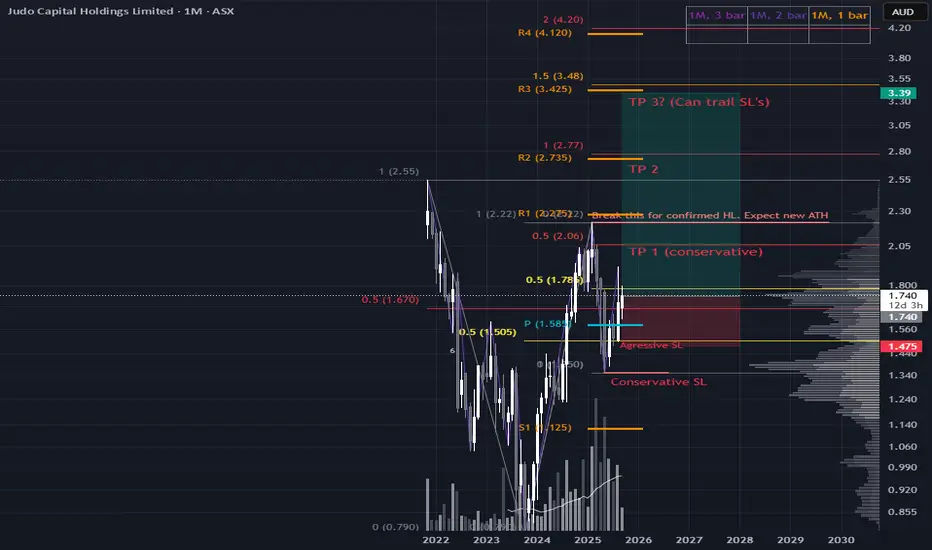
Risk-Managed Setup with Upside TargetsPrice has pulled back into a meaningful area of interest. While the entry is slightly delayed, the risk-to-reward remains attractive.
Trade Options
Conservative Entry: Wait for a break and close above $2.22. This would confirm bullish momentum and open the door for much higher prices.
Stop Loss (SL): Below $1.340
Aggressive Entry: Enter now, acknowledging that most of the month’s move has already played out.
SL Options:
Below the August low for wider protection
Or a tighter SL at $1.345, since a confirmed higher low (HL) hasn’t formed yet
W (Walmart) – Technical Outlook with Key Support & Resistance LeDescription:
Walmart Inc. (NYSE: W) is one of the world’s leading retail corporations, known for its strong revenue streams and defensive positioning in the consumer sector. Despite global market challenges, Walmart has shown resilience supported by steady fundamentals, stable cash flow, and consistent dividend history.
This chart highlights important technical zones, focusing on trend dynamics, support, and resistance levels that could shape upcoming market behavior. Both long-term investors and short-term traders may find key signals worth monitoring.
⚠️ Disclaimer: This is not financial advice. The content is for educational and informational purposes only. Always do your own research before making investment decisions.
#Walmart #W #StockMarket #TechnicalAnalysis #Retail #NYSE #TradingView #Investing #Stocks
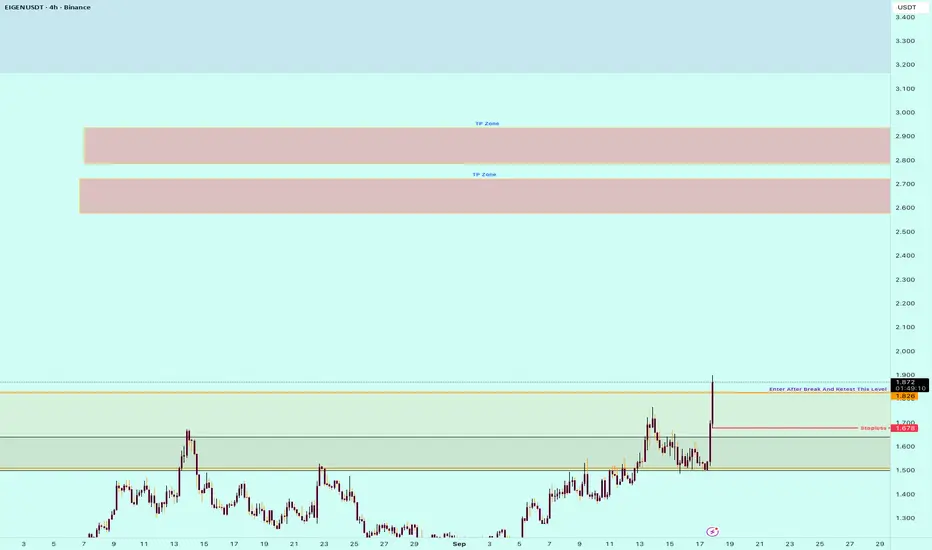
Eigen (EIGEN) – Technical Outlook & Market StructureDescription:
Eigen (EIGEN) is an emerging project in the blockchain space, focusing on decentralized infrastructure and scalability. While still at an early stage, it has gained increasing attention due to its innovative approach to security and validator participation.
This analysis highlights key technical levels, market structure, and potential trading opportunities based on price action and momentum indicators. The chart setup aims to identify possible support/resistance zones and trend continuation or reversal signals.
⚠️ Disclaimer:
This is not financial advice. The content shared is for educational and informational purposes only. Always conduct your own research before making any investment or trading decisions.
Keywords / Hashtags:
#EIGEN #EigenCrypto #CryptoTrading #TechnicalAnalysis #Blockchain #Altcoins #MarketStructure #CryptoCharts #TradingView #PriceAction
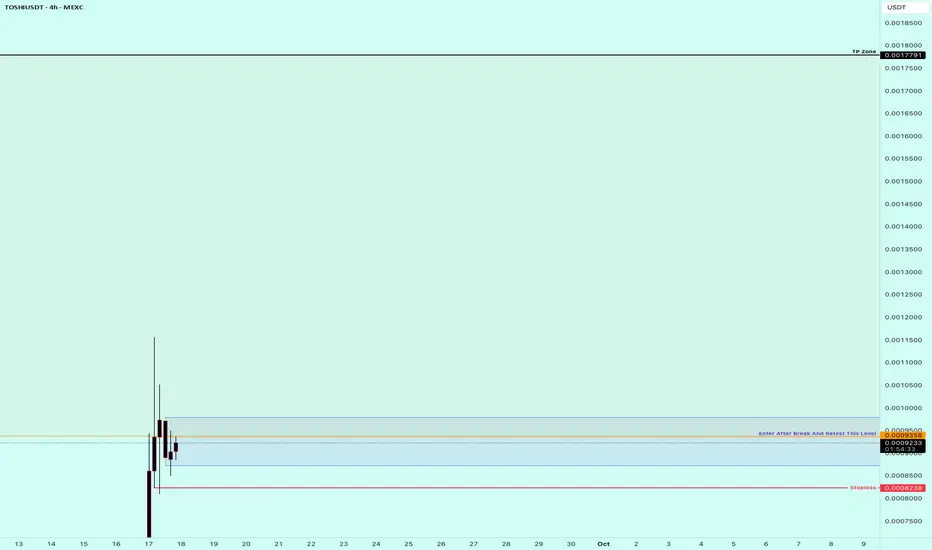
TOSHI Technical Analysis | Key Levels & Market OutlookDescription:
Toshi ($TOSHI) is a community-driven cryptocurrency built on Ethereum, focusing on decentralization and long-term adoption. Despite being relatively new, it has gained attention through strong community support and rapid trading activity.
In this analysis, I highlight critical support and resistance levels, trend structure, and potential breakout zones to watch. Market sentiment and volume dynamics remain essential in shaping short-term price direction.
⚠️ Disclaimer: This is not financial advice. The content is for educational and informational purposes only. Always do your own research before making investment decisions.
#Toshi #Crypto #TechnicalAnalysis #Ethereum #Trading #PriceAction #CryptoCommunity #Altcoins #MarketOutlook
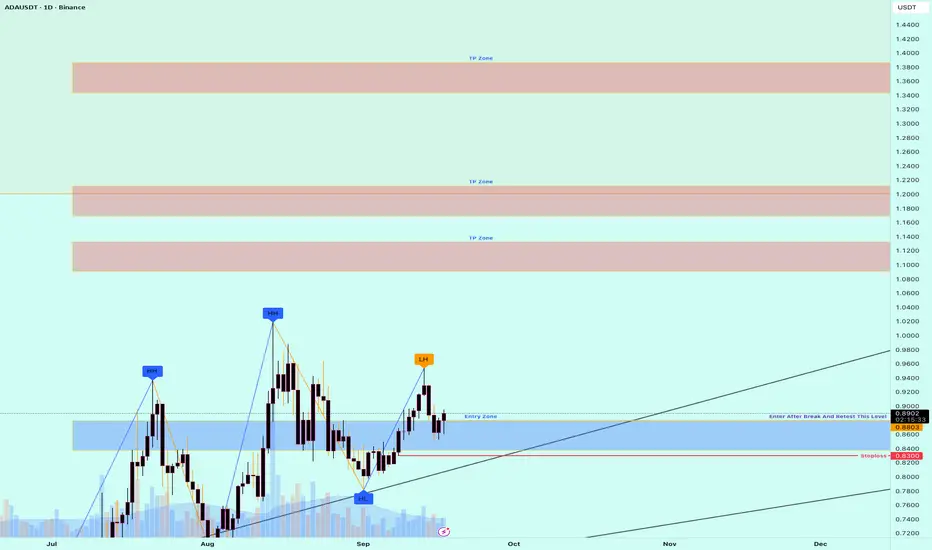
Cardano (ADA) – Technical Outlook and Key Market LevelsDescription:
Cardano (ADA) is one of the leading blockchain platforms, designed for scalability, interoperability, and sustainability. Its native token ADA ranks among the top cryptocurrencies by market capitalization, supported by a strong developer community and ongoing upgrades such as smart contracts and ecosystem growth.
In this analysis, I share a clean technical outlook on ADA with focus on key price levels, trend structure, and momentum signals. The chart highlights potential scenarios for both bullish and bearish traders, providing insights into short- and medium-term opportunities.
⚠️ Disclaimer: This is not financial advice. The content is for educational and informational purposes only. Always do your own research and manage risk responsibly.
#Cardano #ADA #Crypto #Blockchain #TechnicalAnalysis #CryptoTrading #Altcoins #ChartAnalysis #PriceAction
MYX – Technical Outlook and Key Market InsightsDescription:
MYX has recently shown increased attention within the market due to its potential growth in both trading activity and investor interest. From a fundamental perspective, MYX is positioned in the *, where demand is supported by rising adoption and long-term sector expansion.
This analysis highlights important technical levels, trend direction, and market behavior to better understand potential opportunities and risks. The focus remains on key support and resistance areas, momentum indicators, and volume dynamics that may influence short- to mid-term movement.
⚠️ Disclaimer:
This is not financial advice. The content shared is for educational and informational purposes only. Please conduct your own research before making any investment or trading decisions.
#MYX #TradingView #TechnicalAnalysis #Crypto #Stocks #PriceAction #MarketInsights #Investing #ChartAnalysis

BTC Dominance Breaking Down – Altseason Loading
After the FOMC rate cut, liquidity has started to flow slowly into Altcoins. 📈
We already saw a shallow retracement on higher timeframes, and now Bitcoin dominance is dropping again – which means the path is opening for a strong Altcoin rally. 🔥
This is a very positive sign for us, and it shows that alts still have room to grow. 🌊
I’m already working on scanning the markets and looking for fresh trading signals for the coming days, Insha’Allah.
Stay patient, stay focused – the opportunities are building up. 🚀✨

This is what is going to happen with BTC today, FOMC daMy FOMC-Day Playbook (Trader’s Read)
Probabilities (today)
• Sell-the-news (spike then fade): ~60%
• Mini altseason (ETH leads, large caps follow): ~25%
• BTC bullish continuation after the announcement: ~15% ← my BTC-only continuation probability
Why my odds look like this
• Funding is low → no derivatives euphoria; any rally needs spot demand to sustain.
• Open interest is rising slowly → tape is more spot-led than leverage-led (healthier, but needs follow-through).
• DVOL slightly elevated + 25Δ skew tilted to puts → market is defensive into the headline; easy to fade if spot inflows don’t show.
• ETF volumes are moderate (IBIT/FBTC/ETHA) → by themselves they don’t signal a mega inflow day.
What would push odds toward continuation (BTC or mini-alts)
• 3:50–4:00 ET auctions print big in IBIT/FBTC/ETHA.
• EOD net flows ≥ $300–500M (bonus if ETH also prints strong).
• Post-headline vol crush (DVOL ↓), skew normalizes, funding ≤ 0.01%, OI up gradually (spot-led), and acceptance above resistance.
What would keep/raise sell-the-news risk
• Weak/negative EOD flows.
• Break attempts with funding ≥ 0.03% and OI ramping (crowded longs).
• DVOL ↑ and skew leans further to puts during the spike.
• Repeated rejections near BTC resistance (e.g., ~116–117k) with upper wicks.
1-Minute Checklist (before & after the announcement)
1 Spot vs perps: if spot leads and funding stays low, I prefer buying pullbacks over chasing.
2 DVOL / Skew: DVOL down + skew normalizing ⇒ continuation; DVOL up + skew to puts ⇒ fade more likely.
3 ETFs: watch closing-hour volume today; then confirm EOD net flows tonight:
◦ ≥ $300–500M ⇒ I carry a long/buy-the-dip bias into D+1.
◦ ≤ 0 ⇒ I favor fading resistance into D+1.
Operational stance (how I’ll trade it)
• Base into the headline: cautious. I won’t chase the first candle.
• Fade setup: if the breakout comes with funding/OI spiking and wicks near resistance, I treat it as spike-and-fadeback into the prior range (tight risk).
• Continuation setup: if I see vol crush + strong flows and acceptance above resistance, I flip to continuation mode and buy dips, with invalidation below the most recent reclaimed level.
This is my real-time framework, not financial advice. I’ll update the bias if the auction and EOD flows materially change the picture.

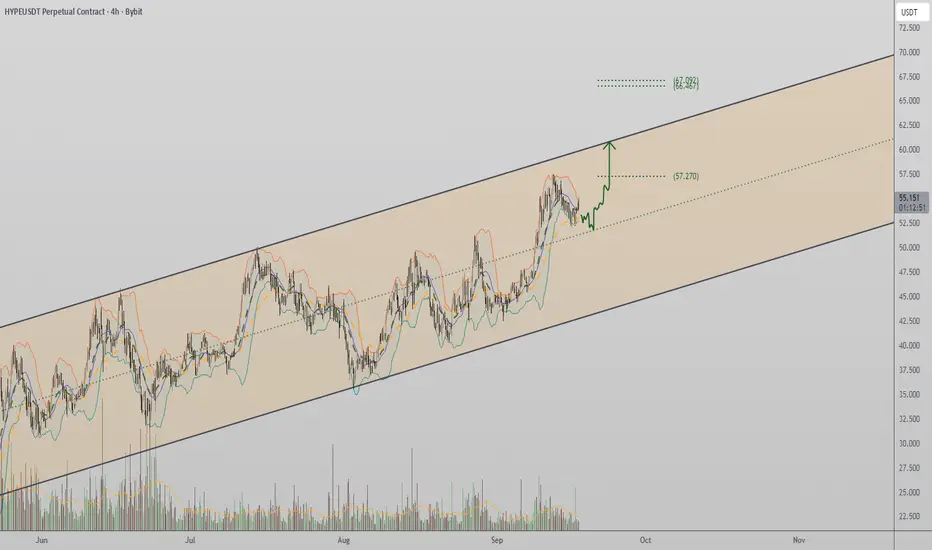
Hyperliquid Positions for $60 Fibonacci ExtensionHyperliquid continues to build on its bullish momentum, with price action forming consecutive higher highs and higher lows. The next technical target sits at $60, aligning with the 0.618 Fibonacci extension.
Hyperliquid has stood out as one of the strongest trending altcoins, maintaining an orderly bullish structure. Price is currently trading near the upper echelons of its range, with clear technical confluence pointing toward a move into the $60 level. The sustainability of this rally depends on whether support zones beneath can hold.
Key Technical Points:
Consistent higher highs and higher lows maintain bullish momentum.
Price trading near the upper band of its range.
$60 target aligns with Fibonacci extension confluence.
The structure of Hyperliquid’s chart remains impressive, with buyers consistently stepping in to defend support. This pattern of higher lows signals persistent demand, while higher highs confirm momentum continuation. Price is now pressing near the top of its range, where many traders expect resolution toward the $60 extension target.
The Fibonacci extensions of the current impulse leg reinforce this target, with the 0.618 level providing a strong technical anchor. Historically, this zone has acted as both resistance and a magnet for continuation moves. Should the trend maintain its rhythm, the probability of a test of $60 in the short term remains high.
Traders should, however, remain aware of potential consolidations or retracements. A failure to hold support could open the door for a pullback into mid-range levels, though such dips would likely be seen as opportunities in a bullish context.
What to Expect in the Coming Price Action:
Hyperliquid is poised for a potential move into $60, provided bullish structure remains intact. Volume confirmation will be key in sustaining this momentum, with support retests likely to define the pace of the move.
BNB Targets $1100–$1200 After Reclaiming All-Time HighsBNB has decisively reclaimed its all-time highs, reinforcing its strong bullish market structure. Technical projections suggest the next Fibonacci extension lies between $1100 and $1200, offering the next clear target zone.
Among major altcoins, BNB has shown one of the most impressive structural recoveries, reclaiming its all-time highs and maintaining strong momentum. The weekly chart highlights a bullish projection with higher targets still to come, supported by Fibonacci extension confluence. Traders now anticipate whether BNB can maintain its trajectory toward the $1100–$1200 zone.
Key Technical Points:
Reclaimed all-time highs, confirming bullish continuation.
Strong weekly trend structure supports further gains.
Next 0.618 Fibonacci extension sits at $1100–$1200.
BNB’s strength lies in its ability to overcome major resistance at previous highs. This reclaim often signals renewed momentum, opening the path to new price discovery zones. Current price action remains bullish across higher timeframes, with no signs of structural weakness.
The 0.618 Fibonacci extension of the current move projects a range between $1100 and $1200. This makes the zone a logical magnet for price action as traders seek new targets. Given the bullish demand observed in the order books and strong participation on the weekly chart, continuation higher remains the dominant bias.
However, traders should remain cautious of corrective pullbacks. Any sharp retests of reclaimed support levels should be viewed in the context of continuation, provided the overall structure of higher lows remains intact.
What to Expect in the Coming Price Action:
BNB’s technicals point toward higher prices in the immediate short term, with the $1100–$1200 zone standing as the next major target. Corrections may occur, but the broader weekly structure remains firmly bullish.

RIVN Looks ready to pop soon...Compression in price usually leads to expansion. Good chance it's to the upside I'd say, but lets see! Building a position down here regardless as it looks kinda good.

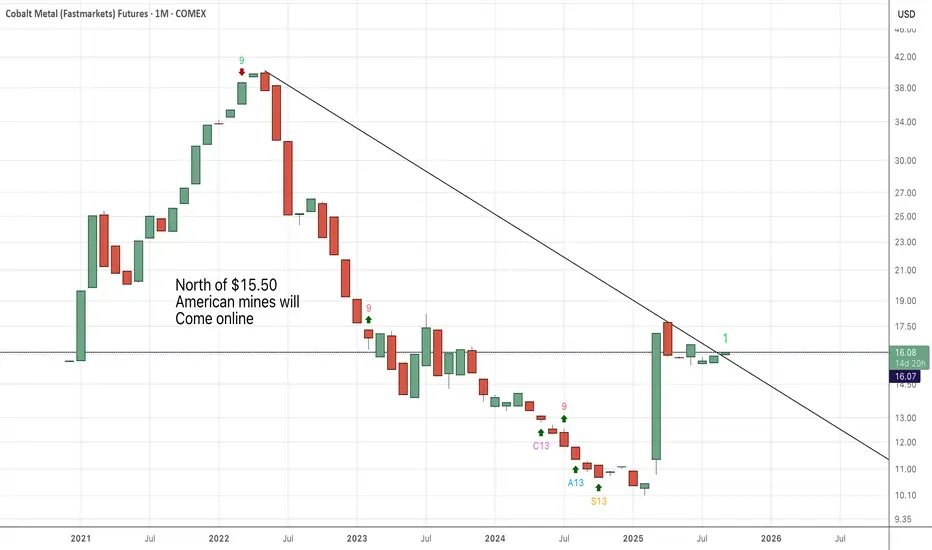
CobaltCobalt spot is assuming a bullish posture as it breaks the all-in cost level once again. Gold is also into fresh highs and Uranium is also upturning along with the U miners. I'm all in on the rare earth and conflict mineral super cycle, and I have no blinders on. I know how long the runway is for all of these charts. Tell me a ticker that I don't know about that is worth mentioning, and I'll give you a better chart.
XAU OUTLOOK 16-09-25Hey Guys, This is what what I see today.
BUY/SELL SCENARIOS:
BUYS:
1) Retest the 4h Bullish FVG at the 3675.98 level.
2) Create a 3/5m Bullish CHoCH with a body candle close (with a FVG).
3) Retest the 3/5m Bullish CHoCH level to capitalize on BUYS towards the 3710.00 level.
SELLS:
1) Body candle close below the 3664.35 level.
2) Retest the failed 4h Bullish FVG at the 3664.35 level.
3)Create a 3/5m Bearish Engulfing candle to capitalize on SELLS
towards the 3626.70 level.
Trade Smart, Trade according to your Trading Plans. This is not financial advise. Cheers!
