SQD long ideaSQD is printing a bull flag, the tiniest in the history, let alt season make it worth longing RR 33 from here
Contains IO script

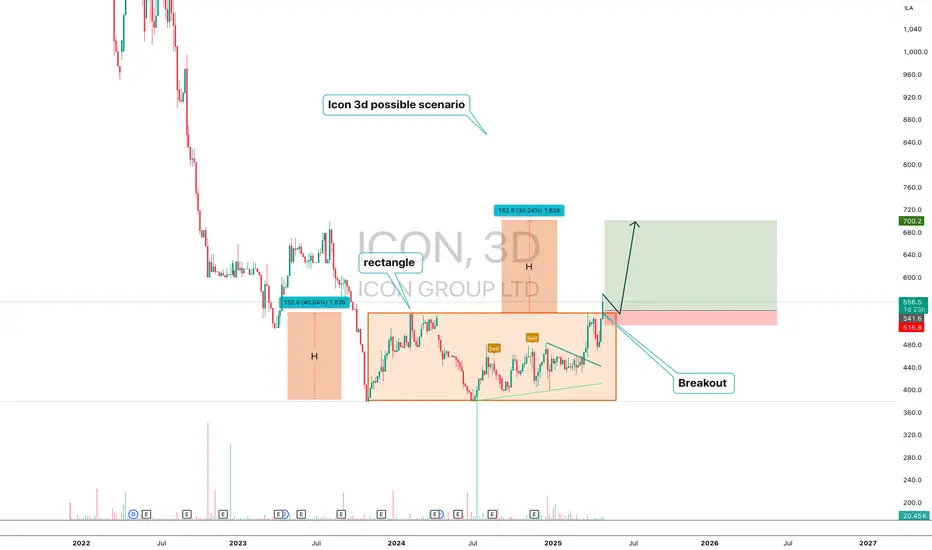
ICON — Breakout from Rectangle with H Projection Targeting $700ICON (3D) — Technical Structure Analysis
ICON has broken out from a prolonged horizontal rectangle pattern ($380–$540). The move activated a measured move structure with two H-sized waves. The first H was completed. The second H projects a move to the $700 area.
Key points:
-Confirmed breakout from range
-First H = 153 pts, completed
-Second H = 162 pts, targeting $700
-Price holding above breakout zone ($515–$541)
ICON has moved out of accumulation and entered trend expansion. As long as the support holds, the scenario remains valid. The technical model targets the $700 area.
LTCUSD 2D chartSleeping LTC working on the breakout. As btc.d is marking a higher low, we have no doubt ltc will make it back into the top 10 of the crypto market by market cap. solid fundamentals support this idea.

Aud bullish head and shouldersAudi’s bullish head and shoulders
Plus oscillators
The AUD/USD pair posts a fresh 10-month high near 0.6670 during the European trading session on Friday. The Aussie pair strengthens as the Australian Dollar outperforms its peers amid cheerful market sentiment. S&P 500 futures are marginally down during the European trading session, but gained 0.85% on Thursday.

EURAud trendy bearish head and shoulders for the winEURAud gave a head and shoulders sell signal.
All technical indicators said sell and this paid off well
The Aussie pair strengthens as the Australian Dollar outperforms its peers amid cheerful market sentiment. S&P 500 futures are marginally down during the European trading session, but gained 0.85% on Thursday.

GBPJPY bullish head and shoulders with room to growGJ is showing very good upside potential. This is based on head and shoulders… gj needs room to run and is showing another head and shoulders up
a broadly weaker Japanese Yen on Friday. Market concerns about the political uncertainty in Japan are weighing on the JPY, pushing the pair Up!

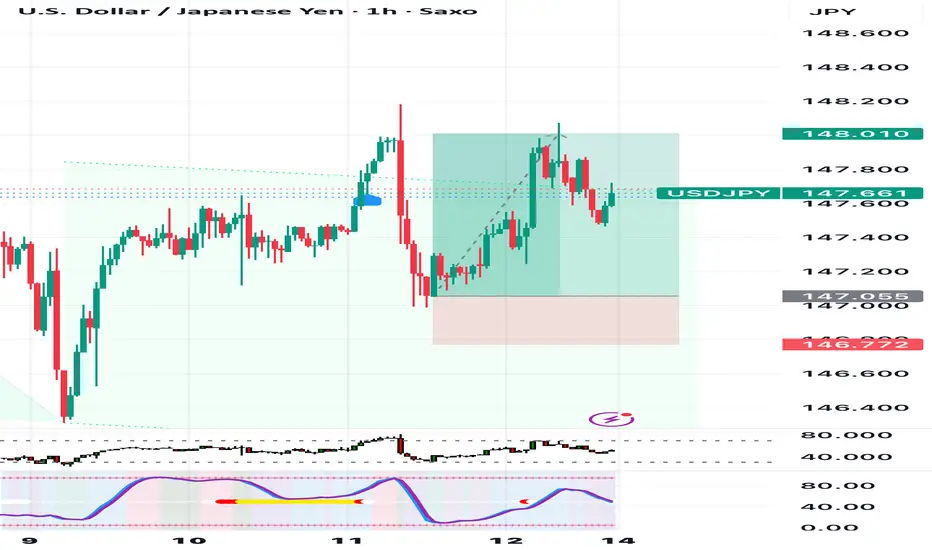
Usdjpy has been showing bullish head and shoulders buy patternsUsdjpy gave a technical bullish head and shoulders pattern, patience pays… waited for rsi to line up. And it matched fundamentals:
The US Dollar is regaining lost ground against a broadly weaker Japanese Yen on Friday. Market concerns about the political uncertainty in Japan are weighing on the JPY, pushing the pair to 187.90. From a longer perspective, however, the pair has kept trading sideways roughly between 146.00 and 149.00 since early August
Head and shoulders pattern for the winBit coin showed a big 30 min head and shoulders to the upside!
Price has continued to push up using the trading view premium Head and shoulders pattern along with the technicals overview. Short term m3 shows a short head and shoulders pattern for scalpers and day traders from Friday

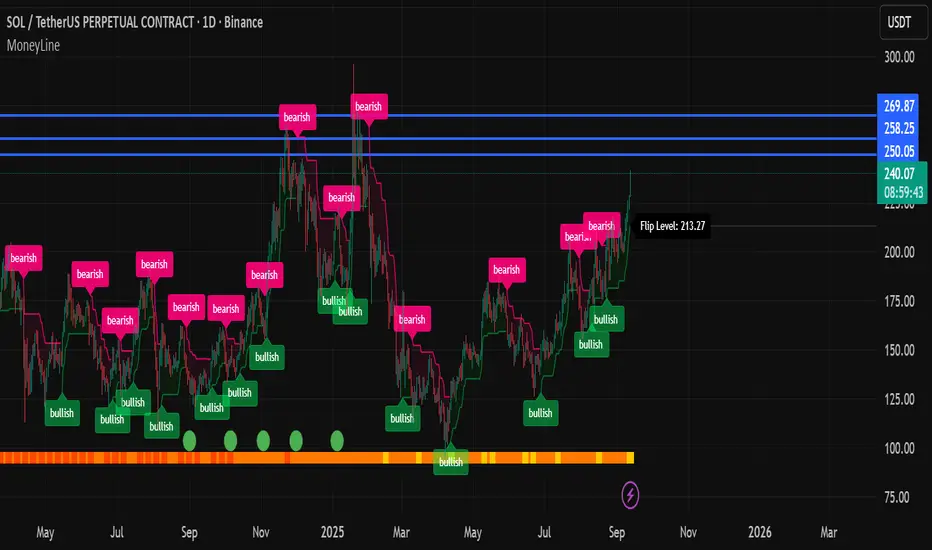
$SOL breakoutbeen waiting for quite sometime for this to break.
taking a good size low lev long on todays close.
invalidation if we get a daily close below the tl, really good r/r to ignore
gl

ZEUSUSD Long ideaZEUSUSD printed inv H&S, Classic bullish divergence. higher high.
40% up to the daily 200EMA in confluence with resistance.

Solana runIn my opinion these three levels for Solana will be very important over the next 24 hours. Hopefully we don't lose momentum over the weekend but it is to be expected. However should we not lose Momentum and breakthrough these levels of resistance anything is possible.

Wyckoff VSA - Why Buying Happens On Down Moves/Selling Up MovesThe Markets move on supply and demand, no supply and no demand and cause and effect, effort vs result.
This short video shows why and how.

NZDUSDPrice action trading is a methodology where traders make decisions based on the interpretation of actual price movements on a chart, rather than relying primarily on lagging indicators. It involves observing and analyzing candlestick patterns, trend lines, support and resistance levels, and volume to identify potential trading opportunities and manage risk. The focus is on understanding the story the market is telling through its price behavior.

Indus Tower looks bullish for short term target of 385.Indus Towers once Crosses 360 will be bullish for 385 target in short term.
It is trading above all moving averages and looks bullish with great volume for the target of 385 in a short term.
My Recommendation is to hold and add on dips.
Thanks!

GBPUSDPrice action trading is a methodology where traders make decisions based on the interpretation of actual price movements on a chart, rather than relying primarily on lagging indicators. It involves observing and analyzing candlestick patterns, trend lines, support and resistance levels, and volume to identify potential trading opportunities and manage risk. The focus is on understanding the story the market is telling through its price behavior.

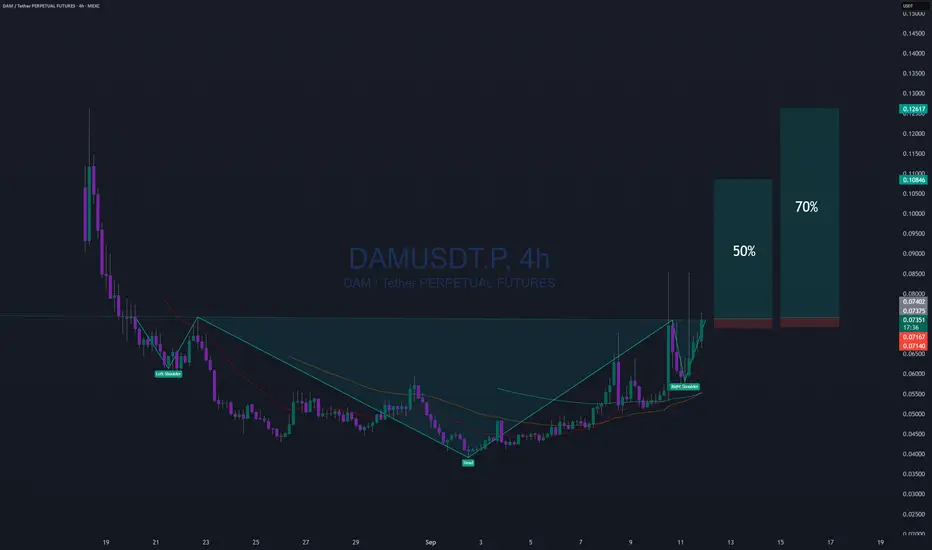
DAMUSD long based on inv. H&SDAMUSD
DAMUSD long based on inv. H&S.
will it retest the neckline, not sure, those alts are doing what ever they want. we already have two nasty wicks , so it might move freely all the way up
OVERBOUGHT or OVERSOLD = NO VALUE = NO TRADEAll the information you need to find a high probability trade are in front of you on the charts so build your trading decisions on 'the facts' of the chart NOT what you think or what you want to happen or even what you heard will happen. If you have enough facts telling you to trade in a certain direction and therefore enough confluence to take a trade, then this is how you will gain consistency in you trading and build confidence. Check out my trade idea!!
www.tradingview.com

XAU/USD OUTLOOK TODAY 12-09-25
XAUUSD 15M Analysis
BUY/SELL SCENARIOS:
BUYS:
1)Body Candle Close above the 3638.30 level.
2) Retest the 15m Bullish CHoCH at the 3638.30 level.
3)Create a 3/5m Bullish Engulfing Candle to capitalize on BUYS towards the 3657.65 level.
SELLS:
1)Body candle close below the 3630.52 level.
2)Retest the 15m Bearish CHoCH at the 3630.52 level.
3)Create a 3/5m Bearish Engulfing candle to capitalize on SELLS towards the 3613.00 level.

HRTG Bull Flag BreakoutBull flag has been forming since May and looks to be breaking out. Targeting first trim @ 25, has potential to hit 25.5 and 26 based on previous levels.
17Oct2025 22.5c @ 2.45

BKE New ATH With Golden CrossAfter touching with this upper resistance level four times in the last 15 years BKE has finally broke out yesterday with volume. BKE has also formed an ascending channel over the last 4 years. Lastly the 100 day SMA crossed above the 200 day SMA.
Entering 60c 19Dec2025

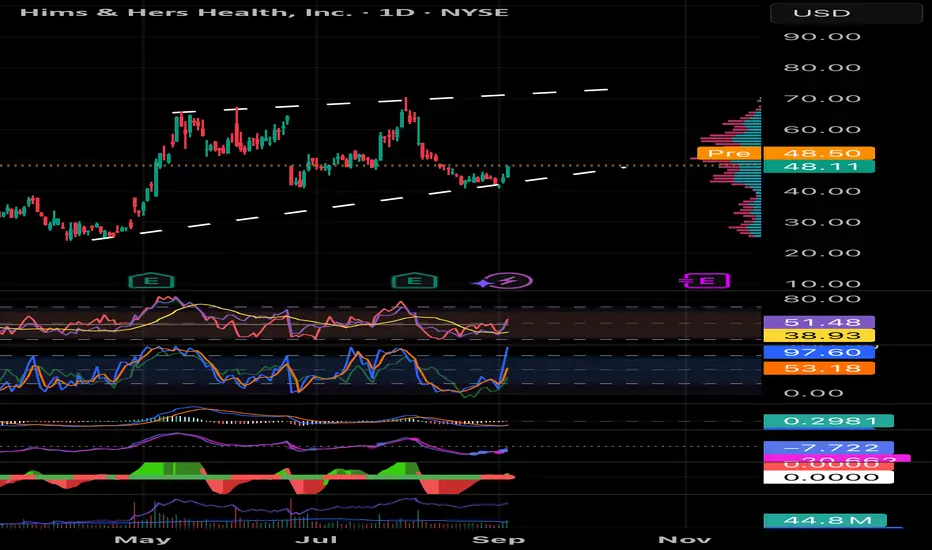
HIMS Bouncing Off Ascending Support HIMS is bouncing off an ascending support, as well as the 200day SMA. It has rising volume with MACD crossing above signal line.
Entering 48c 19Dec2025
MOD Breakout to a New ATHMOD yesterday broke through a key resistance at 143 yesterday (previous ATH) with more than 2x avg volume. It did so after forming a chart pattern resembling a cup and handle since January. Furthermore the jump yesterday led to the cross of the 100sma over the 200sma.
Options Chain Analysis reveals put/call ratio of 0.39 adding market sentiment as well.
Entering 160c 17Oct2025 @ 6.5
SL is previous day low of 147.57
