What Does a Range-Bound Market MeanThe market isn’t always driven by dynamic, trending moves. There are periods when price seems to “freeze” between levels, moving up and down but without a clear direction. This condition is called a range-bound market, or flat (sideways movement). Such phases often become a real test for traders because trend-following strategies stop working, and chaotic trades frequently lead to losses.
What Is a Range-Bound Market
A range-bound market is a section of the chart where price oscillates within a narrow channel, repeatedly testing support and resistance levels without a decisive breakout. In such phases, the market is essentially “resting” after a strong move, consolidating energy and preparing for the next impulse.
From a market psychology perspective, flat conditions represent a balance between buyers and sellers. Some participants wait for a favorable entry point, while others lock in profits or reduce exposure. As a result, price fluctuates within a corridor until an imbalance of forces triggers a breakout.
Why Flat Conditions Are Risky
At first glance, sideways movement may seem safe: price isn’t crashing or soaring dramatically. But this is exactly where the danger lies for traders.
- False breakouts: Price often moves beyond the range briefly, creating the illusion of a new trend, only to snap back. Traders who rushed in usually end up with losses.
- Increased transaction costs: Frequent entries and exits within a range lead to numerous small trades, and commissions eat into potential profits.
- Emotional burnout: A prolonged sideways market makes it hard to stay focused. Mistakes stem from fatigue and the urge to “make something happen.”
That’s why many traders consider a range-bound market the worst state: it offers little directional movement but creates plenty of opportunities to overtrade and lose.
How to Trade During Flat Conditions
The most common mistake is trying to trade a flat market the same way as a trending one. Instead, a different playbook applies here.
- Define the range boundaries: Support and resistance levels become critical. Mark them clearly and pay attention to repeated touches.
- Trade from the edges: It’s usually better to enter near support (buy) or resistance (sell) rather than in the middle of the range.
- Take profits quickly: Don’t expect large moves. Targets in range trading are much smaller than in trending conditions.
- Reduce trade frequency: Avoid reacting to every small price swing. Wait for confirmations at levels and act selectively.
- Watch the volume: Breakouts are often accompanied by a volume spike. That can be the first signal of a directional move ahead.
When to Expect a Breakout
Every range eventually ends. The question is when and in which direction. To avoid guessing, look for signs of preparation:
- Price starts compressing within the range, forming a triangle pattern.
- Trading volume decreases, followed by a sudden surge.
- Support or resistance levels get tested more frequently.
A breakout confirmed by price consolidation above resistance or below support usually marks the start of a new trend. These moments often create the best entry opportunities.
Why a Systematic Approach Matters Most
Most traders lose money in sideways markets not because they lack knowledge, but because they give in to emotions. The urge to chase every move, fear of missing “the breakout,” or frustration from inactivity turn trading into random gambling. A systematic approach changes the picture. When a trader has a clear algorithm—how to spot ranges, which levels to mark, where to take profits, and when to wait for a breakout—the market becomes structured, not chaotic. Discipline is even more important in flat conditions than in trends, because this is where the foundation for the next strong move is laid.
The Practical Value of Automation
Flat phases are where automation tools are especially helpful. Algorithms that highlight levels, suggest take-profit zones, and manage risk allow traders to avoid guesswork and emotional mistakes.
- For beginners, this serves as a navigation tool: they learn to recognize market structure and understand when to act and when to stay out.
- For experienced traders, automation supports discipline, speeds up analysis, and reduces emotional bias.
Conclusion
A range-bound market isn’t the enemy of traders—it’s a natural state of the market. It may be exhausting with its unpredictability and tempting false moves, but these periods build the energy for future trends.
Traders who can identify flat conditions and follow a structured system not only protect their capital but also position themselves for strong moves that always follow consolidation.
The market will always test traders’ nerves. But with discipline, technical analysis, and automation, even the chaos of a sideways phase becomes a controlled process. And that’s what separates random luck from consistent results.
Contains IO script

BNB: Downward TrendOn August 24, the BNB market turned into a downward move on the 1-hour chart from the $871 level. Since then, price has steadily moved through profit-taking zones and reached a low of $832, giving a difference of nearly $40 per coin. The trade has already passed four targets and remains active, keeping potential for further continuation.
The main value here lies in management. The algorithm step by step highlighted profit-taking zones and helped relieve emotional pressure. This approach allows traders to hold positions longer and capture more from the move without giving in to fear or greed.
For beginners, it works like a navigator: simplifying chart reading and showing where it’s safer to take profit and where holding makes sense. The market will always be unpredictable, but when the process is structured, trading stops being a chaotic gamble and turns into a system where discipline makes the difference.

TON: The Decline Continues The decline of TON has lasted for more than 10 days, and the market overheating indicator clearly shows that the trend remains bearish. On August 25, a short setup was identified on the 4-hour chart around $3,202. The move was brief, lasting only two days, but price reached $3,113, passing through two profit-taking levels and giving a difference of nearly $90 per coin. The trade was completed according to plan, and the result was secured.
What’s more interesting is that additional analysis confirmed the overall direction remains bearish. This means long positions are better avoided for now, as they carry a high risk of loss. It’s important not only to identify entry points but also to skip trades that statistically lack an advantage.
For intermediate traders, this approach works as an accelerator. Instead of endless doubts, there are clear levels and an understanding of where to act and where to wait. Algorithmic discipline pushes emotions into the background, making the trading process structured and transparent.
The market may continue to decline, but systematic management allows traders to extract value even during difficult phases and avoid hasty decisions.

“WLFI/USDT Bullish Pennant Breakout – Targeting $0.2035”“WLFI/USDT Bullish Pennant Breakout – Targeting $0.2035”
✅ Entry Point (Long):
Entry: Around $0.1960 – $0.1980 (break above pennant resistance).
Reason: Price is consolidating in a bullish pennant after an upward move → likely continuation pattern.
🛡 Stop-Loss:
Stop: $0.1925
Reason: Below the pennant support and previous consolidation zone. If it breaks down, momentum is lost.
🎯 Target Zones:
TP1: $0.1987 (immediate resistance).
TP2: $0.2035 (main target shown on chart, top of green box).
Risk/Reward: ~1:2 → favorable.
📝 Summary:
WLFI is forming a bullish continuation pennant. Break above $0.196–0.198 confirms momentum. First target $0.1987, final target $0.2035. Keep stop tight at $0.1925. Strong setup if volume confirms breakout.

“NMR/USDT Long Breakout Trade – Targeting $19.13”✅ Entry Point (Long):
Entry: Around $16.50–16.70 (break and hold above yellow resistance zone).
Reason: Clean breakout with strong bullish volume + trendline support.
🛡 Stop-Loss:
Stop: $15.42 (below support & trendline).
Reason: If price falls back here, breakout fails = exit fast.
🎯 Target Zones:
TP1: $17.70 (first resistance, partial profit).
TP2: $19.13 (major target zone shown on chart).
Risk/Reward: ~1:2 (good setup).
📝 Summary:
NMR is in strong momentum (+30% daily). Entry above $16.50 with volume spike confirms continuation. First target $17.70, final target $19.13. Keep stop at $15.42 to protect downside.

EURUSDLooking for bullish momentum from the EURO on the behalf of dollar's weakness. Expecting buyside liquidity to be wiped out to the external side of the range.we have clear bullish structure being created while taking in sellers looking to short the corrections before being caught in the upside move. Will monitor closely as we close the week

TRADE OF THE WEEKEND! TRADE ME 🚨 In today’s video, I share my market outlook 📊 and highlight the importance of patience ⏳ when it comes to:
✔️ Planning your trades 📝
✔️ Executing with discipline 🎯
✔️ Weighing up cost–benefit before entry ⚖️
💡 Remember: Risk isn’t just about potential loss ❌ — it also signals which trades are worth entering ✅ and which to skip 🚪.
⚠️ Just because the market feels slow doesn’t mean we crank up the risk 🎲 and gamble away hard-earned gains 💵.
Right now, I’m watching 👀 the lower-high continuation play, but I’m also mindful of the recent selling pressure 📉 that could still play out.
🔑 I won’t be entering trades until I see clear market structure confirmation 🏗️.
"SOL: Drop from $201 ""
On August 30, Solana turned downward on the 4-hour chart around the $201 area. The move was precise and steady: price reached $197, giving a potential difference of about $5 per coin. The trade was closed according to plan, and the result was secured.
The real value here isn’t just in the profit, but in the process. The algorithm guided the trade step by step: marking profit-taking zones, helping to manage risk, and maintaining discipline. This removes chaotic decisions and turns trading into a structured process.
For experienced traders, such a tool works as an accelerator: it reduces routine analysis, speeds up decision-making, and eliminates emotional mistakes. Instead of constant doubts about where to take profit or whether to keep holding, the focus shifts to following rules and working within a clear system.
The market will always move unpredictably. But when there’s an algorithm highlighting structure and managing trades in stages, trading stops being chaos and becomes disciplined work."

ETH: Clear Move DownOn September 1, the Ethereum market turned downward on the 1-hour timeframe around the $4,444 zone. The move was sharp: price broke through several key levels and reached $4,261, giving a maximum difference of about $183 per coin. By the time the trade was closed, the third target had been reached, and the result was fully realized.
The essence lies not only in profit, but in how the trade was managed. The algorithm step by step highlighted profit-taking zones, enabled a shift to breakeven, and protected capital from emotional mistakes. This transformed trading such a volatile asset into a structured process where every step was clear in advance.
The market will always throw challenges. But when management is built on an algorithmic approach, trading stops being a guessing game and becomes a systematic strategy."

ETH: Drop from $4600"
On August 25, Ethereum turned downward from the $4,600 area on the 4-hour chart. Price confidently broke through several key levels and, by the time the third target was reached, touched $4,272. The maximum difference amounted to roughly $340 per coin — a move that highlighted both the strength of the trend and the importance of managing a trade step by step.
The key here isn’t just the result, but the discipline behind it. The algorithm marked profit-taking levels and guided the position, removing emotions from the process. This made it possible to follow the market’s flow instead of guessing at its chaotic swings.
For beginners, this approach is a shortcut that saves years of trial and error while learning basic patterns. For intermediate traders, it’s a tool that accelerates decision-making and minimizes mistakes. For professionals, it’s about saving time and maintaining discipline. For investors, it’s a clear way to monitor entry and exit points without being overloaded with noise.
The market will always test nerves. But when the process is guided systematically, trading shifts from emotional struggle to a structured, disciplined approach."

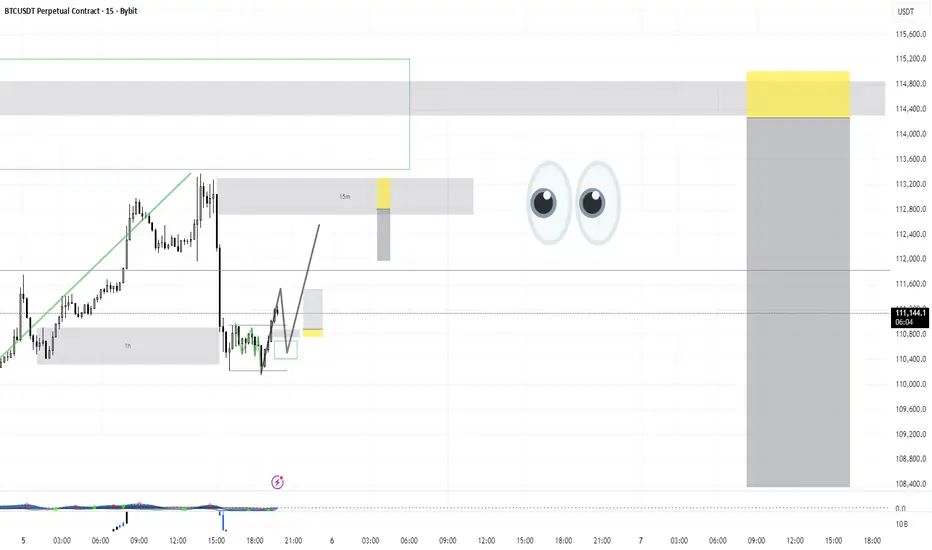
BTC: Growth from $108.8K"On August 31, Bitcoin shifted sharply into an upward trend. On the 1-hour timeframe, the entry zone was highlighted around $108,800. Just a few days later, price reached $112,000, passing through three target levels and locking in a substantial part of the move. The maximum difference amounted to roughly $3,200.
The key element here is trade management. The algorithm signaled the shift to breakeven early on, protecting capital even in case of volatility. This removed emotional pressure and gave confidence that the position was being handled according to plan rather than driven by fear or greed.
Such a sequence — entry, structured management, staged profit-taking — turns a chaotic market into a controlled process. For beginners, it’s a way to save years on learning basic patterns. For intermediate traders, it accelerates decision-making and reduces unnecessary mistakes. For professionals, it’s a tool for time efficiency and discipline. And for investors, it provides a clear visual layer for tracking key levels without being distracted by market noise.
The position remains active today, and the structure of the trend still shows strength. But the most important takeaway isn’t just the move from $108.8K to $112K — it’s the method of managing it. The market will always test traders emotionally, and having an algorithm that defines levels and adapts step by step makes the difference between guessing and trading with precision."

Cocaine Saylor is coming for you! The man the myth the legendary cocaine snake oil saylor is BACK once again to take you out to the CLEANERS!! The infamous dot com bandit is going to snatch your 401k like an old grannys pocket book! BEWARE!!!

WEEKLY LOOK AT GOLD FUTURES Chart speaks for its self - I know JP Morgan has a price target of $3675 by Q4 2025 and over $4000 by Q2 2026.
This is weekly chart and we're making a new high that very divergent.
So regardless what the investment bank that has paid billions in commodity fraud - I remain sceptical.
Nice trend line that we would be nice to revisit. Love to get long but this needs correction for me personally - its been a good run without a doubt.
So somewhere between 3150 and 3200 - Why could this happen? Because everyone and their dog is long. When everyone is in the same side of the boat? Every time.
The white line is the 200 Week MA.

America Has Great Jeans - AEO
Here is a good example here of how powerful option contracts can be. When the news broke out regarding the earnings call from American eagle, it was up 25-26% overnight. However due to the nature of leverage, the options call gained over 500% and is still going. When utilized correctly, your max risk can be minimized while maximizing the upside.
Stay safe,
Uni

104k ? I feel Bitcoin is about to touch the $104,000 level to gain strength there and continue its upward move. This will likely cause other coins to dip a bit more, find a stronger floor for accumulation, and then follow the upward trend.

Bitcoin to $500K by 2028–2030Institutional Adoption, Scarcity, and the Devaluation of the Dollar
The question of whether Bitcoin could reach the half‑million mark within the next five to seven years is increasingly debated among investors, economists, and institutions alike. While such projections still carry uncertainty, several converging trends suggest that a $500,000 valuation for Bitcoin by 2028–2030 is within the realm of possibility. These drivers include the rapid pace of institutional adoption, Bitcoin’s fixed supply, its growing narrative as a store of value, the potential role of national reserves, and a macroeconomic backdrop defined by inflation and dollar devaluation. Additionally, the long‑term holding behavior of Bitcoin investors has reduced circulating supply, further amplifying the scarcity effect.
1. Institutional Adoption via ETFs and Beyond
The approval and growth of Bitcoin exchange-traded funds (ETFs) in major financial markets mark a watershed moment in the asset’s mainstream acceptance. These vehicles simplify access for institutional investors that were previously constrained by custody and regulatory hurdles. Pension funds, endowments, and sovereign wealth funds are now able to allocate to Bitcoin through regulated channels.
As demand from professional investors grows, the inflows through ETFs act as a continual buy‑side force. Unlike speculative retail buying sprees of previous cycles, institutional allocations are more structured and long‑term oriented, potentially anchoring a more stable demand floor. This steady absorption of supply is expected to become one of the strongest catalysts for Bitcoin price growth this decade.
2. Fixed Supply: The Scarcity Engine
Bitcoin’s most unique feature is its hard‑coded supply cap: only 21 million coins will ever exist . This mathematical certainty contrasts starkly with fiat currencies, where central banks can expand money supply indefinitely. Halving events, which reduce the block rewards of mining BTC roughly every four years, further accelerate scarcity.
By 2030 , the annual mining of Bitcoin will be minuscule compared to today, limiting fresh supply even as institutional demand scales up. In classical economic terms, a growing demand against a fixed or declining supply can only result in upward price pressure.
3. Store of Value in an Inflationary World
The past decade has demonstrated how inflation and monetary expansion distort asset markets. As governments print more money to finance debt and expenditures, investors increasingly seek hedges against the erosion of purchasing power. Historically, gold has played this role.
Bitcoin, with its transportability, divisibility, verifiability, and digital-native characteristics, is now increasingly seen as a modern alternative or complement to gold. If Bitcoin even partially captures the $13+ trillion gold market as a store of value, valuations well above $500,000 per coin become mathematically plausible.
4. Bitcoin as a Component of National Reserves
While still early, several nations are exploring or experimenting with holding Bitcoin in their reserves. For countries facing dollar dependency or geopolitical pressures, Bitcoin provides a neutral, censorship‑resistant reserve asset that reduces reliance on the U.S. financial system.
Should more governments follow El Salvador’s lead or allocate even a small percentage of their foreign reserves to Bitcoin, global reserve demand could represent a massive new buyer base. Even marginal allocations at a sovereign level would create outsized effects due to Bitcoin’s relatively small market capitalization compared to global reserves.
5. The Dollar, Inflation, and Asset Price Revaluation
The U.S. dollar, while still dominant, faces structural challenges: ballooning government debt, persistent fiscal deficits, and the need for monetary expansion to sustain growth. Increased money supply historically leads to currency debasement. As purchasing power erodes, asset prices, from equities to real estate to scarce stores of value like Bitcoin, tend to reprice higher in nominal dollar terms.
Thus, Bitcoin’s potential ascent to $500,000 is not solely about Bitcoin “going up,” but also about the dollar “going down.” In this sense, the milestone is as much a reflection of fiat devaluation as it is of Bitcoin adoption.
6. The Supply Dynamics: 80% Already Parked
On‑chain analytics highlight another critical factor: roughly 80% of Bitcoin supply is currently held by long‑term investors in “dormant” wallets, seldom moved or sold. This indicates that a large portion of the supply is illiquid, effectively taken off the market.
When institutions, retail newcomers, or governments try to acquire Bitcoin in size, they will be competing over the thin slice of supply available for trade. This dynamic creates a potential supply squeeze, which historically has been one of the key drivers of Bitcoin’s parabolic price advances.
Conclusion: A Plausible Milestone, But With Volatility Along the Way
Projecting Bitcoin to $500,000 by 2028–2030 is not simply speculation, it is a thesis grounded in identifiable trends: institutional adoption through ETFs, a mathematically capped supply, Bitcoin’s emerging status as digital gold, the potential for sovereign reserve adoption, and macroeconomic tailwinds fueled by dollar debasement.
However, it is important to note that Bitcoin’s journey will not be linear. Volatility, regulatory battles, and shifts in global macro conditions will shape the trajectory. Yet, the combination of structural scarcity and rising global demand makes the possibility of half‑a‑million per coin a credible long‑term scenario.
#crypto #bitcoin #finance #defi #economy #portfolio #digital #blockchain #trading #asset

BTC: Growth from $108.8K"On August 31, Bitcoin shifted sharply into an upward trend. On the 1-hour timeframe, the entry zone was highlighted around $108,800. Just a few days later, price reached $112,000, passing through three target levels and locking in a substantial part of the move. The maximum difference amounted to roughly $3,200.
The key element here is trade management. The algorithm signaled the shift to breakeven early on, protecting capital even in case of volatility. This removed emotional pressure and gave confidence that the position was being handled according to plan rather than driven by fear or greed.
Such a sequence — entry, structured management, staged profit-taking — turns a chaotic market into a controlled process. For beginners, it’s a way to save years on learning basic patterns. For intermediate traders, it accelerates decision-making and reduces unnecessary mistakes. For professionals, it’s a tool for time efficiency and discipline. And for investors, it provides a clear visual layer for tracking key levels without being distracted by market noise.
The position remains active today, and the structure of the trend still shows strength. But the most important takeaway isn’t just the move from $108.8K to $112K — it’s the method of managing it. The market will always test traders emotionally, and having an algorithm that defines levels and adapts step by step makes the difference between guessing and trading with precision."

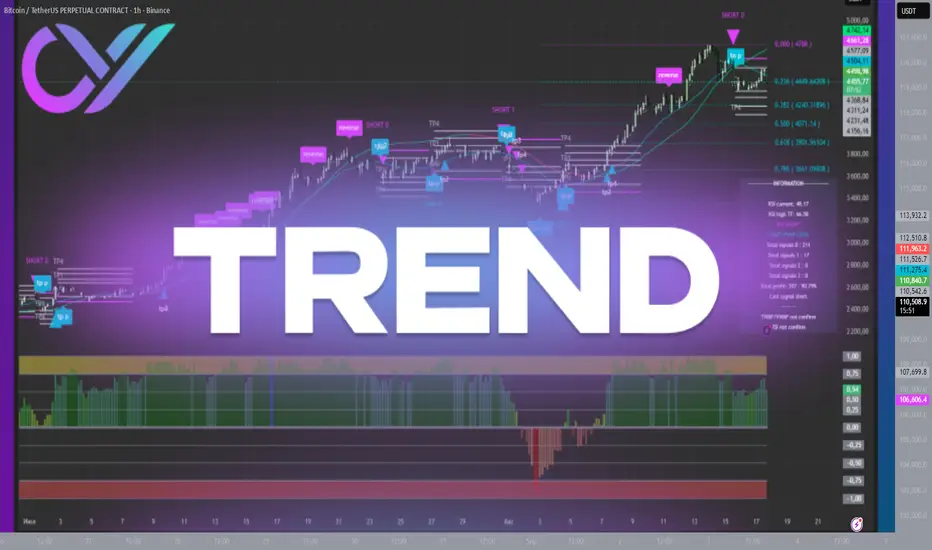
What Is a Trend and How Not to Confuse It With a Correction"One of the first words every trader hears when entering the market is “trend.” It seems simple: a trend is the direction of price movement. But in practice, this is where most mistakes and debates arise. Where is the actual trend, and where is just a correction? What is a reversal, and what is only a pause? Misunderstanding these questions costs money — sometimes an entire account.
Why Is It So Hard to See the Trend?
The challenge lies in the fact that markets always move in waves. Even during a strong uptrend, price will pause, pull back, and create local highs and lows. For a trader, especially a beginner, it’s easy to mistake a correction for a reversal. This often leads to closing trades too early, or holding them too long when it no longer makes sense. Imagine Bitcoin rises from $100,000 to $118,000. Suddenly, price drops to $114,000. Is this the start of a downtrend, or just a pullback before the next push higher? The answer doesn’t lie in emotions but in reading the structure of the trend.
How to Distinguish Trend From Correction
A trend is a sequence of moves where each new impulse confirms the previous one.
- In an uptrend, each new high is higher than the last, and each low also moves higher.
- In a downtrend, each new low drops below the last, and highs remain capped.
A correction, however, is a temporary pullback against the main direction. It doesn’t break the structure. If price in an uptrend pulls back but holds above key support, it’s a correction, not a reversal. Levels and volumes often provide the confirmation. When price tests and holds strong support, the trend stays intact. But if it breaks and consolidates beyond that level, it’s a signal that the market may be reversing.
The Role of Psychology in Mistakes
Most of the time, the problem isn’t theory — it’s psychology. Traders see “collapse” where there is only a normal correction. Or they hope for continuation when the structure is already broken. Greed stops them from taking profit when they should, while fear forces them to close trades at every pullback. Trading then becomes a set of random emotional decisions instead of a structured plan.
What Really Helps
1. Technical analysis. Trendlines, support/resistance, and patterns provide a framework.
2. Multi-timeframe analysis. On lower charts, a correction may look like a full reversal. On higher timeframes, it’s just a pause. You need both perspectives.
3. Algorithmic approach. Automation removes unnecessary emotions. When a system highlights zones, profit levels, and trend shifts, traders can stick to their plan.
4. Staged profit-taking. Even if the market reverses unexpectedly, part of the profit is already secured.
Why This Matters to Every Trader
For beginners, trends and corrections often look identical. Visualization and structure act as a navigator, showing what’s just a pullback and what requires caution — saving years of trial and error.
For intermediate traders, the value is in acceleration. They already know how to read charts but often hesitate in execution. A structured system reduces emotional mistakes and provides clear reference points.
For professionals, the priority is time and discipline. They don’t need definitions of trends — they need a tool that filters out noise, keeps trades consistent, and maximizes holding potential.
For investors, understanding trend vs. correction provides clarity on where to accumulate and where to reduce exposure. It’s not a guessing game but a framework for managing capital.
Final Note
Trend and correction aren’t just textbook terms — they are the foundation of trading. Those who can tell them apart manage trades, instead of being managed by market chaos.
The market will always try to knock you off balance emotionally. But a systematic approach based on technical analysis highlights structure, pinpoints key levels, and removes guesswork. That’s what transforms trading from a lottery into a structured process, where emotions fade and decisions come from cold logic."
BTC: Discipline Over Chaos"At the end of August, BTC delivered a rare scenario: entry at $108,800, smooth progression through three levels, and profit locked at $112,000. But the real strength isn’t just the $3,200 move — it’s in how the trade was managed.
The position developed step by step: support zones were recalibrated, partial profits were taken along the way, and the breakeven shift early on removed the risk of a complete reversal. For professional traders, this process is more valuable than the outcome itself, as it reflects control over the market rather than submission to its chaotic swings.
When everything follows a structured approach, the market stops being chaos. Trading shifts from “getting lucky” to executing a built system, where consistency matters more than any single result."

BTC: Confident Trade Management"On August 31, BTC on the 1-hour chart showed an entry zone around $108,800. Almost immediately, the algorithm highlighted the shift to breakeven, removing the risk of a full reversal and giving peace of mind for the rest of the move.
Since then, the position has remained active and has already passed three profit targets. Today, price is around $112,000, and the fact that the trade has been held this long demonstrates how discipline and structured management allow traders to capture the bulk of a trend without rushing or guessing.
For intermediate traders, the real value lies in the process. When the system predefines zones for profit-taking and adjustments, emotions fade into the background. Trading stops being a fight with fear and greed and becomes a structured path where each step is justified."

BTC: +$3,200 in Motion"Since late August, Bitcoin has bounced from $108,800 and already reached $112,000. That’s a difference of more than $3,200 per coin. For those just starting out, this is a clear example of how even a local move on the 1-hour chart can bring tangible results.
It’s not only about the number, but also the path: the move went through three target levels. This means traders could take profits gradually, without risking everything at once. For investors, this approach provides a structured way to manage entries and exits. For beginners, it’s a lesson in discipline made visible.
The market will always fluctuate, but proper trade management and staged profit-taking transform emotions into numbers. What matters here is not just BTC’s rise but the structure of the trade itself, showing how smaller trends can be harnessed effectively."

Dow Jones (DJI) – 1H Technical OutlookDow Jones (DJI) – 1H Technical Outlook
Bias: Bearish while below 45,450.
Key Resistance: 45,350 – 45,450 (failure to break above keeps sellers in control).
Immediate Supports:
45,100
44,980 – 44,860
Major support at 44,700
📉 Primary Scenario:
If price remains capped below 45,450, a downward move towards 44,700 is likely after a minor corrective bounce.
📈 Alternative Scenario:
A breakout and sustained close above 45,500 would invalidate the bearish view and open the door for a rally towards 45,800 – 46,000.
