Contains IO script

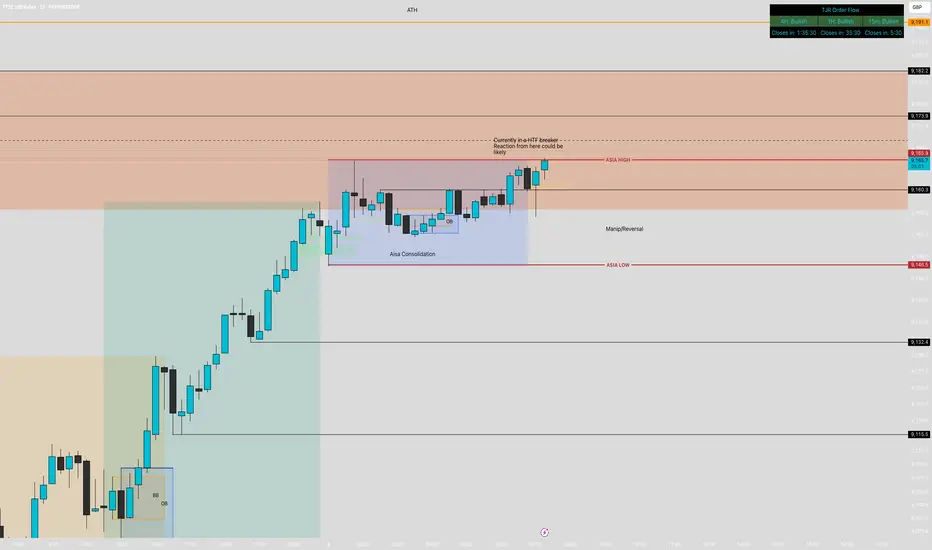
UK100 potential bearishCurrently in a HTF breaker and Order block.
Asia has consolidated for the whole session but seems to be sweeping the liquidity to the upside.
Waiting on a sweep to the upside with a break of structure to the down side. Plenty of liquidity to the downside to collect before we could see new ATH formed.
180 Pips Secured on GOLD! | Sniper Strategy in Action📈 Tired of Gold Trades Going Against You? This Sniper Strategy Just Bagged +180 Pips!
Hello Traders,
Struggling with XAUUSD’s volatility?
Taking small wins but suffering big losses?
You’re not alone — and we’ve built something just for you.
🔥 Introducing GOLD SNIPER — a high-probability strategy engineered for serious Gold traders.
With a consistent 1:2 risk-reward and precision entry logic, it’s designed to help you ride big moves and avoid common traps in XAUUSD.
🚀 Today’s Live Trade Recap:
Signal 1
🟢 Buy @ 3355.91
🔴 SL @ 3349.91
🟢 TP @ 3367.91
✅ Result: +120 Pips
Signal 2
🟢 Buy @ 3368.32
🔴 SL @ 3362.32
🟢 TP @ 3380.32
❌ Result: -60 Pips
Signal 3
🟢 Buy @ 3373.29
🔴 SL @ 3367.29
🟢 TP @ 3385.29
✅ Result: +120 Pips
📊 Total Profit Today: +180 Pips
✅ What Makes Gold Sniper So Effective?
✔️ Catches real momentum, not noise
✔️ Keeps entries & exits disciplined and mechanical
✔️ Aims for high-reward trades, not scalp scraps
🎯 Want better entries and more consistent wins on XAUUSD?
📩 DM us now to get instant access and start using Gold Sniper on your TradingView chart.
If this helped you, like the idea and drop a comment — let’s grow together!
Happy Trading,
InvestPro India

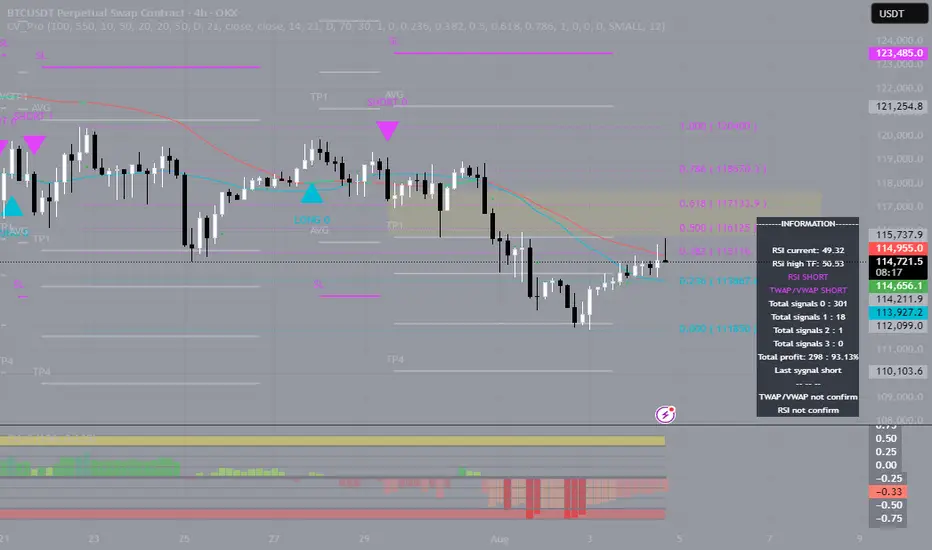
Bitcoin Turned Down — It Was Only a Matter of TimeBitcoin Turned Down — It Was Only a Matter of Time
When the price gets stuck at the top and can’t move higher, it’s always a reason to stop and think. BTC got stuck around $118,000, started to form long upper wicks, and the volume started to decline. All of this pointed to a classic case of fading bullish momentum.
At this point, my indicator gave several key signals: weakening buying power, a change in momentum, and the formation of a potential reversal zone. I refrained from opening long positions — and this decision turned out to be the right one. The price went down and is now trading around $114,000.
Next, I will wait for a retest of the imbalance zone and work from the reaction from this zone.
It is important to understand: this correction is not something unusual. This is a technically sound phase after a strong rally. The market gets rid of speculative positions, gets rid of excessive leverage and prepares for either a reset or a deeper correction.
The market has weakened predictably, and that's actually a good thing. When the structure becomes clear, we can trade with a plan rather than just following our gut instinct.
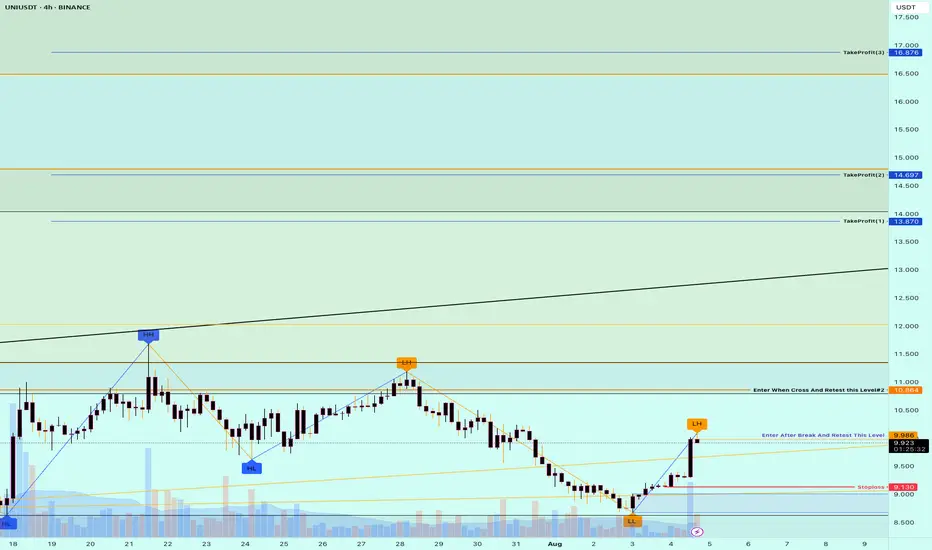
Buy Trade Strategy for UNI: Backing the Leading DeFi DEX UniswapDescription:
This trading idea is centered on UNI, the governance token of Uniswap, the largest decentralized exchange (DEX) on Ethereum. UNI holders play a crucial role in the protocol’s development, and the token benefits directly from Uniswap’s expanding user base, trading volume, and influence in the DeFi space. As decentralized finance continues to evolve, Uniswap remains a foundational pillar for trustless asset swaps, and UNI serves as a strategic asset for exposure to this ecosystem. The platform's commitment to innovation, including cross-chain expansion and layer-2 integrations, further strengthens UNI’s long-term fundamentals.
That said, the crypto market is highly volatile, and **UNI**'s performance is subject to sudden changes due to regulatory shifts, Ethereum network updates, or competitive developments in the DeFi sector. Investors should remain aware of these dynamics and manage their positions responsibly.
Disclaimer:
This trading idea is for educational purposes only and should not be considered financial advice. Cryptocurrencies like UNI carry substantial risk, including the possibility of total capital loss. Always conduct your own research, evaluate your risk tolerance, and consult a qualified financial advisor before making investment decisions. Past performance is not a guarantee of future results.
Potential 8.6% gain in RAREUSDPotential 8.6% gain in RAREUSD pair for the following reasons:
Longer-term Chart (150min)
-As seen in the longer time frame (150min), we can see that the price of RARE is overextended to the downside (Using custom Data Distribution with Extreme Clusters indicator showing yellow dots and highlighted background)
-Custom indicator below (Zero-Lag USI) has changed background from red to black, meaning that there is a potential reversal in momentum coming.
-Technically, we can see that there is a slowdown in slope of the move, and the bars here are getting smaller with the tails at the bottom, showing strength to the upside.
Shorter-term Chart (30min)
-Custom Data Distribution with Extreme Clusters script is also showing oversold levels in agreement with the 150min chart, showing confluence.
-Custom Zero-Lag USI script is showing a green background (shown here by the green arrow), which means that the strength is already potentially shifting here. We hope that this potential change in momentum will eventually shift/spill over to a larger time frame. Thus, the USI on longer time frame should eventually also change from the black background to the green background, showing a gain in strength and potential reversal to the upside on the 150min chart.

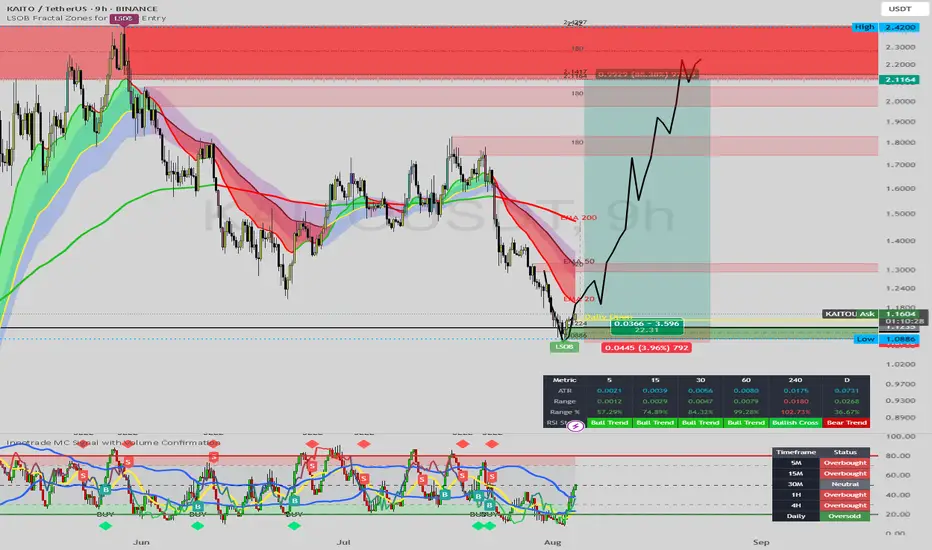
KAITO/USDT: High-Reward Long Setup from BIG BANG THEORYFirstly, our Algo-based indicators are used to create this analysis. Follow me so you don't miss, Boost and leave your comments if you profited with our posts, so we may continue:
This 9-hour chart for KAITO/USDT highlights a compelling long trade setup originating from a critical support level, suggesting the potential for a significant rally.
Key Support Bounce: The price has found strong support and reversed from a key "LSOB" (Liquidity Sweep Order Block) zone, with the low established at $1.0886. This type of level often marks significant turning points where liquidity is hunted before a move in the opposite direction.
Indicator Confirmation: The custom indicator at the bottom of the chart strongly supports a bullish reversal. It shows the price moving sharply out of the deep oversold "BUY" zone. Furthermore, the "Daily" timeframe status is marked as "Oversold," adding significant weight to the potential for a strong bounce or trend reversal.
Entry: Around the current price levels (~$1.16).
Stop Loss: Tightly placed just below the recent low at approximately $1.0886.
Take Profit: The primary target is set at $2.1164, which aligns with a major resistance zone.
Risk/Reward: This setup presents an exceptional risk-to-reward ratio of approximately 22:1, with a potential gain of over 88%.
Strategy:
The illustrated black line projects a strong rally from the current accumulation zone. The move is expected to break through intermediate resistance levels around $1.30 and $1.80 before pushing towards the final target.
Conclusion:
The confluence of a bounce from a major liquidity zone, strong confirmation from oversold indicators, and a well-defined trade setup with a massive risk-to-reward ratio makes this a very compelling bullish scenario for KAITO/USDT.
Disclaimer: This analysis is for educational purposes only and should not be considered financial advice. Always conduct your own research and manage risk appropriately.
"BTC Moves Down — Scenario Confirmed"As expected, the market couldn’t sustain the overheating.
Over the past few days, Bitcoin has shown clear signs of weakness. The rally from $105K to $118K happened too quickly, without proper correction, and with noticeably declining volume toward the end of the move. In such situations, the market often loses footing — and that’s exactly what we’re seeing now: BTC has corrected down to $114,000.
If you've been following my analysis, you know I pointed out signs of overheating earlier: strong deviation from moving averages, weak reaction at key resistance levels, and upward wicks without volume confirmation. My indicator gave an early warning of trend weakening around the $117–$118K zone. That’s when it became clear momentum was fading.
This isn’t a crash or panic — it’s a normal, healthy market correction. Overleveraged long positions are getting flushed out, and late entries at the top are being shaken off. In such phases, it’s crucial not to react emotionally but to follow a clear system.
The key point: markets don’t reverse “suddenly.”
Everything happening now was visible in advance — if you were looking not just at price, but at the structure of the movement.

SYNUSDT: Breaking Long-Term Downtrend, Poised for a Major Rally?Firstly, our Algo-based indicators are used to create this analysis. Follow me so you don't miss, Boost and leave your comments if you profited with our posts, so we may continue:
This daily chart for SYNUSDT showcases a significant technical development as the price appears to be breaking out of a multi-month descending channel, signaling a potential major trend reversal.
Analysis:
Descending Channel Breakout: The price has been confined within a clear descending channel for most of the year. The recent price action shows a decisive push above the upper boundary of this channel. It is currently consolidating right above this broken trendline, which is a classic "breakout-and-retest" pattern.
Key Support: The current price is finding support at the 23.6% Fibonacci retracement level (around $0.1212). A successful hold above this level would reinforce the bullish breakout.
Momentum Indicator: The Innotrade MC Signal at the bottom provides strong confluence. The indicator is sharply rising from the oversold "BUY" zone in a pattern labeled "V-Band Rising," which suggests a powerful burst of bullish momentum from a bottom.
Price Projection and Targets: The illustrated price path anticipates a strong upward move following this retest phase.
The first major area of resistance to watch is the zone between the 61.8% Fib level (0.2147)
𝑎
𝑛
𝑑
𝑡
ℎ
𝑒
78.6, (0.2147). This area also contains a previous order block (LSOB) and the EMA 200.
Target 1: is explicitly marked at $0.2777.
Higher targets based on Fibonacci extensions are noted at $0.5709 and above for the longer term.
Strategy:
Position : Long (Buy)
Entry: The current price level, retesting the broken channel trendline (around $0.12 - $0.14), presents a strategic entry point.
Targets: The initial primary target is $0.2777, with further long-term potential if bullish momentum is sustained.
Conclusion:
The combination of a breakout from a long-term bearish structure, a successful retest of support, and powerful momentum indicators suggests that SYNUSDT could be at the beginning of a new, significant uptrend. The current price offers a favorable risk-to-reward entry for a move towards the identified targets.
Disclaimer: This analysis is for educational purposes only and should not be considered financial advice. Always conduct your own research and manage risk appropriately.

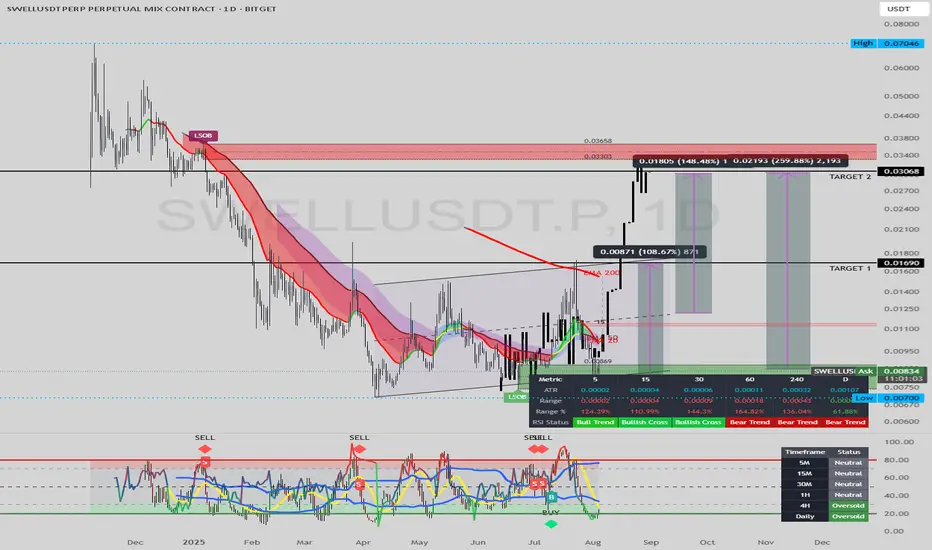
SWELLUSDT: Bullish Reversal in Play, Targeting Higher LevelsFirstly, our Algo-based indicators are used to create this analysis. Follow me so you don't miss, Boost and leave your comments if you profited with our posts, so we may continue:
This daily chart for SWELLUSDT suggests that a bottoming formation has completed, and a new bullish trend is emerging, with significant upside potential.
Analysis:
Market Structure Shift: A key "Bearish Choch" (Change of Character) is indicated on the chart, signaling that the previous downtrend has likely reversed. Since hitting the low at $0.00700, the price has been establishing a series of higher lows, which is a foundational element of a new uptrend.
Accumulation and Support: The price has been consolidating in an ascending channel, finding consistent support along the lower trendline and the EMA 20. This indicates a period of accumulation by buyers.
Indicator Confluence:
The middle indicator (a variant of RSI) is also trending upwards within its own channel, recently bouncing off its support line. This mirrors and confirms the price action.
The bottom Innotrade MC Signal indicator has flashed a "B" (Buy) signal from the oversold territory and is projected to move higher, suggesting building bullish momentum.
Price Projection and Targets: The drawn black line illustrates a potential path for the price. It anticipates a rally from the current support level. The key objectives are:
TARGET 1 : $0.01690. This level represents a significant structural resistance and a break of the previous high.
TARGET 2: $0.03068. This target aligns with a major "FVG" (Fair Value Gap) or price inefficiency, which often acts as a magnet for price.
Strategy:
Position: Long (Buy)
Entry: The current support zone around $0.0080 - $0.0085 is presented as a strategic entry area.
Targets: The primary targets for this bullish move are
0.01690
0.03068.
Conclusion:
With a confirmed market structure shift, strong support from multiple indicators, and clear upside targets, SWELLUSDT presents a compelling bullish setup. The current price level offers an opportunity to enter a potential new uptrend with significant room for growth.
Disclaimer: This analysis is for educational purposes only and should not be considered financial advice. Always conduct your own research and manage risk appropriately.
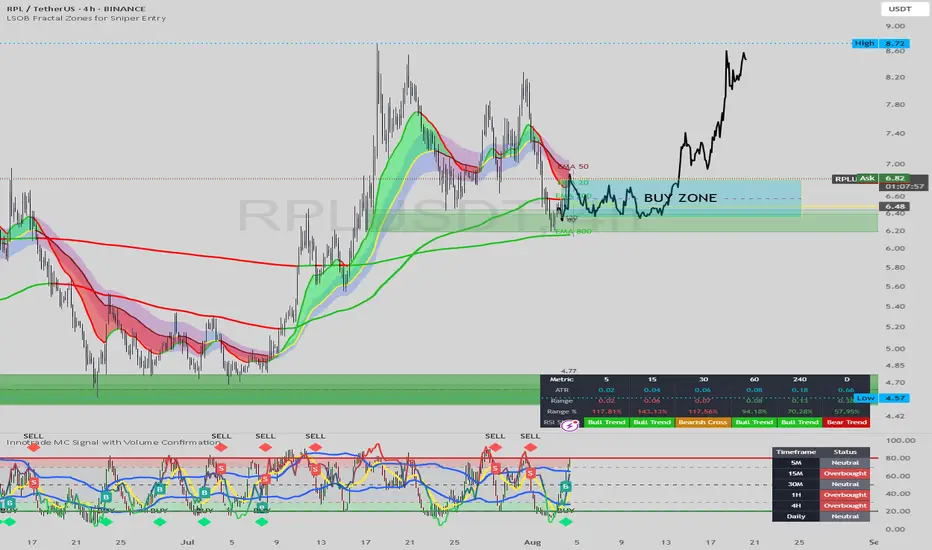
RPL/USDT Enters Prime Buy Zone: Accumulation Before Next Leg Up?Firstly, our Algo-based indicators are used to create this analysis. Please Follow, Boost and leave your comments if you profited with our posts, so we may continue:
This 4-hour chart for RPL/USDT highlights a key support area that could serve as a launchpad for the next bullish impulse.
Analysis:
Corrective Pullback: After a strong rally that peaked near $8.72, the price has entered a corrective phase, pulling back to a significant area of interest.
The "BUY ZONE": A critical support zone has been identified between $6.48 and $6.80. This area represents a confluence of technical support:
Horizontal Structure: It aligns with a previous support/resistance level, where price has reacted multiple times.
Moving Averages: The price is currently testing the EMA 200 and is hovering just above the longer-term EMA 800, both of which often act as dynamic support during uptrends.
Indicator Confirmation: The custom indicator at the bottom of the chart shows the price has dipped into the oversold "BUY" territory, and a fresh "B" (Buy) signal has just appeared. This suggests that selling pressure is exhausting and buyers are beginning to step in.
Price Projection: The drawn black line illustrates a potential scenario where the price consolidates and accumulates within the "BUY ZONE." This period of sideways action would build a base before a strong continuation of the primary uptrend, targeting a retest and potential break of the recent high at $8.72.
Strategy:
Idea: Look for buying opportunities within the defined support zone.
Entry: The area between $6.48 and $6.80 is the designated "BUY ZONE." Traders might look for signs of consolidation or bullish price action within this range to initiate long positions.
Target: The initial target would be the recent high of $8.72.
Conclusion:
The current price action presents a classic dip-buying opportunity. The confluence of structural support, key moving averages, and a bullish indicator signal in the "BUY ZONE" suggests a high probability of a bullish reversal. Accumulation in this zone could fuel the next significant move upwards for RPL.
Disclaimer: This analysis is for educational purposes only and should not be considered financial advice. Always conduct your own research and manage risk appropriately.
CVX/USDT: Long-Term Breakout Signals Massive Upside PotentialFirstly, our Algo-based indicators are used to create this analysis: DON'T MISS US. FOLLOW US, COMMENT AND BOOST.
This weekly chart for CVX/USDT reveals a major bullish breakout from a long-term pattern, suggesting that the asset may be in the early stages of a significant new uptrend.
Analysis:
Descending Channel Breakout: For over two years, CVX has been trading within a clear descending channel. Recently, the price has decisively broken out of this channel to the upside, signaling a major shift from a bearish to a bullish market structure.
Pullback and Reentry: Following the initial powerful breakout, the price executed a healthy pullback. It found support right around the key 50% Fibonacci retracement level (approximately $4.262). The chart notes this area as a potential "REENTRY" point, especially with the formation of a "W-Pattern" (double bottom) on a smaller timeframe, which is a classic bullish reversal signal.
Confirmation Indicators:
The Innotrade MC Signal indicator at the bottom shows multiple "BUY" signals in the recent accumulation zone and the indicator line is now trending upwards, suggesting building momentum.
The RSI status confirms a "Bull Trend" on the daily and weekly timeframes, supporting a long-term bullish outlook.
Price Targets: Based on Fibonacci extension levels from the recent major swing, several targets are identified:
TP 1: $12.243 (aligns with the 127.20% extension and a previous key resistance level).
TP 2: $19.726 (aligns with the 161.80% extension).
Long-Term Projection: The aggressive black line projects a potential move towards the 2022 highs, indicating massive long-term potential if the bullish momentum continues.
Strategy:
Position: Long (Buy)
Entry: The current price level around $4.30 - $5.00 is highlighted as a strategic reentry zone following the successful pullback.
Targets: The primary targets are
12.243
∗
∗
a
n
d
∗
∗
12.243∗∗and∗∗
19.726.
Conclusion:
The breakout from a multi-year descending channel, combined with a successful retest of key support and confirming indicator signals, presents a compelling long-term bullish case for CVX. The current price level offers a strategic entry for a potential multi-hundred percent move towards the identified price targets.
Disclaimer: This analysis is for educational purposes only and should not be considered financial advice. Always conduct your own research and manage risk appropriately.


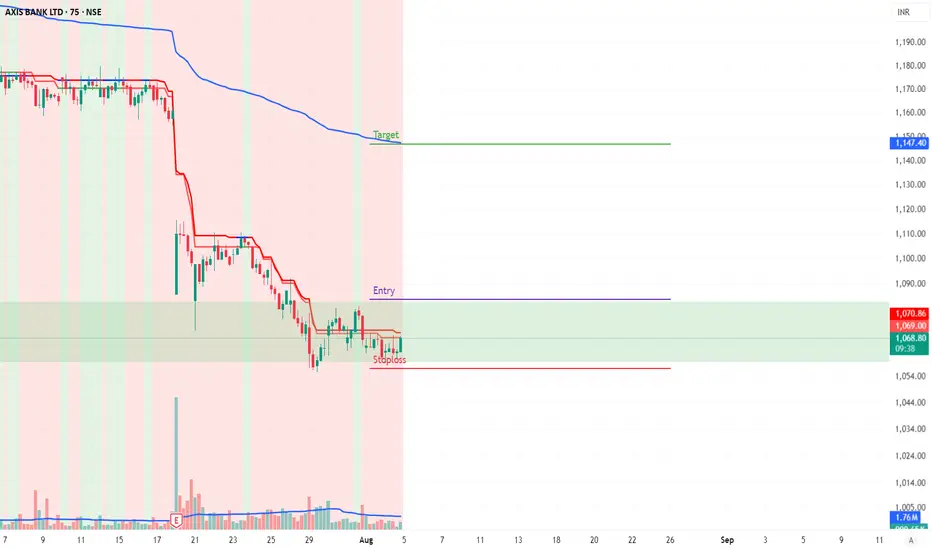
Strong Demand zoneHere is very strong probability to find a long position for midterm duration. There is price action clearly says consolidation in demand area once break this area anyone can keep view for UPSIDE Target.
THIS ONLY FOR EDUCATIONAL PURPOSE....
Gold (XAUUSD) Bullish Reversal: Targeting Upper Liquidity ZoneFirstly, our Algo-based indicators are used to create this analysis:
This 1-hour chart for XAUUSD indicates a strong bullish reversal is underway, with the price aiming to fill higher inefficiencies and test a significant resistance zone.
Analysis:
Market Structure Shift: Gold has broken its recent bearish structure with a powerful move upwards from the low near 3,267. The price has decisively reclaimed key moving averages (EMA 200, EMA 800), signaling a potential shift in the medium-term trend.
F illing Imbalances (FVG): The price action appears to be driven by a move to fill areas of imbalance, marked as Fair Value Gaps (FVG). After bouncing from a lower FVG, the price has surged and is now being drawn towards higher FVG zones.
Price Projection: The drawn black line illustrates a potential path for the price. It anticipates a minor pullback from the current resistance around 3,363. This pullback could find support near the 3,300 level before initiating the next major rally. This "dip and rip" pattern would establish a higher low and confirm the strength of the new uptrend.
Ultimate Target: The primary objective for this bullish move is the significant resistance zone at the top of the chart, labeled "LSOB" (Liquidity Sweep Order Block). This area, between approximately 3,427 and 3,438, represents a major liquidity pool where a significant reaction can be expected.
Strategy:
Idea: Look for a long entry opportunity on a potential pullback.
Entry Zone: A dip towards the 3,290 - 3,312 area could present a favorable entry, as this aligns with the projected bounce point.
Target: The main target for this trade is the upper resistance zone at 3,427 - 3,438.
Conclusion:
The confluence of a market structure break, the reclamation of key moving averages, and the magnetic nature of the upper Fair Value Gaps all point to a continued bullish scenario for Gold. A healthy pullback would offer a strategic entry to ride the trend towards the major liquidity zone above.
Disclaimer: This analysis is for educational purposes only and should not be considered financial advice. Always conduct your own research and manage risk appropriately.

NAS100: Bullish Reversal from Key Support ZoneFirstly, our Algo-based indicators are used to create this analysis:
This 1-hour chart for NAS100 highlights a strong bullish reversal from a critical support level, suggesting a potential move back towards recent highs.
Analysis:
Support Bounce: The index experienced a sharp sell-off but found significant buying pressure within a key support zone marked between 22,677 and 22,829. This area, labeled "LSQB" (Liquidity Sweep Order Block) and including the "Daily Open," acted as a strong floor, triggering a V-shaped recovery.
Momentum Shift: The oscillator at the bottom of the chart confirms this shift in momentum. After dipping into the oversold "BUY" zone, the indicator has sharply reversed and is trending upwards with conviction, as indicated by the projected black arrow. This suggests that buyers have taken control in the short term.
Moving Averages: The price has decisively reclaimed the EMA 200 (the main green line), a key indicator often used to gauge the longer-term trend on a given timeframe. Holding above this level is a strong bullish sign.
Price Projection: The drawn black line illustrates the expected price path—a continued rally from the current level back towards the red resistance zone near the recent high of approximately 23,700.
Strategy:
Position: Long (Buy)
Entry: The bounce from the support zone has already been confirmed. Current levels could be seen as an entry, or traders might look for a minor pullback that holds above the EMA 200.
Target: The primary target is the red resistance zone around the 23,700 level.
Conclusion:
With the price reacting strongly to a key liquidity zone and momentum indicators confirming a bullish reversal, the path of least resistance for NAS100 appears to be upwards. The immediate target for this recovery is the recent high near 23,700.
Disclaimer: This analysis is for educational purposes only and should not be considered financial advice. Always conduct your own research and manage risk appropriately.

BRETTUSDT: Bullish Breakout Aims for $0.08 TargetFirstly, our Algo-based indicators are used to create this analysis:
This daily chart for BRETTUSDT suggests a developing bullish scenario following a key technical breakout.
Analysis:
Channel Support: The price is trading within a broad ascending parallel channel. It has recently respected the lower boundary of this channel, finding solid support and bouncing off it, which indicates a potential continuation of the larger uptrend.
Trendline Breakout: A significant descending trendline that was previously acting as resistance has been broken. The price is currently hovering just above this line, which appears to be a classic breakout-and-retest pattern. A successful hold above this line would serve as strong confirmation for further upside.
Indicator Signal: The custom indicator at the bottom of the chart shows the price moving out of the "oversold" territory. The projected path of the indicator is pointing upwards, suggesting building bullish momentum that aligns with the price action.
Price Projection: The drawn red line illustrates a potential path for the price, anticipating a move upwards towards the upper resistance of the ascending channel.
Strategy:
Entry: The current price level (around $0.052) could be considered an entry zone, as it represents a successful retest of the broken trendline.
Target: The primary target for this bullish move is clearly marked between $0.08 and $0.10. This level aligns with the upper boundary of the long-term ascending channel.
Conclusion:
With multiple technical factors pointing in the same direction—a bounce from channel support, a breakout and retest of a key trendline, and a supporting indicator signal—the outlook for BRETTUSDT appears bullish. The next major objective for the bulls is the 0.08−0.10 resistance area.
Disclaimer: This analysis is for educational purposes only and should not be considered financial advice. Always conduct your own research and manage risk appropriately.

PENDLE LONGFirstly, our Algo-based indicators are used to create this analysis:
This 4-hour chart for PENDLEUSDT highlights a potential short-term bullish outlook followed by a significant bearish opportunity at higher levels.
Analysis:
Current Situation: The price is currently trading around the 4.04 level after finding support in a key "Liquidity Sweep Order Block" zone, identified between approximately 3.6531 and 3.9397. This bounce comes after sweeping a recent low, suggesting a potential short-term reversal.
Bullish Scenario (Short-Term):
The immediate outlook appears bullish. With price holding within the green support block, a move upwards is anticipated. The Fibonacci retracement levels serve as potential targets:
Target 1: 50.0% Fib level at 4.2871
Target 2: 61.8% Fib level at 4.4520
Major Target: The previous high at 5.0175
The oscillator at the bottom of the chart supports this view, showing a move out of the oversold region, indicating building bullish momentum.
Bearish Scenario (Mid-Term):
The primary area of interest for a potential sell-off is the significant resistance zone labeled "Liquidity Sweep Order Block - SELL." This area begins around the previous high of 5.0175 and extends upwards towards the 6.50 region. The chart's projection suggests that if the price rallies into this zone, it is likely to face strong resistance, presenting a potential opportunity for a short position. The "Overbought" status on multiple timeframes (15M, 30M, 1H, 4H) could add confluence to an eventual reversal from this upper resistance.
Strategy:
BUY: Look for continued support within the current green order block (3.65 - 3.94). A confirmed bounce and hold above this zone could validate a long position, targeting the Fibonacci levels mentioned above.
SELL: Wait for the price to rally into the red resistance zone starting at 5.0175. A short entry could be considered if the price shows clear signs of rejection or bearish reversal patterns in this area.
Conclusion:
The chart presents a dual scenario: a potential buying opportunity on the current support followed by a significant selling opportunity at the upper resistance. Traders should watch price action carefully at these key levels before making any decisions.
Disclaimer: This is not financial advice. The analysis is for educational purposes only. Always conduct your own research and manage your risk accordingly.


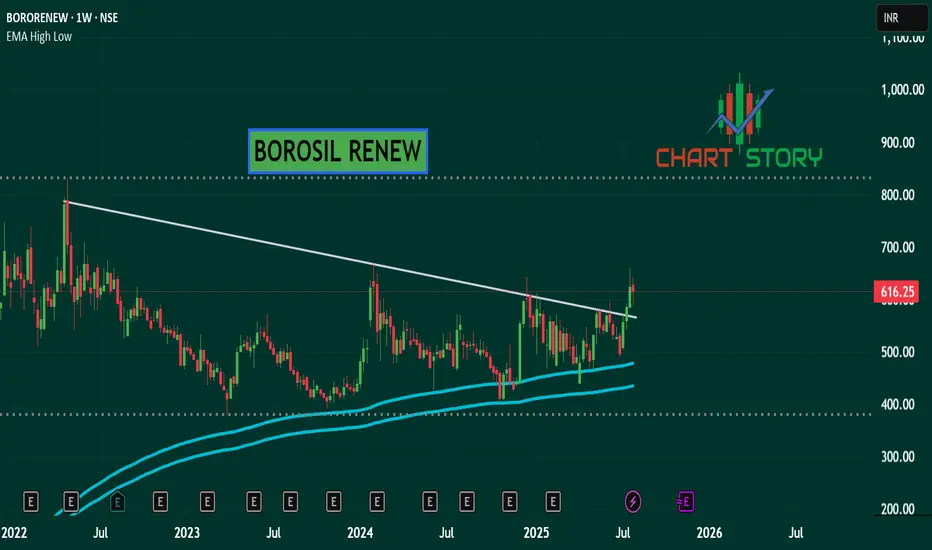
BOROSIL RENEW - TRIANGLE BREAKOUT BUYNSE:BORORENEW Weekly trendline breakout with triangle formation and near to bottom fishing location.
EMAMI - BOTTOM FISHING BUYNSE:EMAMILTD Weekly bottom fishing location with buyers activation exactly at there.

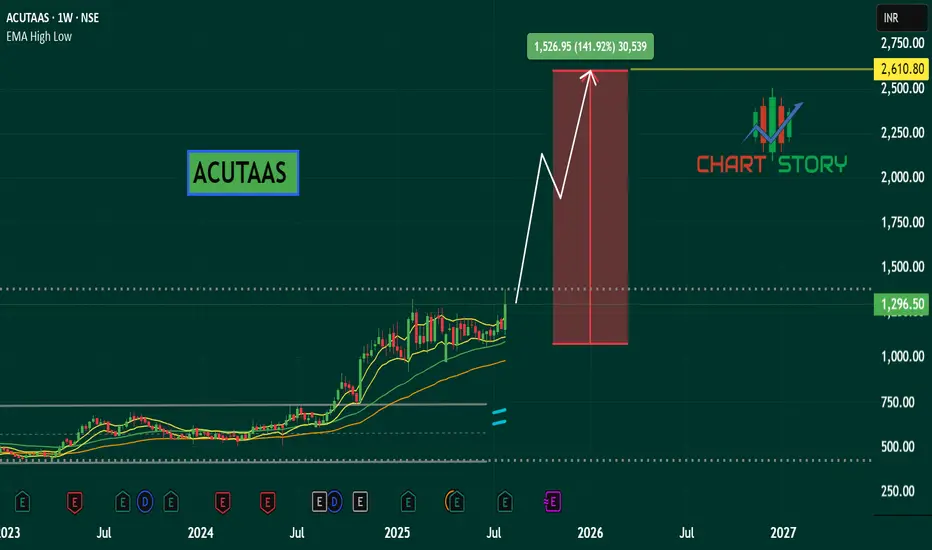
ACUTAAS - PARABOLIC BUYNSE:ACUTAAS Weekly parabolic formation with buyers and momentum may continue rally like fast furious.
SPY vs VIX two day LongSPY falling wedge - short term oversold - VIX wainning, looks like VIX to retreat to $18.50 area which translates into a DCB on SPY. We'd Aug 6th target = $631/633 Gap fill then probable resumption to the downside to test $613. Good luck 👍
