Will this repeat again?My indicator gave 3 BUY signals on BLNK in the monthly chart. Check what had happened in the last 2 signals? If history repeats itself BLNK can go $30+ in 3-12 months.
Contains IO script

Envision (VIS) on BASEEnvision (VIS) on BASE – Multi-Target Accumulation Setup
This analysis focuses on the long-term accumulation structure forming on VIS/BASE following a prolonged downtrend and multi-month consolidation near historical lows. Price has compressed within a narrow range (~$0.0060–$0.0070), showing exhaustion in selling volume and the first signs of structural support holding above the previous capitulation wick.
Technical Outlook
Accumulation Zone: $0.0058–$0.0070
This zone aligns with the lowest historical range and coincides with visible demand clusters on weekly structure. A clean reclaim and close above $0.008 would confirm a short-term reversal.
Breakout Confirmation:
A break and weekly close above $0.008139 (≈125%) signals initial strength and potential rotation toward mid-range resistance.
Target Levels
Target 1: $0.008139 (short-term breakout target, +125%)
Reclaiming this level confirms strength and may attract early momentum traders.
Target 2: $0.023874 (mid-range retracement, +368%)
This area represents the 0.382–0.5 retracement zone of the prior impulse move and prior consolidation shelf.
Target 3: $0.029982 (major fib confluence and liquidity pocket, +463%)
This aligns with the 0.65–0.786 Fibonacci retracement range and a historically heavy supply area (60K–98K BKR levels).
Volume & Liquidity Context
Volume shows compression near the base, and historical BKR (breaker block) metrics indicate previous sell-side inefficiency around $0.023–$0.030. These zones are likely to attract liquidity hunts and partial profit opportunities during a recovery leg.
Not Ever Financial Advice.

NQ range levelsWe have a clearly defined range to now buy low and sell high, then pray for the breakout in your favor.
The Peak Vol and S/R levels are my areas to trade reactions. Not looking for anything long over Peak Vol unless very strong buying comes in.
The hopium trade for the day is to get short at the local GP at Peak Vol and break the lows.

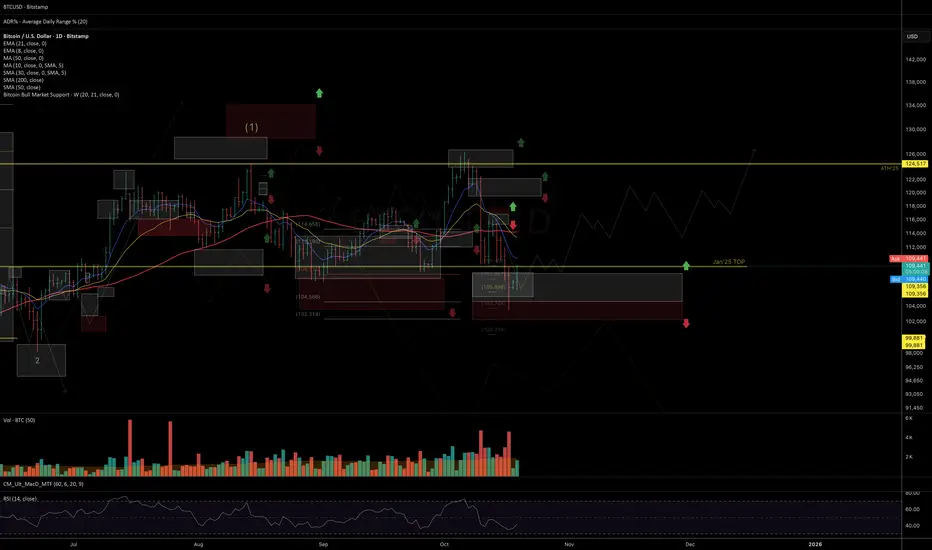
Weekly Review on #BTC and #ETHThe market continues to move within the framework of the main hypothesis — a potential completion of the correction from historical highs and the early signs of a possible trend reversal, as discussed in my recent market review:
As long as #BTC maintains weekly closes above 102K, the base scenario (both for #BTC and #ETH) remains unchanged — gradual recovery, consolidation, and a move toward new highs. I wouldn’t rule out the possibility that this could happen even before year-end.
However, a weekly close below 102K would signal an increased probability that the four-year macro growth cycle has ended and the market could be transitioning into a macro corrective phase across the crypto sphere.
Updated key levels and charts:
BITSTAMP:BTCUSD
Support: 106K | Resistance: 110–112K
Chart:
BITSTAMP:ETHUSD
Support: 3680 | Resistance: 4360
Chart:
Thank you for your attention, and I wish you a productive start to the week and successful trading decisions ahead!
Wait for price to SHOW ME WHERE TO MAKE MONEY!Hey Squad,
Im going to keep this short and sweet but I want you to PEEP......lol the possible setups that are coming. This week we can not tell exactly what to look for since the market is giving us opposing call outs. For example, The Weekly looks like a double top has formed showing bears/selling favor but the 4/8h shows respecting of a low and shows the forming of a double bottom!
so what does this mean? We are waiting for price to show us who to follow!! But if you were to ask me....I believe the USD will suffer this week due to shutdown and uncertainty so I believe we will be trending low! Good for gold and silver traders and those that see weakness in the $!
If we can break below the 1.163 area and hold I think its clear we are moving down until we hit a high time frame FVG.
Tell me your thoughts and comments on this Analysis!
and like always! Gd look out there and TAKE PROFIT!

BTC Still bullish looking forwardThere is some juice left, the 'last hooray'.
My very subjective likelihood of happing in percent.
Manage your risk.

SNX Long & TargetsEliot Wave Structure - Fibonacci - Trend lines
Short term target: 2.1
Medium term: 3.35 - 4.0 - 4.6

Manipulation Fractal Bitcoin (Run It Back To The Upside)Comparing the 2 bottoms and how they are freactals of each other.
Very similar behaviour on Market Cipher with the Yellow X's (manipulatiion) and double blood diamonds.
Plenty of liquidity to grab back to the highs. Money flow is also coming out of the red back into the green as it curves up.

TSLA 4hr Chart- Bullish Setup in Motion Ahead of Earnings Tesla (TSLA) is showing real strength heading into earnings week, closing Friday around $439.31 (+2.46%) with solid momentum. On the 4-hour chart, we’ve been trading inside a descending channel, and that’s important because while it may look bearish at first, this type of channel often leads to bullish breakouts once volume and structure align.
Right now, price is testing the upper side of that channel with a clean bounce from the recent demand zone and reclaiming both the 10 and 20 EMAs. That’s a strong technical sign heading into Monday.
Technical Breakdown
Pattern: Descending Channel (Bullish Continuation Potential)
Trend: Uptrend Confirmed
Momentum: Strong Buy (MAs showing 93.33%)
Oscillators: Leaning Bullish (27.27% Buy Bias)
Entry Zone: Around $435 – $438 (breakout retest area)
Stop Loss: Near $428 (below 61.8% Fib retracement)
Targets:
TP1 → $444.76
TP2 → $454.15
Extended Target → $469.95 (premium supply zone)
Resistance to Watch:
$443.52 – prior swing high
$454.15 – Fib confluence
$469.95 – premium zone and potential top block
Support Levels:
$428 – key breakout retest
$414 – lower boundary of the channel
$401 – major structure support
Heading Into Monday
Bulls are clearly back in control. The chart shows a steady reclaim of momentum with higher lows forming and volume starting to pick up. If price holds above $435, we could see continuation toward $444 – $454 early in the week. A breakout above $443.52 with strong volume would confirm that shift in momentum toward the next leg up.
If we see a short-term dip, I’ll be watching $428 – $414 as the key demand zone where buyers might reload before earnings.
Final Thoughts
Don’t sleep on descending channels — they often set up the biggest bullish reversals once the breakout happens. TSLA is sitting in that pocket right now, with multiple indicators flashing Strong Buy across timeframes. As long as $435 holds, this setup continues to favor the bulls into earnings.
Bias: Bullish
Timeframe: 4H leading into Monday
Expect some volatility, but the trend remains intact and momentum looks healthy.
📘 This is for educational purposes only and not financial advice. Always do your own research before making any trade decisions.

HOW-TO: Trade-o-Scope Plot Custom Data v2This is a short HOW-TO on using the Trade-o-Scope "Plot Custom Data v2" indicator

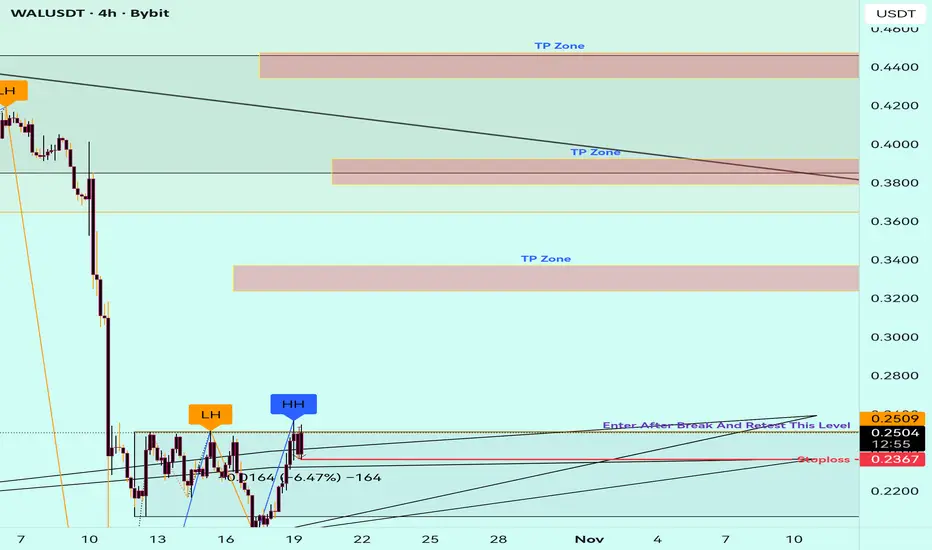
WAL – Technical Outlook: Key Levels, Market StructureWestern Alliance Bancorporation (WAL) is a regional U.S. bank listed on the NYSE, known for serving commercial and real estate clients across the western states. The company’s fundamentals show stable earnings and moderate growth, though the stock remains sensitive to interest rate policy and financial sector sentiment.
In this analysis, we review technical structure, price action, and potential breakout/reversal zones using multi-timeframe confluence, RSI momentum, and volume flow. The chart highlights areas of interest for both short-term and swing perspectives.
📊 Key Focus: Support–Resistance Dynamics, Trend Confirmation, RSI Divergence, and Volume Reaction Zones.
⚠️ Disclaimer: This content is for educational purposes only and does not constitute financial advice. Always perform your own due diligence before making investment decisions.
#WAL #WesternAllianceBancorporation #Stocks #TechnicalAnalysis #TradingView #SwingTrading #MarketStructure #PriceAction #VolumeAnalysis #RSI #Breakout #Finance #Investing
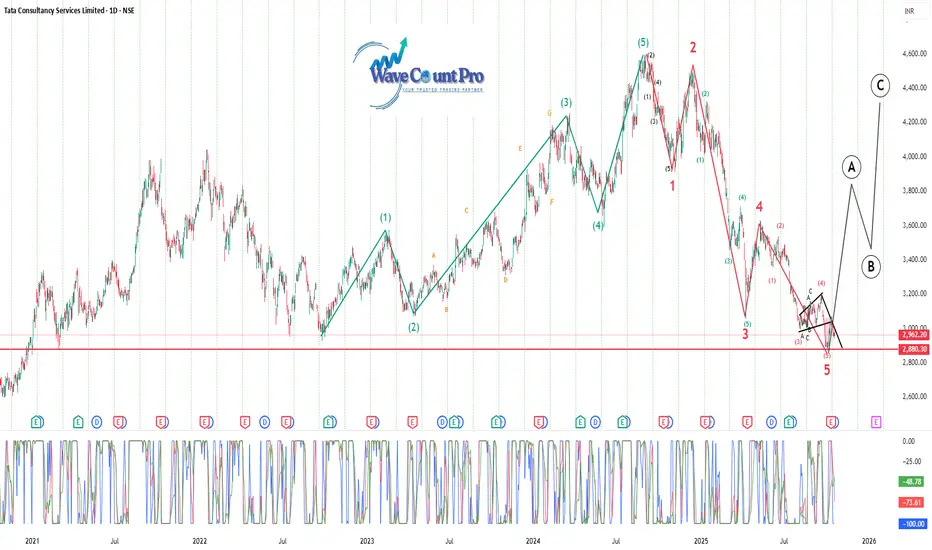
TCS Trend Reversal ??🔹 Wave Structure Overview
The chart clearly maps a complete 5-wave impulse uptrend (green count) followed by a 5-wave corrective decline (red count).
The current position indicates that Wave 5 of the corrective phase has just completed — signaling a possible end of the downtrend and setup for a bullish reversal.
🔹 Key Observations
Support Zone:
Strong horizontal support lies between ₹2,880–₹2,950, previously tested multiple times since 2021.
Price is currently hovering at this zone, showing signs of consolidation and potential reversal.
Wave Count Analysis:
The correction from the top (~₹4,600) unfolded in a clear 5-wave structure (1–2–3–4–5).
Subwave (5) appears to have terminated near the major support — a typical ending point for an Elliott Wave correction.
Pattern Recognition:
A falling wedge structure can be observed near the Wave 5 termination, which often precedes a bullish breakout.
The oscillator at the bottom also indicates oversold levels, reinforcing the likelihood of a rebound.
🔹 Projected Path (Next Phase)
The chart projects a corrective rally (A–B–C) following the completed 5-wave decline:
Wave A: Initial sharp rebound possibly toward ₹3,600–₹3,700.
Wave B: Pullback to retest lower supports near ₹3,200–₹3,300.
Wave C: Final leg up toward ₹4,200–₹4,400 range.
This A–B–C pattern would represent a corrective recovery phase before the next larger structure develops.
🔹 Sentiment & Outlook
Aspect View
Current Trend Bearish cycle likely completed
Immediate Bias Bullish rebound expected
Support Zone ₹2,880–₹2,950
Upside Targets ₹3,700 (A), ₹4,400 (C)
Invalidation Level Breakdown below ₹2,880
Momentum Oversold, positive divergence forming
🔹 Conclusion
TCS appears to have completed a major correction and is positioned for a medium-term trend reversal.
Holding above ₹2,880 will confirm strength, potentially leading to an A–B–C recovery toward ₹4,400 levels.
Momentum indicators and wave structure both support the beginning of a bullish phase after a prolonged decline.
MASSIVE MOVE FOR ALTCOINS INCOMING GOD CANDLE Classic doji printed only a matter of time before we see a huge leg up on alts
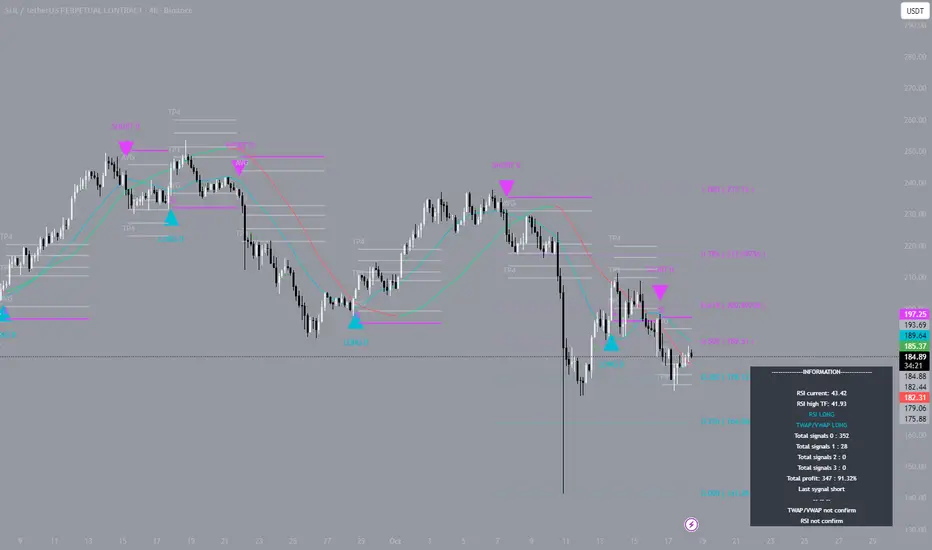
SOL: Stability in ChaosSince October 7, the Solana market has been in turbulence, with drawdowns, sharp reversals, and liquidity spikes. But it’s in periods like these that a systematic approach proves its strength. I opened the first entry on October 7 and closed it at the second take-profit level with modest 1.5x leverage. Then came a pause, and on October 13 I entered again without leverage, cautiously, locking in about 1.5% profit. It was already clear the strategy works even in a turbulent phase. When the next move began on October 16, I followed my proprietary system. The trade unfolded cleanly along the structure: four consecutive take-profit levels, about 7% profit with 2x leverage. Discipline and visual control of levels is what prevented losses.
On TradingView, over 90% of successful traders use multiple indicators at the same time, but the key is always the same: the ability to spot patterns and ignore noise. This systematization makes trading deliberate rather than an emotional chase.
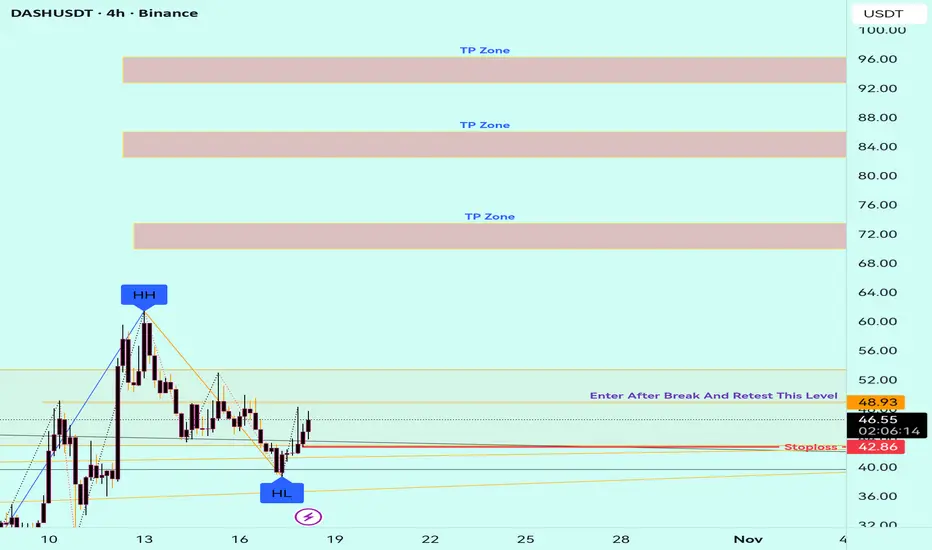
DASH (DASHUSDT) — Technical Breakout Setup & Key Levels
💡 Description:
DASH, one of the early privacy-focused cryptocurrencies, aims to provide fast and low-cost digital payments through its unique two-tier network and masternode system. Despite declining market attention compared to its peak years, DASH continues to maintain strong fundamentals in transaction efficiency and governance decentralization.
In this analysis, I highlight potential breakout zones, trend structure, and dynamic support/resistance areas. Key price levels will determine whether DASH continues its short-term bullish momentum or faces rejection near the upper range. Volume confirmation and RSI divergence are closely monitored for validation.
This setup is for educational and informational purposes only — not financial advice. Always do your own research and manage risk accordingly.
#DASH #DASHUSDT #CryptoAnalysis #PriceAction #TechnicalAnalysis #BreakoutTrading #RSI #ChartPatterns #CryptoTrading #Altcoins #MarketStructure #TraderCommunity #TradingView
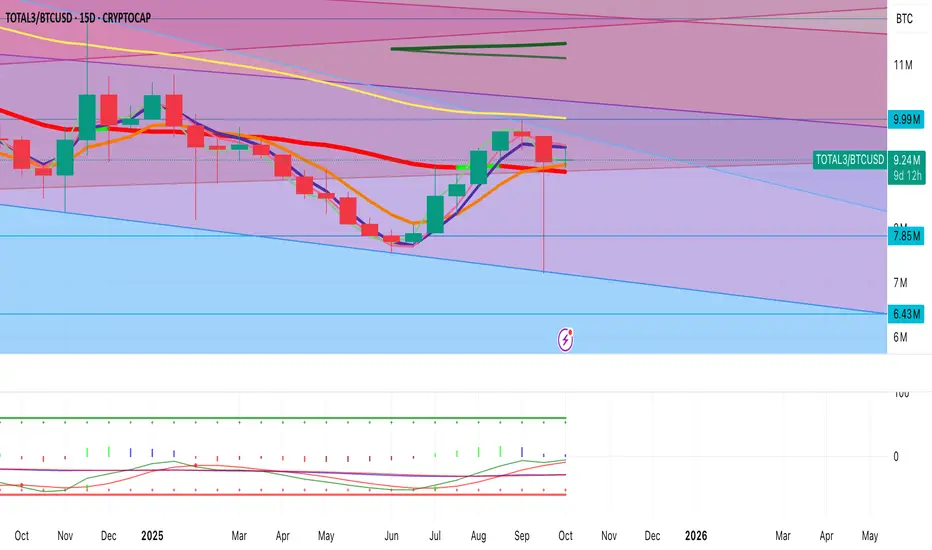
ALT SZN ISN'T OVER ?What the chart is signaling (6-week)
Structure & candles
After a long bleed, the last 3–4 six week candles show higher lows and persistent lower-wick demand classic accumulation versus BTC rather than capitulation.
Current candle is Red and sitting at/just above the short EMAs, attempting its first multi-candle base since the 2023–24 downtrend.
Key levels printed on your chart
Pivot/Midline: ~9.99M (dotted).
Near supports: 7.85M → 6.43M → 4.72M .
Resistance ladder above: 11.84M → 14.62M → 16.69M → 17.5M .
Price is working to reclaim 9.99M and poke 11.84M; a weekly-6 close above that first resistance unlocks the next band.
Moving averages
Price has reclaimed the 6W 8-EMA and is testing the 13/21-EMA cluster (your thin yellow/orange).
The MA (think 50/60 SMA equivalent on 6W) is flattening loss of downside velocity. An H6 close above the fast EMA stack typically precedes a mean-reversion push toward that red MA.
Momentum/oscillator panel (bottom)
Momentum is curling up from deeply compressed/oversold territory with a bullish cross developing.
Price made equal/lower lows while momentum put in higher lows → bullish divergence on a very high timeframe. Those usually take one more candle to “confirm”—which lines up with your ~9–10 day window into the 6W close.
Geometry (Murrey/Gann bands on your chart)
Price has lived in the light-blue lower quadrant for a long stretch and is now pressing the mid-band. In these fan/quarter systems, reclaiming the midline (9.99M) often leads to fast travel to the opposite band (11.84M) because liquidity thins between bands.
Why the next 9–10 days matter
The label on your chart shows “9d 4h” left on the active 6-week candle. High-TF momentum crosses and EMA reclaims only matter at close.
If we close above 9.99M and ideally tag/close near 11.84M, you lock in:
a confirmed bullish divergence,
a multi-EMA reclaim, and
a mid-band recapture.
That combo historically precedes alts-over-BTC outperformance as the next candle begins.
Bullish triggers to watch (checklist)
6W Close ≥ 9.99M (pivot reclaimed).
6W Body closes above the 8/13/21-EMA stack (thin yellow/orange).
Momentum cross up on the 6W panel with histogram/ticks turning positive (your dots turning up and spacing higher).
BTC behavior: consolidation or mild drift lower in BTC.D (dominance) and range-bound BTC price—this is when TOTAL3/BTC rallies.
Probable path if confirmed
Phase 1 (confirmation): Close above 9.99M → quick probe of 11.84M.
Phase 2 (expansion): Acceptance above 11.84M opens a measured move into the next liquidity shelf 14.62M (prior distribution top and fan confluence).
Phase 3 (euphoria test): If momentum keeps trending and BTC stays sideways, a wick into 16.69M is feasible before a pullback to retest 14.62M.
Timing & mechanics of an alt rally
Sequence that often plays out:
BTC impulse stalls →
BTC ranges (vol crush) →
Liquidity rotates into alts →
TOTAL3/BTC breaks its EMA stack →
Fast move band to band.

BTC: short positionLocally, the price continues to decline, there is no indicator signal for long position transactions yet

$ITRM LONG - Resting on Huge SupportORLYNVAH commercial launch and share offering
On October 16, 2025, Iterum Therapeutics announced a new $20 million "at-the-market" share offering to be conducted under an existing sales agreement.
As part of a business update provided 11 hours earlier, the company shared details on the ongoing commercial launch of ORLYNVAH (oral sulopenem) in the U.S. community market. Iterum Therapeutics expects modest sales for ORLYNVAH™ during the initial commercialization period in 2025.
The FDA-approved antibiotic is the first oral penem antibiotic in the U.S. and is intended to treat uncomplicated urinary tract infections (uUTIs) in adult women with limited alternative oral treatment options.

BTC update. Support zones did not hold - new ones belowOk, quick update.
We have to now give a thought that $100K is pretty close already. We are few weekly close/open levels as support but if market makers don't front run as again the 100K is there up for grabs.
What speaks for 100K is that there is Major Swing 0.5 fib level very close forming a strong psychological zone together. Breaking below will break also havoc, fear and panic which is of course all the market makers wet dream to get us to sell our Bitcoin to them with bargain and good discount.
BIG QUESTION: Will you sell you Bitcoin at $100K or cheaper?

BTCUSDT.P - price updated chart - still going to the planPrice has hit the path pretty accurately. This is the key level of 50 % wick of that flash crash dump. However so many already knows this and is publicly spoken so I'm very careful taking blind trades from here but after showing strength and more confluence and confluence for actual reversal.
Meaning little bit consolidation on these levels to build solid base. Quick pump will very likely end up price coming back to make even with inefficiency left behind.
Look for rejections on above LTF FVGs for going more lower levels to test SR Flip zone and 100K levels.

Empire Metals Accumulation Empire Metals caught my attention at 40, quite late compared to some traders, but early enough to take 1/2 profits when it hit 80..
Since then its been shaken around, but the very recent publication of a major upgrade to the quality and extent of potential Titanium reserves might explain the gyrations as larger players with a longer view look to build positions
To me, the current price offers a decent entry - based on a VSA analysis of the price action as shown on the chart

In daily time frame formed head shoulder pattern it seems to be In daily time frame formed H&S pattern confirmed. It seems to be downtrend
Target of head to neck line measurement

ETH thesis: DAT Flush outFollowing the recent crypto liquidation event, approximately $19.6 billion in assets were wiped out. Many participants suffered significant losses, and trust between centralized (CEX) and decentralized exchanges (DEX) has been shaken.
Interestingly, BMNR was the only DAT that executed a purchase of ETH around the $3,860 level.
At present, I hold no position in ETHA. Over the coming weeks, I plan to monitor the weekly chart for a potential continuation to the upside, specifically targeting the golden zone between the 0.618 and 0.786 Fibonacci levels.
I’ll update this trade setup if conditions align and it remains a reasonable entry.
While the probability of ETH retracing to $3,300 is low , it remains plausible—especially in light of recent developments such as ETHZ announcing a reverse split. My thesis is that we may see another flush that aggressively devalues low-treasury ETH DATs, making them more attractive for a swing entry.
