Contains IO script
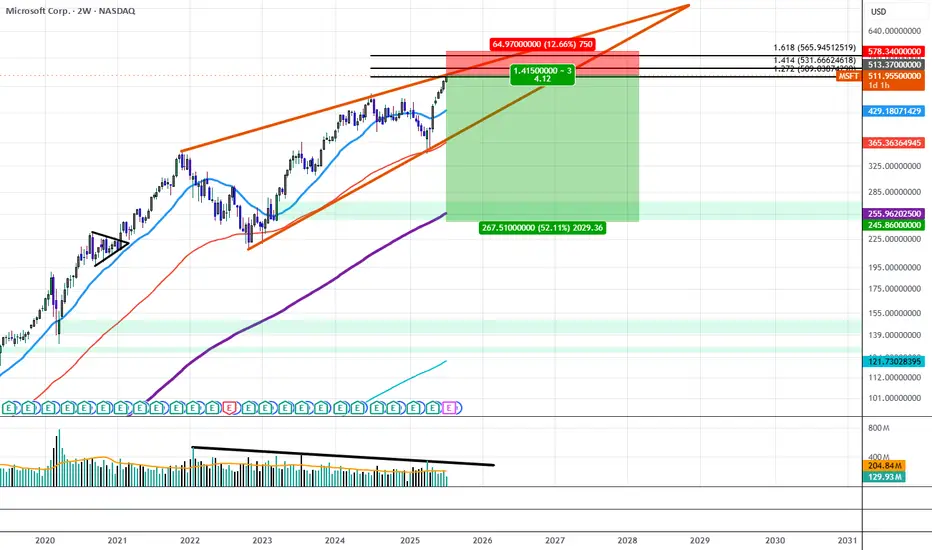
Microsoft Sees Declining Trading Volume Despite All Time HighsSince December of 2021, MSFT traded within a Rising Wedge structure that has gradually resulted in lower and lower highs in volume, at the same time IV on the Options Chain has begun to price down the strikes above $515 while Shorter Term Downside IV has begun to price up all the way out to $240.00. If this trend continues we will likely see the $515 area act as strong resistance as liquid interest above it begins to dry out.
This could be the beginning of a move to break down the wedge and trade down to the lower strikes first targeting the $365 price level and resolving around $240 near the 200 Period SMA.
NEARUSDT.P Long Setup from Peak Formation Low I'm going long on NEARUSDT.P after spotting a clear change of character (CHoCH) on the 1-hour timeframe, confirming a shift from bearish to bullish structure.
📍 Entry: 2.678
🎯 Target: 3.135
🛡️ Stop-loss: 2.637
This setup formed at a peak formation low, with price tapping into a well-defined bullish orderblock, which acted as a strong demand zone. The CHoCH was the final confirmation for the entry, signaling smart money involvement.
This trade idea is suitable for:
🔹 Beginners – to learn how CHoCH + orderblocks provide high-probability entries
🔹 Intermediate traders – to refine entry/exit precision using market structure
🔹 Pro traders – for smart money confluence and risk-reward optimization
📈 Watching for price to respect the order block and push toward the target. RR is favorable. Manage risk accordingly!

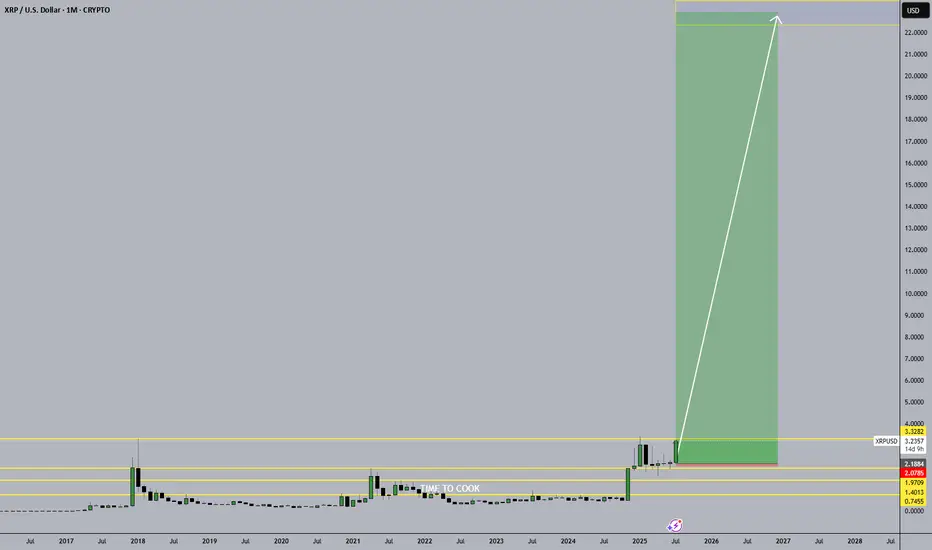
The RATS are out of the KITCHEN. It's TIME to COOKA simple trade - looking for XRP > $22 by December 2026, if it survives this breakout.
A token backed by dark state money.
GBP GBPUSD Supply-Demand Long SignalHigher Timeframe Analysis:
- Price inside daily/Weekly level of demand + pivot
- Long term trend = uptrend
- Fundamentals Bullish
- COT Mixed
- Technicals Bullish
Lowertimeframe:
- Price broke downard ML
- Price removed the opposing pivotal level of demand
- DBR Demand created from CPI event
- Split risk on GC + GBP
This is a mix of using Sentiment, technical analysis, and fundamental analysis with supply-demand.

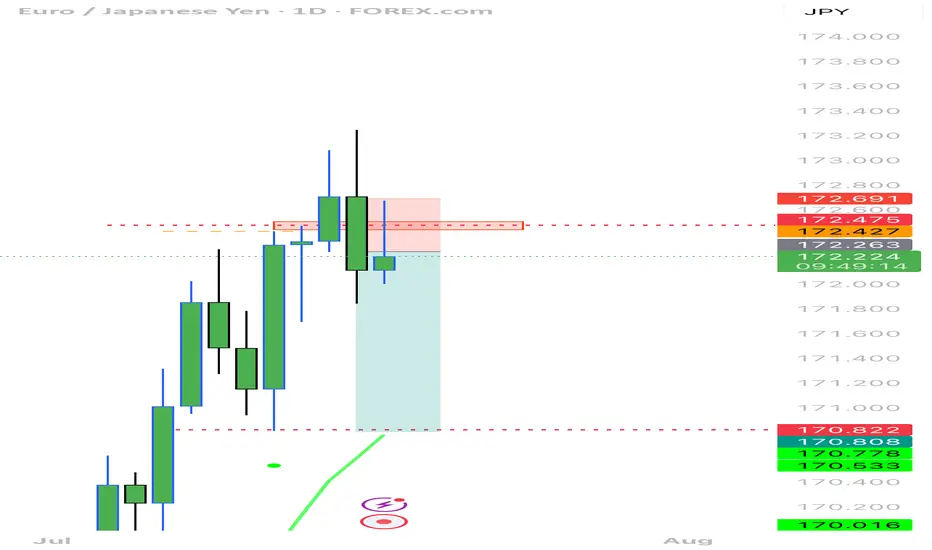
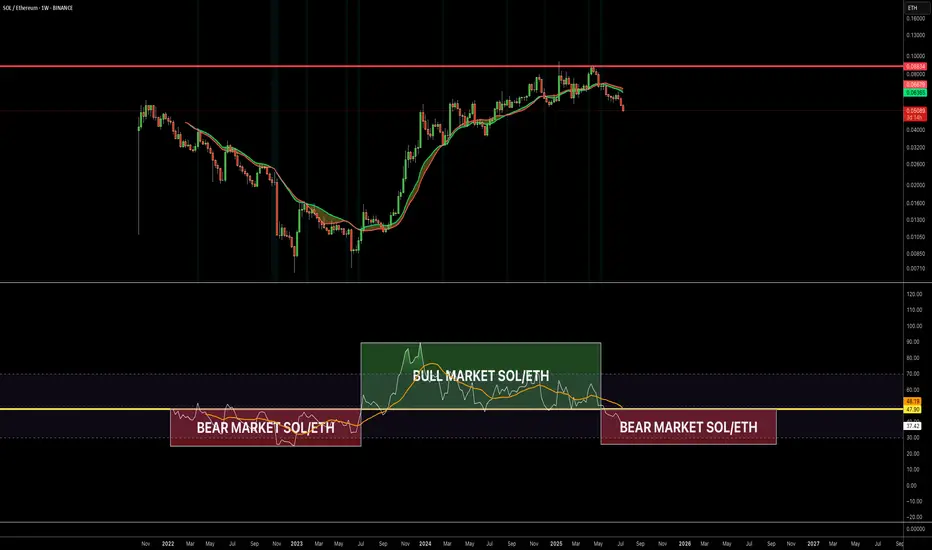
Bear market for SOL/ETHSOL has entered a bear market against ETH, and this could last for 6–12 months. I wouldn’t pay attention to SOL until ETH drains all the liquidity from the altcoins.
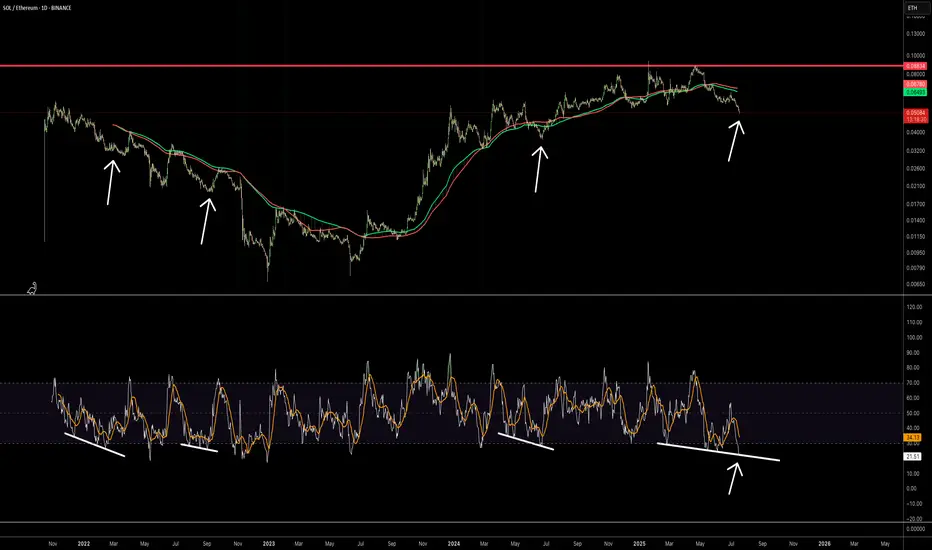
SOL/ETH Bear bounceI think we’ll see a 20–30% bounce in SOL/ETH in the near future, regardless of where the market goes. But it will still be a bearish retest.
Divergence Gap on CMP PAR indicatorPlaying the Divergence Gap on CMP PAR indicator to compound longs/shorts in a strong trebnd.

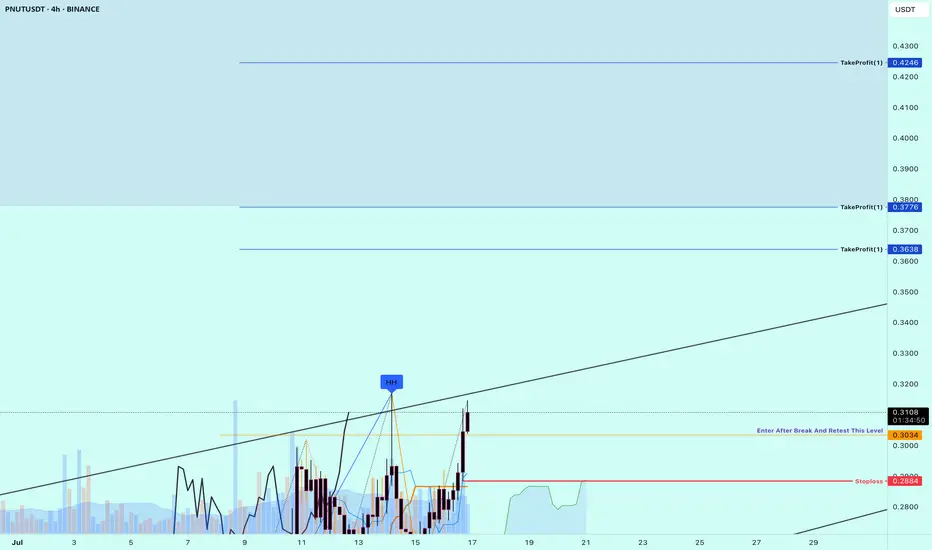
Buy Trade Strategy for PNUT: Exploring DeFi Yield Farming PotentDescription:
This trading idea is based on PNUT, the native token of the Peanut DeFi platform, which operates primarily within the SmartBCH ecosystem. PNUT plays a crucial role in powering yield farming, liquidity mining, and governance activities on the platform. With DeFi continuing to expand globally, projects like Peanut aim to offer accessible, low-cost, and efficient tools for users to participate in decentralized finance. The fundamentals of PNUT are supported by its utility, active community, and its positioning in an emerging blockchain environment with room for growth.
However, it is important to understand that PNUT operates in a highly volatile and speculative segment of the crypto market. DeFi protocols are particularly sensitive to shifts in regulation, platform security, and liquidity changes. While there may be upside potential, such assets require strict risk management and an informed investment strategy.
Disclaimer:
This trading idea is for educational purposes only and should not be considered as financial advice. Trading or investing in cryptocurrencies like PNUT involves substantial risk and may result in a complete loss of capital. Always do your own research, assess your financial situation carefully, and consult with a licensed financial advisor before making investment decisions. Past performance is not indicative of future results.
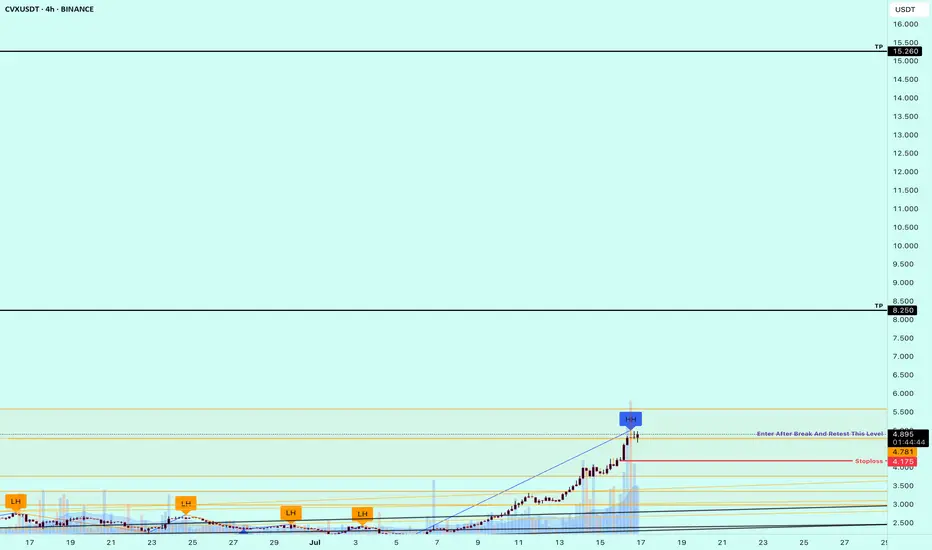
Buy Trade Strategy for CVX: Tapping into DeFi Yield OptimizationDescription:
This trading idea highlights CVX, the native token of Convex Finance, a key player in the DeFi ecosystem focused on optimizing yield farming within the Curve Finance protocol. CVX allows users to earn boosted rewards without locking their tokens directly into Curve, making it highly attractive for liquidity providers and yield seekers. With its growing influence over Curve’s governance and incentives, CVX has become a strategic asset in the DeFi landscape. As institutional interest and on-chain liquidity continue to grow, Convex's role in yield aggregation strengthens, potentially increasing demand for CVX.
Despite the strong fundamentals, the cryptocurrency market is unpredictable and susceptible to various external risks, including regulatory shifts, smart contract vulnerabilities, and overall market sentiment. Like all digital assets, CVX investments require careful consideration of both potential rewards and risks.
Disclaimer:
This trading idea is for educational purposes only and should not be interpreted as financial advice. Trading cryptocurrencies, including CVX, involves substantial risk and could result in the loss of your entire investment. Always do your own research, evaluate your financial situation, and consult with a licensed financial advisor before making any investment decisions. Past performance is not indicative of future results.
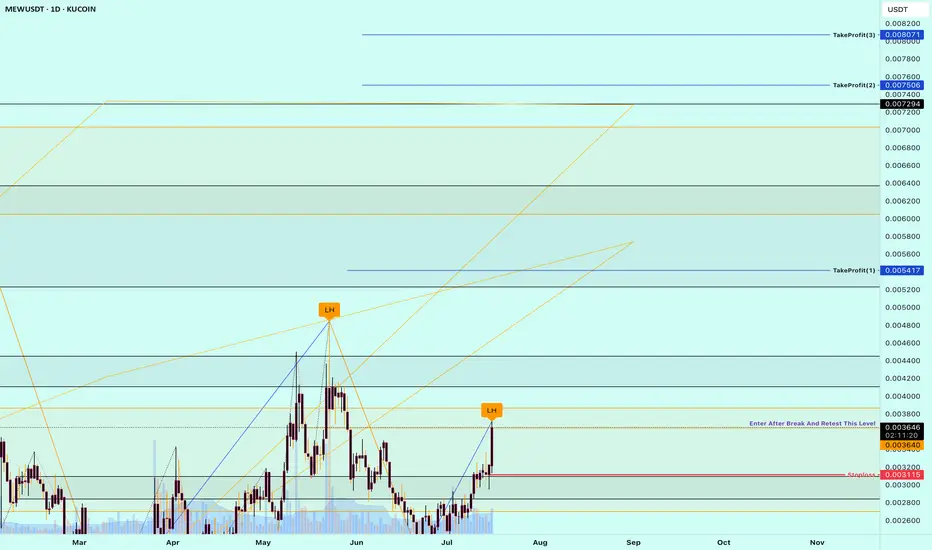
Buy Trade Strategy for MEW: Tapping Into the Meme Economy SurgeDescription:
This trading idea focuses on MEW, a rising star in the meme coin category that’s capturing community attention through strong online engagement and viral appeal. Unlike traditional cryptocurrencies, MEW leverages the power of internet culture and social media dynamics to drive visibility and adoption. With a growing holder base and active community, MEW stands as a speculative yet potentially rewarding asset for those looking to benefit from the explosive trends in the meme economy. Its branding, humor-driven outreach, and increasing listings on exchanges contribute to its early growth momentum.
Still, it’s important to remember that meme tokens are among the most volatile and unpredictable assets in the crypto market. Price swings can be rapid and sentiment-driven, making it essential to approach this asset class with a clear risk strategy and realistic expectations.
Disclaimer:
This trading idea is for educational purposes only and does not represent financial advice. Trading cryptocurrencies such as MEW involves substantial risk, including the possible loss of your entire investment. Always perform your own due diligence, evaluate your financial capacity, and consult a licensed financial advisor before investing. Past performance is not indicative of future outcomes.
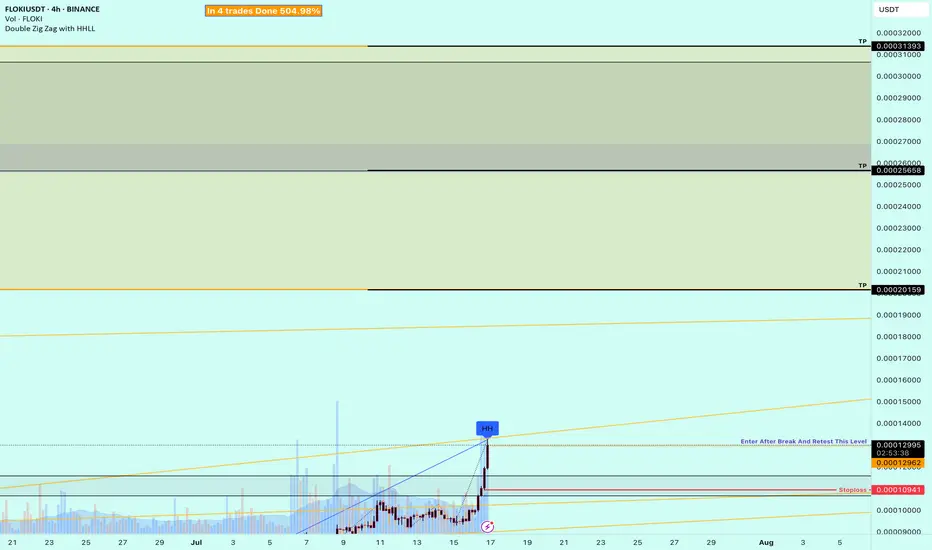
Buy Trade Strategy for FLOKI: Tapping Into Memecoin UtilityDescription:
This trading idea is centered on FLOKI, a cryptocurrency that originated as a memecoin but has evolved into a broader ecosystem project with real-world utility. Backed by a vibrant community and inspired by Elon Musk’s Shiba Inu, FLOKI aims to differentiate itself through initiatives such as Floki University (crypto education), Valhalla (an NFT metaverse game), and strategic charity partnerships. The project's growing utility and branding strength position it as a serious contender among memecoins shifting toward tangible use cases.
Despite its promising development roadmap, FLOKI remains a high-risk asset due to its origins in speculative hype and the unpredictable nature of retail-driven trends. External factors like market sentiment, regulatory scrutiny, and overall crypto market conditions can strongly influence its price action. Investors should exercise caution and apply disciplined risk management when considering exposure to FLOKI.
Disclaimer:
This trading idea is for educational purposes only and does not constitute financial advice. Cryptocurrencies like FLOKI are highly speculative and involve substantial risks, including the complete loss of capital. Always conduct independent research, consider your financial situation, and consult a licensed financial advisor before making any investment decisions. Past performance is not indicative of future results.
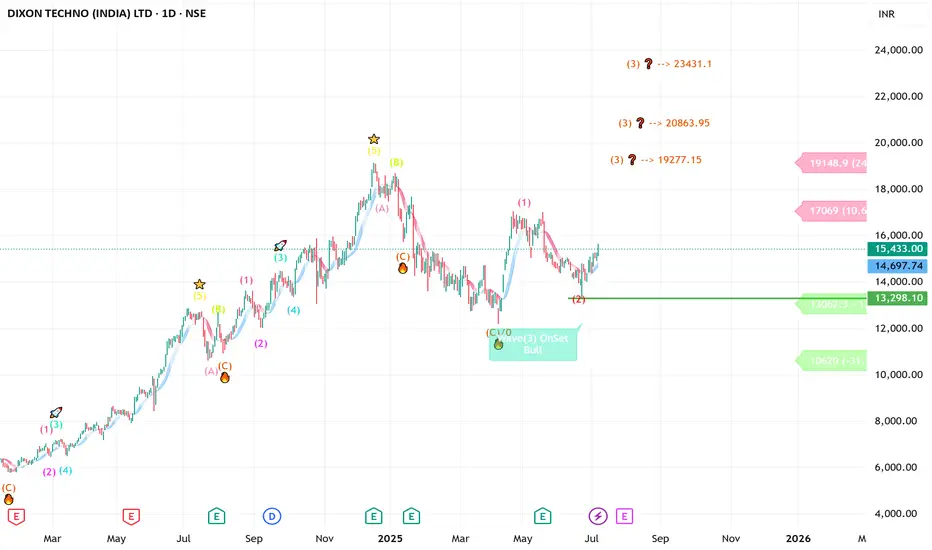
DIXON -----Daily counts Fresh Implus start anytime -UpsideDIXON -----Daily counts indicate Excellent bullish wave structure.
Both appear to be optimistic and this stock invalidation number wave 2 low
target short / long term are already shared as per charts
correction wave leg seems completed
Investing in declines is a smart move for short/ long-term players.
Buy in DIPS recommended
Long-term investors prepare for strong returns over the next two to five years.
one of best counter
Every graphic used to comprehend & LEARN & understand the theory of Elliot waves, Harmonic waves, Gann Theory, and Time theory
Every chart is for educational purposes.
We have no accountability for your profit or loss.

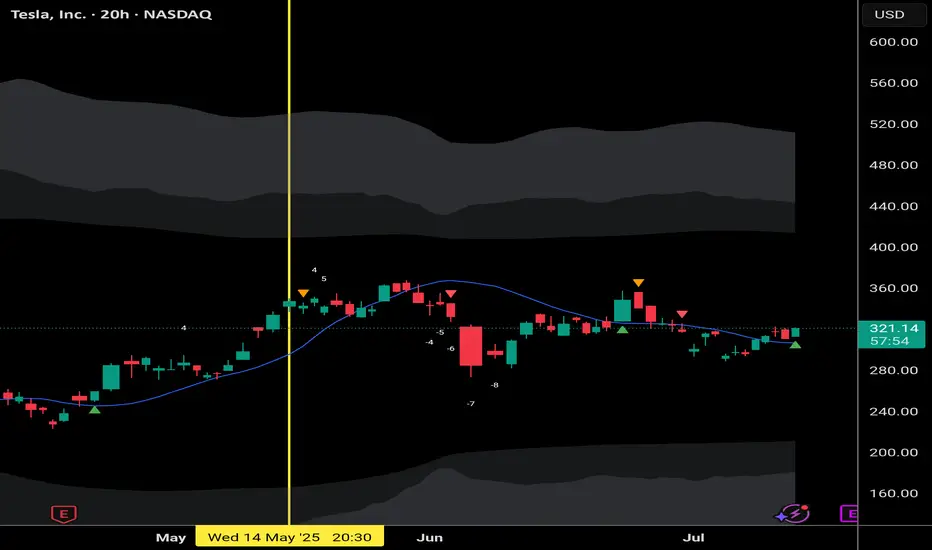
TSLA about to put in a huge reversal dayCoinrotator.app signaling higher after a 3 month consolidation.
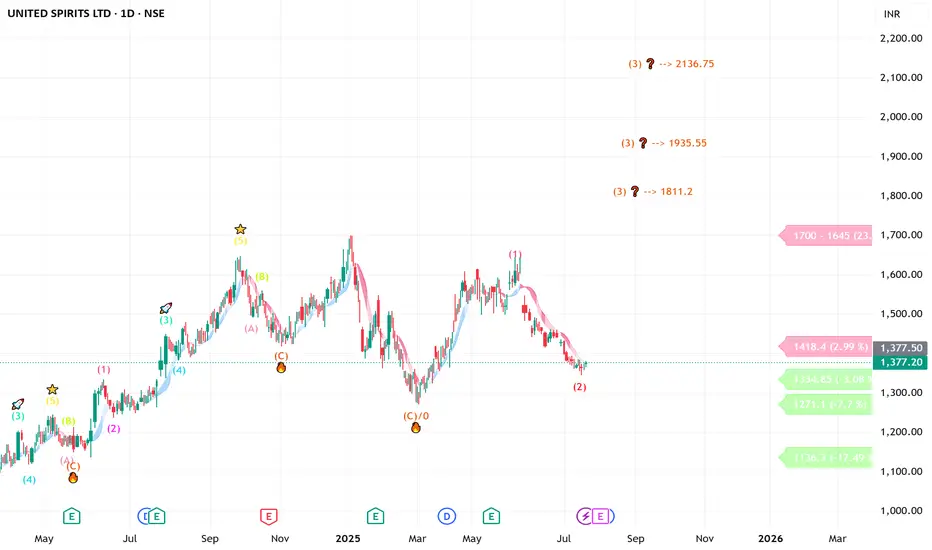
UNITED SPIRITS looking good ( short to long investment)Daily counts indicate Excellent bullish wave structure
Both appear to be optimistic and this stock invalidation number (S L) wave 2 low
target short / long term are already shared as per charts
we assume correction wave leg seems completed
Investing in declines is a smart move for short/ long-term players.
Buy in DIPS recommended
Long-term investors prepare for strong returns over the next two to five years.
one of best counter
Every graphic used to comprehend & LEARN & understand the theory of Elliot waves, Harmonic waves, Gann Theory, and Time theory
Every chart is for educational purposes.
We have no accountability for your profit or loss.
BTCUSD ShortBTCUSD 1H Technical Analysis
⚙️ Scenario Outlook:
Bias: Bearish
Preferred Play: Wait for price to enter the 119,000–120,000 supply zone. If price shows signs of exhaustion or bearish confirmation (e.g. bearish engulfing, strong rejection), a short position becomes favorable.
Targets: First target at 117,200; final target near 115,600–115,000 range, depending on how price behaves within the intermediate demand.
🔼 Supply Zone (Resistance):
Zone: 119,000–120,000
This red zone marks a previously unmitigated supply area aligned with the 50% Fibonacci retracement level from the prior bearish impulse. It's expected to act as the final resistance before the next move lower. A rejection from here would confirm bearish intent and offer optimal risk-to-reward for short setups.
🔽 Demand Zones (Support Targets):
First Demand Zone: 117,200–117,600
This green border is your first liquidity pocket to watch. It may offer a brief reaction or bounce, but if bearish momentum holds, price is likely to continue through it.
Deeper Demand Zone: 115,600–116,200
This is the stronger accumulation area, marked by your lower green zone. It sits just above the previous CHoCH and BOS lows, making it a prime liquidity sweep and reversal candidate if price moves deeply into it.

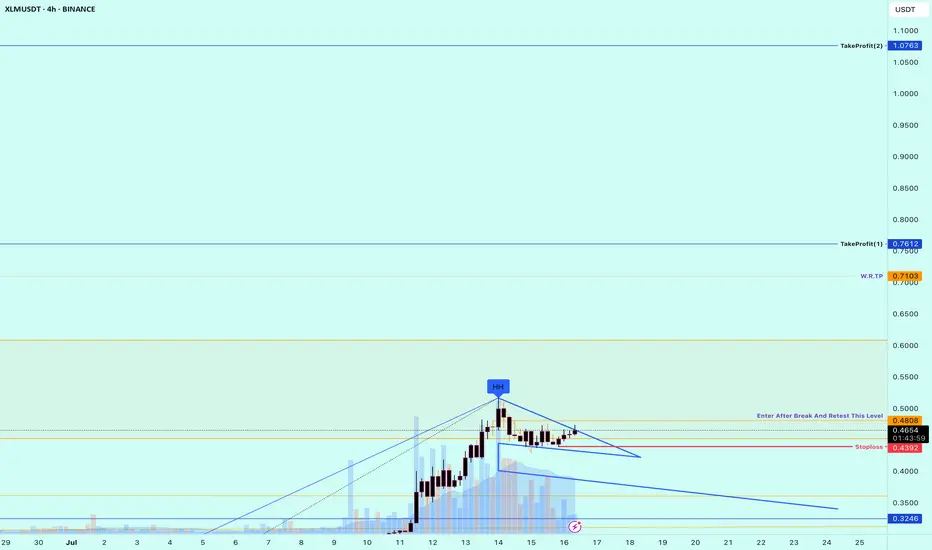
Buy Trade Strategy for XLM: Powering Fast and Inclusive PaymentsDescription:
This trading idea highlights XLM (Stellar Lumens), the native asset of the Stellar network — a blockchain platform built to enable fast, low-cost, and borderless financial transactions. XLM is designed to facilitate cross-border payments and connect financial institutions, payment systems, and individuals, especially in underbanked regions. Backed by the Stellar Development Foundation and partnerships with major global players such as MoneyGram, Stellar is focused on real-world use cases, making XLM a compelling project in the global payments and remittance sector.
With growing institutional interest and real-world utility, XLM stands out as a fundamental player in blockchain-based financial inclusion. However, despite its strong fundamentals, the cryptocurrency market is highly volatile. Factors such as global economic conditions, regulatory changes, and evolving technologies can significantly impact price action and project development.
Disclaimer:
This trading idea is for educational purposes only and does not represent financial advice. Trading cryptocurrencies like XLM involves substantial risk, including the potential for total loss of capital. You should always perform your own research, understand your risk tolerance, and consult a professional financial advisor before making any investment decisions. Past performance is not indicative of future results.
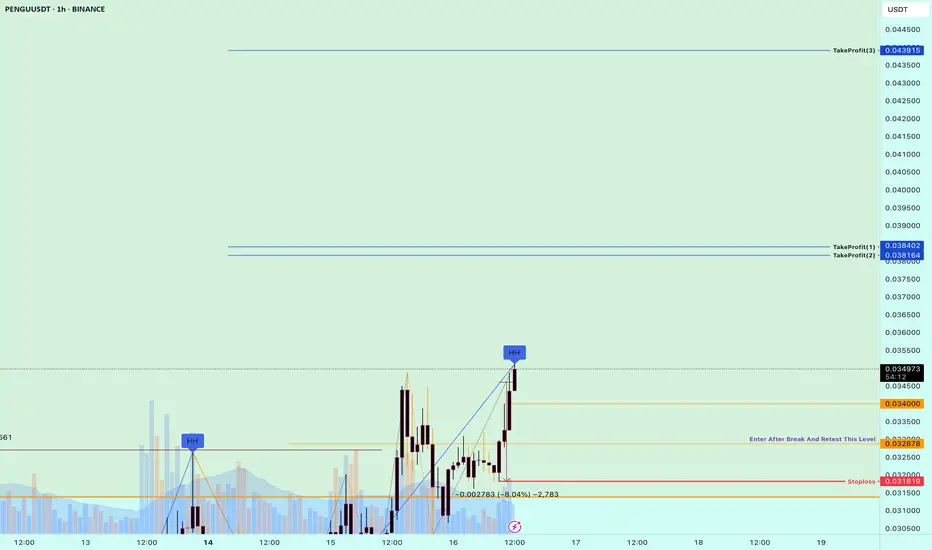
Buy Trade Strategy for PENGU: Tapping Into Meme Culture and UtilDescription:
This trading idea centers on PENGU, a meme-based cryptocurrency that has gained attention not only for its viral appeal but also for its effort to introduce real utility into the meme coin space. Unlike many short-lived meme tokens, PENGU combines strong community engagement with ambitions for ecosystem development, including NFT integrations, staking mechanisms, and cross-platform use cases. Its fast-growing community and increasing social media traction position PENGU as a potential breakout project in the ever-evolving world of digital assets driven by online culture.
Despite its popularity, it’s important to understand that meme tokens like PENGU carry high levels of risk due to their speculative nature and susceptibility to rapid price swings influenced by hype, sentiment, and limited fundamental data. As always, a cautious and informed approach is essential when engaging with these assets.
Disclaimer:
This trading idea is provided for educational purposes only and does not represent financial advice. Meme coins such as PENGU are highly speculative and involve significant risk, including the potential loss of your entire investment. Always conduct your own research, evaluate your financial situation carefully, and consult a licensed financial advisor before making any investment decisions. Past performance does not guarantee future results.
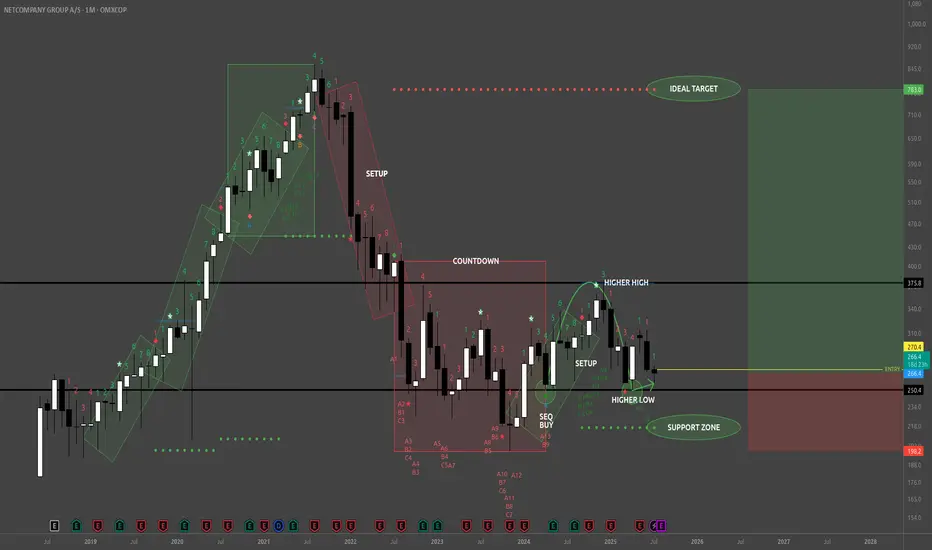
NETC - BuyReading the NETC Monthly chart from the left to right look at that remarkably strong bullish trend (green rotated rectangles) which spanned 3 consecutive TD 1-9 Setups. That's 9 strong months of uptrend culminating in the beginning of the bearish trend with a TD Sequential 13 Sell signal at the apex, a Bearish Engulfing Pattern, and a large Doji immediately preceding the TD 1-9 Setup (red rotated rectangle) which exhausted the downward momentum, and dissipated the downward momentum with the TD Sequential 13 Buy signal (first green circle).
From the TD 13 Buy signal (first green circle) buyers created a higher high, followed by 4 consecutive red TD counts, whose bearish implications were disrupted by the strong Bull Sash pattern. I really like this spot for opening a long position. One caveat is that the Weekly TD Buy Setup is on 7/9 so the next two weeks could bring the price lower, potentially even tapping the TDST support zone, but whether that happens or not look left on the chart everywhere from my entry price and below. This is all wholesale pricing territory!
TDST up at 783 is a nice upside target just shy of the ATH traders will be gunning for.
Now on fundamentals here's where things are really nice. NETC just bought themselves the Danish IT banking company SDC (for 1 Billion DKK) which serves about 100 Nordic banks. That's going to be bringing in sticky, recurring revenues in a critical financial sector. NETC revenues are also not materially tied to the U.S., and doesn't rely on American consumer sentiment, regulatory policy, or supply chains.
Whether price falls from here or not I'm holding on to my shares until this pays off big. Maybe this is a trade for your trading temperament too.
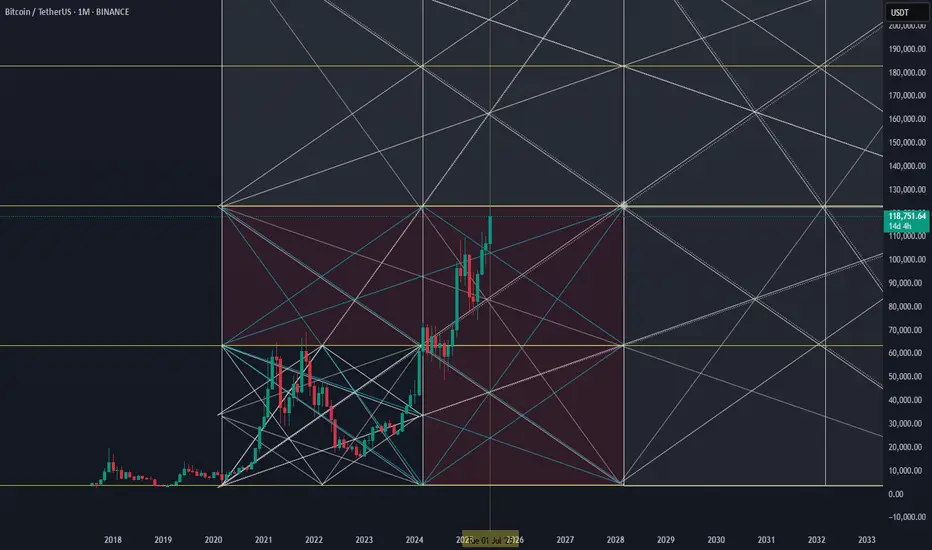
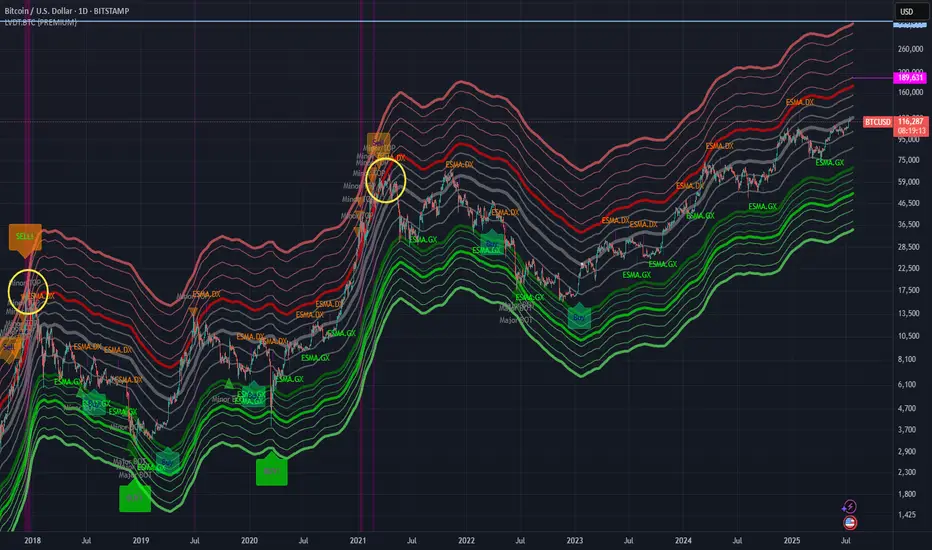
$300k+: LVDT estimated BTC ATH target this cycle.According to my old LVDT indicator, BTC should reach $300k or even higher at ATH this cycle.
The real parabolic (banana zone) run will only start when BTC touches the thick red line again.
Time to gradually DCA sell every time BTC pierces significantly above the thick red line (signaling a potential point of Blow-off-Top).
I plan to be updating this tread from time to time as the chart progresses until the absolute "Sell" signal is triggered.
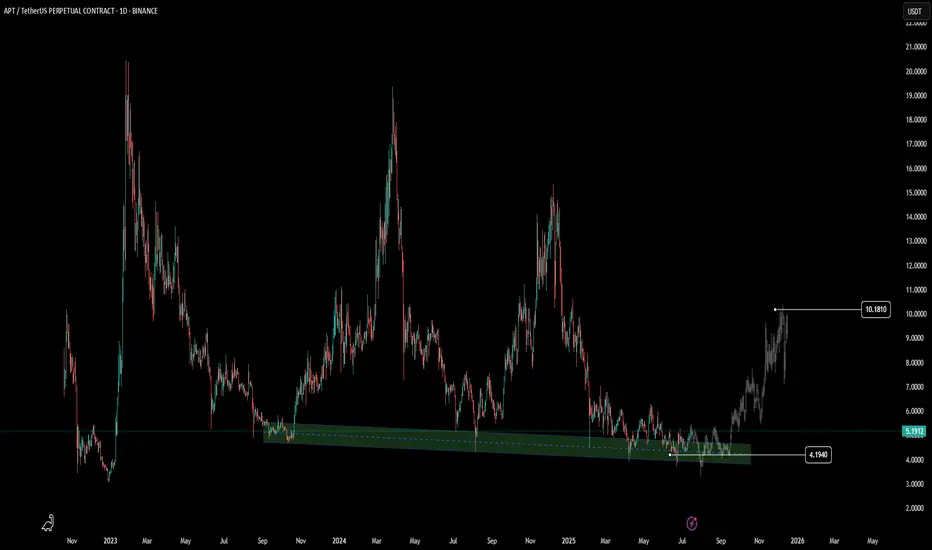
$APT could still rebound to $10.AMEX:APT could still rebound to $10 if it repeats its previous price action. History doesn’t repeat, but it often rhymes.
Disclaimer: This is not financial advice. Always do your own research before investing.