Gap down and go?This could just keep grinding higher, but I think an opportunity could be coming. This has been trading in a distribution pattern, I believe there are some weak hands that need to be shaken out. I’m looking for a correction into the zone outlined. I’ll be playing this with some long dated options / commons. This won’t be active until zone is hit.
Contains IO script
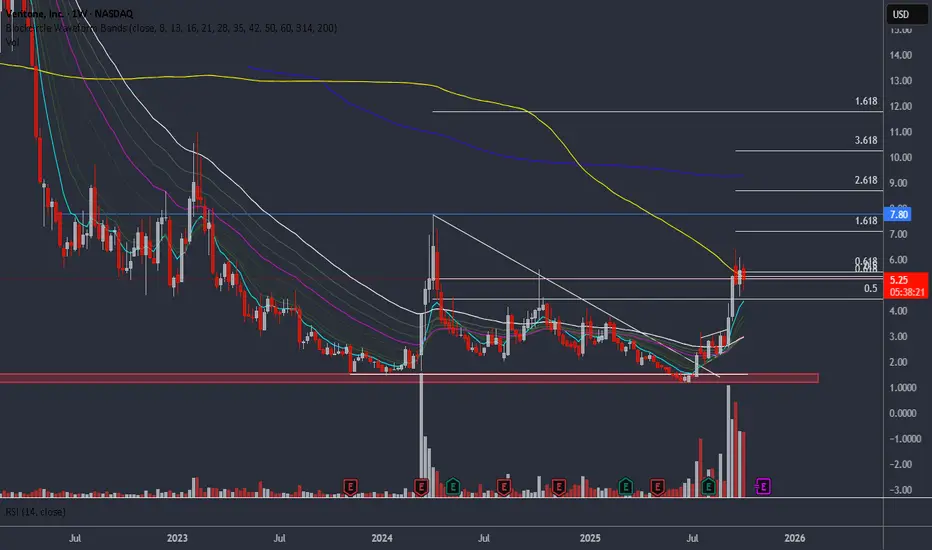
$VERI steady steadyWith avg cost basis of $1.49, im a steady hold on this one. trend still looks good .
ALT SEASON - Thoughts and timingALT SEASON!
We’re all waiting for it like 8-year-olds waiting for Christmas. 🎄
No one can promise it’ll come — but this chart is a reminder that if it does, it can be over very quickly.
Check out last year’s short period from Nov–Dec, when USDT.D dropped fast and we got that mini alt season. From today’s level to the anticipated alt-season low back then was just 30 days.
Just wowow!

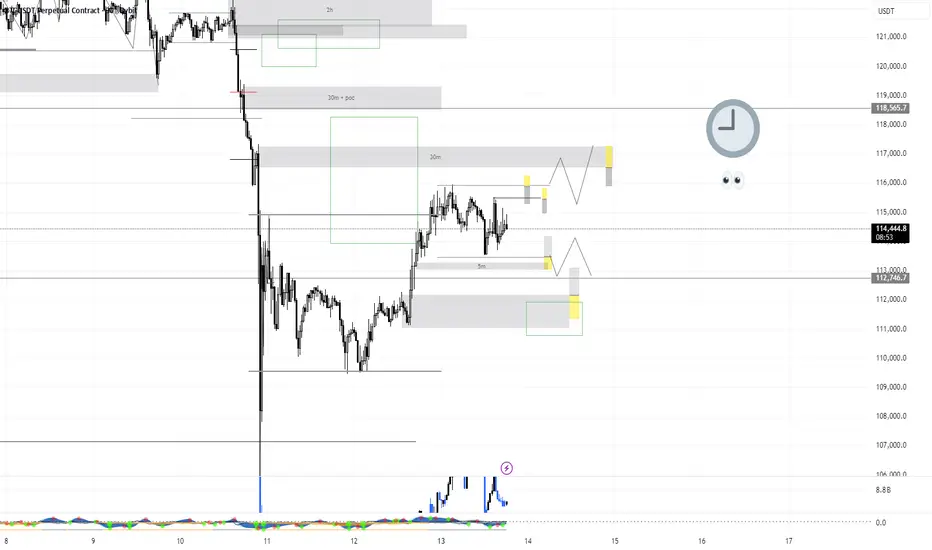
BTC update - CME GAP still openCRYPTOCAP:BTC 8H chart with updated paths from yesterday. CME GAP left open. They front run us which is very common tactic. You wait for some key level to trigger your entry as signal and it will make reversal just before.
It is good to remember that the data we 'retail' get isn't that deep what institutions and whales have. So it's not fair game in that sense.
Expecting some reactions on pink POC level but eventually breaking down to sweep the lows of pink dotted line which is VAL = Value Area High.
We still might reach green fib pullback zone from here if price closes above yellow SR flip zone.


Options...Lets talk about risk managment
Options are a tricky subject to learn. There are many technical terms to understand like the Greeks, contract size and more.
Today I wanted to illustrate a few examples of option calls (bullish bias) on NASDAQ:BRLT
Using a website called, optionprofitcalculator.com I can simulate my idea by specifying the strike price, date of expiration as well as entry price.
What you will get is a chart outlying different profit curves and what you would expect to see when exercised. I took the time to draw trendlines outlining the minimum the price would need to be by set a date to breakeven throughout the life of the option.
What I noticed is that not all options are created equally as we know. But, I never had such a visual as just how different they were. Observe each line, I provided projection for a few points of reference to compare.
Percentage at expiration (set at $6 expiration for comparison), the expiration date and breakeven projection line.
This little experiment is a simple example research first is important. Look First then Leap.
Cheers,
Uni.

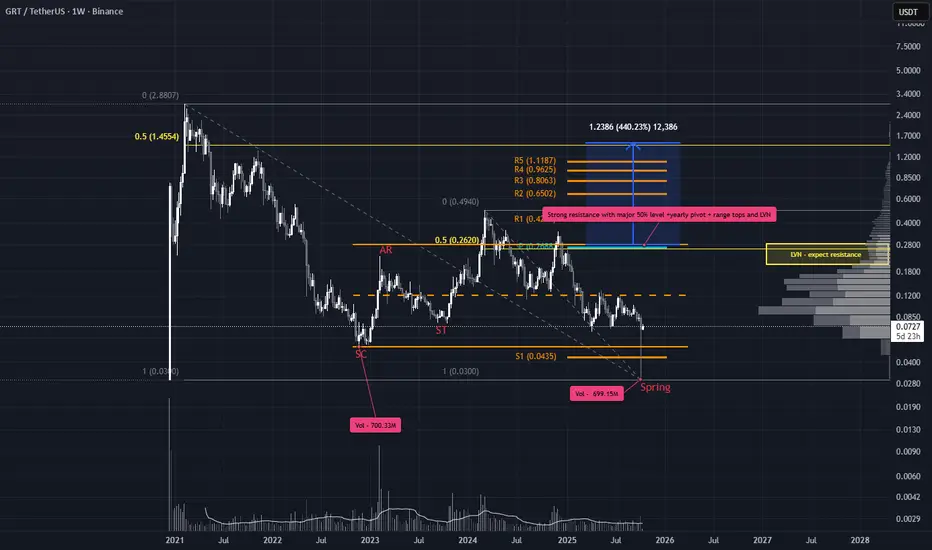
Spring in Play, Structure SpeaksGRT is showing a fantastic range structure with a clean spring—an ideal case study in Wyckoff volume analysis.
Despite the historic $20B crypto liquidation on October 10th, GRT’s wick printed on lower volume than the Selling Climax (SC), suggesting no need for a Spring retest. Price closed decisively back inside the range and above the yearly S1 pivot classic signs of smart money absorption.
Trade Scenarios
Option 1: Immediate Entry
Entry: Current price
Stop Loss: Just below the Spring
Targets:
TP1: ~$0.26 — strong resistance zone
TP2: ~$1.53 — projected range target aligned with macro 50% level
These targets may seem ambitious, but they’re structurally derived. This is what the chart is telling us.
Option 2: Pullback Entry
Entry: Wait for a pullback near the EQ of the Spring wick on the daily TF
Stop Loss: Based on daily structure
Targets: Same as Option 1
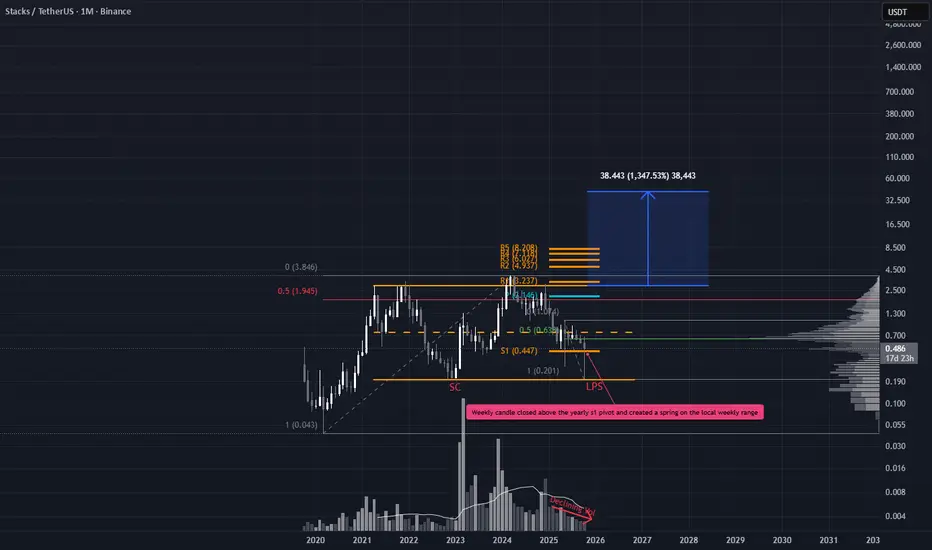
Smart Money Absorbs as Max Pain Setup UnfoldsSTX has been quietly range bound for nearly four years, but the recent price action demands attention. While most alts printed fresh lows during the October 10th liquidation flush, STX held firm its wick didn’t breach the Selling Climax (SC), and volume surged. This Last Point of Support (LPS) signals strong demand and potential smart money presence (weekly timeframe).
Trade Scenarios
Option 1: Immediate Entry
Entry: Current price
Stop Loss: Just below the LPS
Targets:
TP1: Yearly pivot + major 50% level
TP2: If price breaks the range high, a projected range extension gives a minimal target of ~$42
These targets may seem ambitious, but they’re derived directly from the chart structure, no hopium, just data.
Option 2: Pullback Entry
Entry: Wait for a pullback near the EQ of the large wick
Stop Loss: Based on daily TF structure
Targets: Same as Option 1
XAU/USD OUTLOOK TODAY 14-10-25BUY/SELL SCENARIOS:
BUYS(1):
1) Body Candle Close above the 4116.98 level.
2) Retest the 1h Bullish BOS at the 4116.98 level.
3) Create a 5/15m Bullish Engulfing Candle to capitalize on BUYS towards the 4175.00 level.
BUYS (2):
1) Retest the 1h Bullish FVG at the 4090.76 level.
2) Create a 3/5m Bullish CHOCH with a body candle close (with a FVG).
3) Retest the 3/5m Bullish CHOCH level to capitalize on BUYS towards the 4175.00 level.
SELLS:
1) Body candle close below the 4085.98 level on the 1h timeframe.
2) Retest the failed 1h Bullish FVG at the 4085.98 level.
3) Create a 3/5m Bearish Engulfing candle to capitalize on SELLS towards the 4024.50 level
Trade Smart, Trade with a concise plan! Cheers

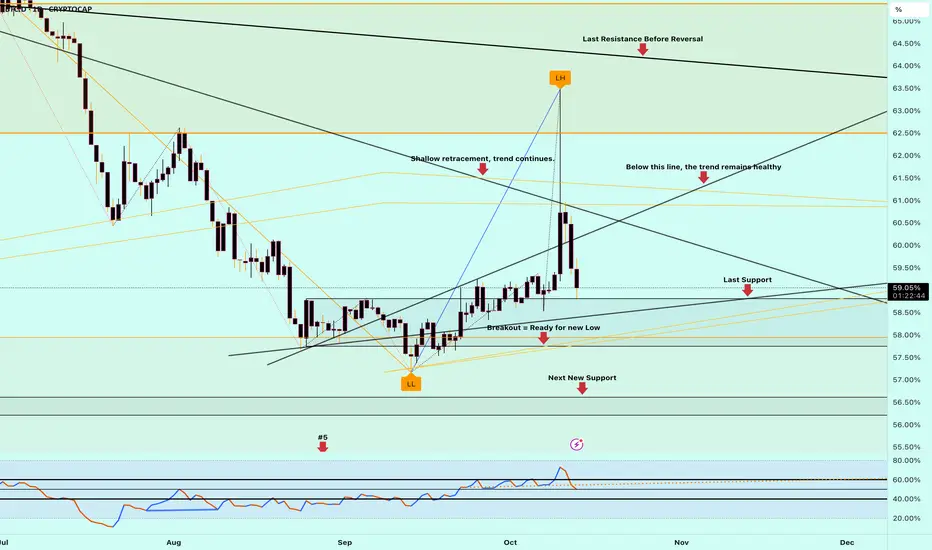
BTC Dominance Technical & Fundamental OverviewDescription:
Bitcoin Dominance (BTC.D) represents the market share of Bitcoin relative to the total cryptocurrency market. Tracking BTC.D can help identify trends in altcoin cycles and overall market sentiment. This analysis combines technical patterns, support/resistance levels, and relevant market fundamentals to provide an informed perspective.
Disclaimer:
This content is for educational purposes only and does not constitute financial advice. Trading cryptocurrencies involves significant risk. Always perform your own research before making any trading decisions.
Hashtags / Keywords:
#BitcoinDominance #BTC #CryptoMarket #TechnicalAnalysis #CryptoTrading #AltcoinSeason #MarketTrends #BTCAnalysis #CryptoEducation #TradingView
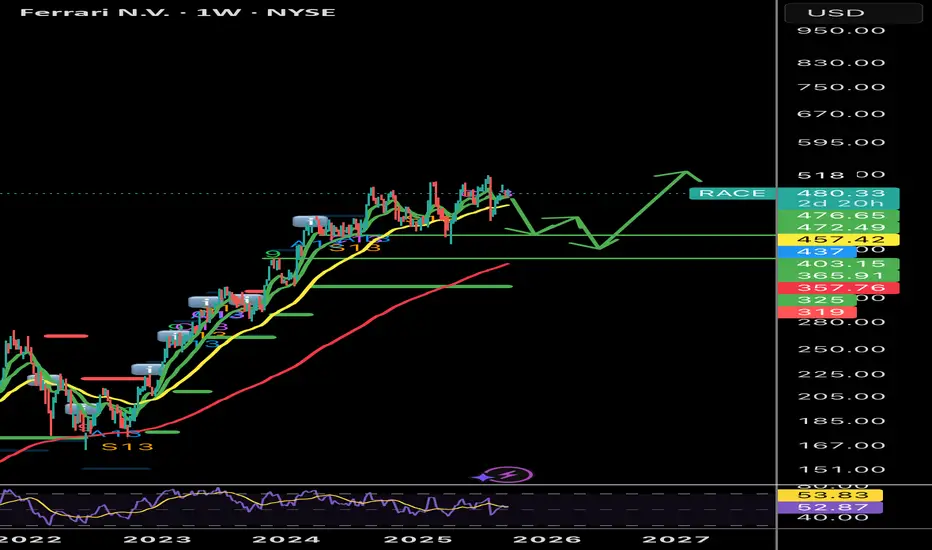
Go for the Gold - I dare you 12 HOUR CHART:
This one of my personal charts... these days I build most of my indicators, however you cannot share them unless they published.
Up top is the RSI, super fancy I know.
The lines are extreme volume highlighted in the RSI.
This is yearly Fibonacci shown, and this is history in the making.
However you might see a problem. RSI set to 18 not 14.
Pumping the market on Columbus Day, just a tad divergent.
If you look at gold and silver as much as I do - you be alarmed how many times when you open your chart you read a news notification "safe-haven".
This is programming - its over and over. Look for yourself through the thunderbolts at the bottom of the chart.
I've highlighted some points of interest below.
The best to all of you.

SOL: intraday transactionsAfter a strong decline, intraday trades can be traded. While the long position is open, the part has already been fixed

Are you ready for the Hammer?Hi there,
be ready for strong pullback soon!
Sure, price can always go higher or lower, but market is not a straight line it moves in impulses and correction, and Fifth wave is always can be tricky can have extensions also!
God luck

IS the bull MARKET OVER! My next tradeIn this space, you’ll find my long-term outlook on Bitcoin 🪙 — helping you see the bigger picture of what’s been happening in the market over the past week 📉📈
🔥 You’ll get insight into:
🔑 Key levels to watch for your trading or investing strategy
💡 The next profitable trade to position yourself for
🧭 A clear perspective on where Bitcoin could be headed next
Yes, we’ve seen a crazy drop 😱 — but this is not the time to panic.
It’s time to pause, think, and plan your next move 🧠💪
🎥 Watch the full video for my detailed breakdown and upcoming trade setups! 🚀
The bull run is over? My next tradeIn this space, you’ll find my long-term outlook on Bitcoin 🪙 — helping you see the bigger picture of what’s been happening in the market over the past week 📉📈
🔥 You’ll get insight into:
🔑 Key levels to watch for your trading or investing strategy
💡 The next profitable trade to position yourself for
🧭 A clear perspective on where Bitcoin could be headed next
Yes, we’ve seen a crazy drop 😱 — but this is not the time to panic.
It’s time to pause, think, and plan your next move 🧠💪
🎥 Watch the full video for my detailed breakdown and upcoming trade setups! 🚀

Hello Traders!! Hello Tradingviewers!! it's been a long time since i post anything on here and the only reason is because i been learning a lot more from this market... but long story short here we are bitcoin hitting ath and rejecting from it as usual , now i been wanting to share this chart since last week just because i just wanted to share my thoughts on the next moves for the bitcoin price... end of november im starting to turn into a bear!!

BTC: primed for a rebound After the massive sell-off on October 10, when Bitcoin dropped, the market is gradually catching its breath. The structure is shifting — sellers’ momentum is fading, and pressure at lower levels is becoming less aggressive. My system hasn’t given a confirmed entry yet, but the groundwork for a possible upward bounce is forming.
It’s interesting to see multiple indicators align — volatility is easing, RSI is exiting oversold territory, and buy volume is picking up on local dips. All of this suggests that larger players are beginning to accumulate positions in anticipation of a potential recovery.
Experience teaches that markets don’t reverse out of the blue — structure forms first. And when the analytical system spots the early signs of an impulse shift, it’s important not to rush but to wait for confirmation. I prefer to hold off until the technical picture fully aligns with the strategy’s logic. Patience and discipline are what separate a trader from a gambler.
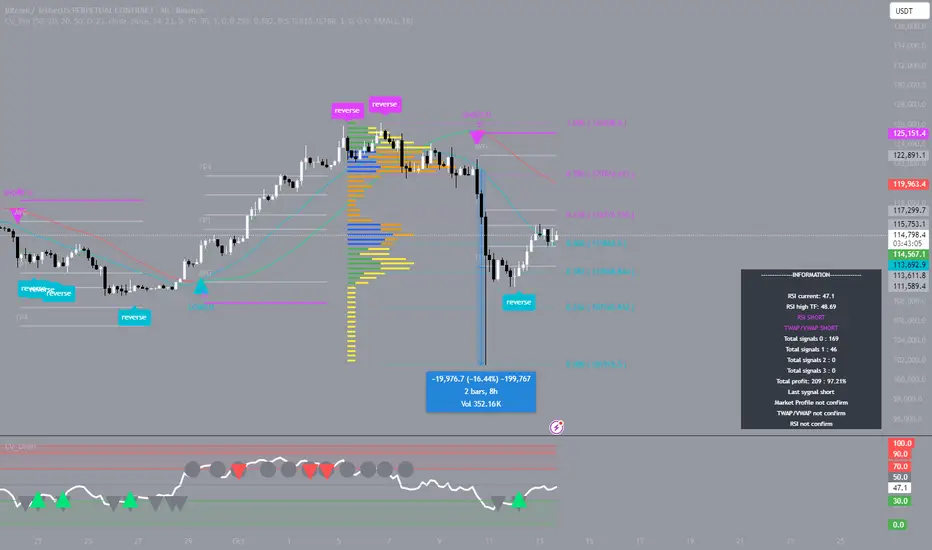
BTC: reversal pointOn October 10, the Bitcoin market entered its most turbulent phase in months — price plunged from $118,994.5 to $101,505.3, and total liquidations exceeded $20 billion. I didn’t take a position, just watched, because even before the drop the structure looked suspect: the impulse was overheated and the indicator clearly highlighted a risk zone.
It was a tough day for many traders. The wave of liquidations wiped out accounts even for seasoned participants — a reminder of how crucial it is to stay human and keep your composure.
What happened underscored once again: strength isn’t in trying to predict the market, but in reading its signals and recognizing structure ahead of time. Analytics and discipline are the only things that help you weather such storms without panic. My proprietary strategy reaffirmed that, and I’m grateful for it.
Wishing everyone successful trading.

Up onlyWe are at the light blue cross.
August 2020 after heavy deleverage, precious metals in ATH while Governments of the world are easing.
Dollar should fall a little more from here.
Tech and crypto will continue higher while commodities go up but underperform.
Cheers.

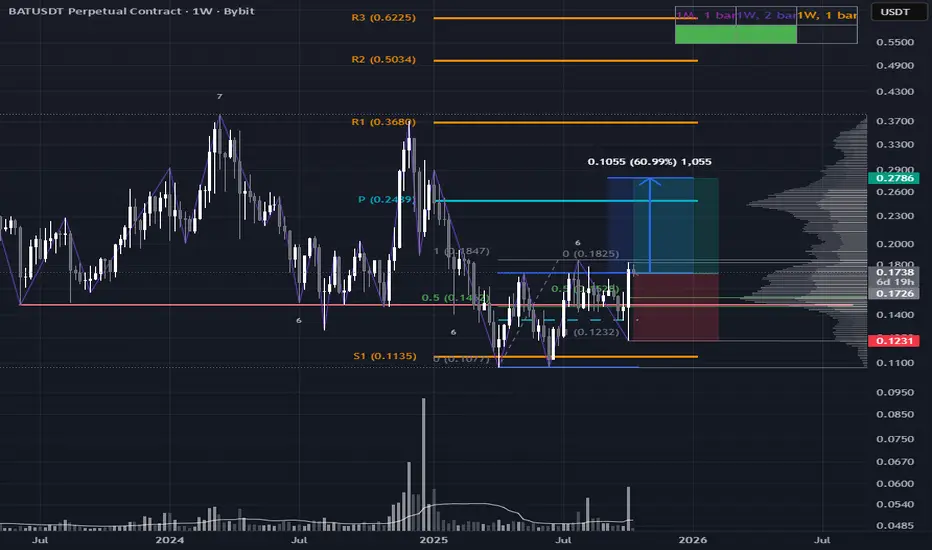
BAT Resilient Post-Liquidation: Swing Trade PotentialWhile most altcoins broke its range lows and printed fresh lows following the October 10th liquidation flush, BAT held its ground and gained! This is a very bullish signal.
The weekly candle closed strong on increased volume, signaling quiet accumulation beneath the surface. No need to overcomplicate: this setup speaks for itself.
Minimal range target: 0.2786
Stop loss options:
Simple: use the weekly swing low
Advanced: refine on the daily TF for tighter SL and improved R:R
This structure offers a clean swing setup with asymmetric potential.
#BTC and #ETH: key levels to watch in coming weeksBTC
The recovery pattern from the September lows still looks more like a medium-term correction rather than the completion of the broader bullish cycle.
As long as the price holds above the macro support zone at 108–102K and does not close below the 50-week moving average for more than two consecutive weeks, I consider the macro uptrend intact and expect the correction to conclude in Q4.
However, while Bitcoin remains below 118K, another wave of selling toward the 108K area in the coming weeks cannot be ruled out before a potential new leg higher.
Chart (taken on Oct 12):
Short-term resistance zone: 115.5–118K
Macro support zone: 108–102K
⸻
ETH
The price has moved deeper into the macro support area highlighted in earlier reviews and reached key weekly moving averages (20SMA and 21EMA), which have historically provided support to every major growth cycle.
On the daily timeframe, as long as the price remains above 3290, the main scenario remains bullish — with potential for new highs in Q4.
Ideally, I would like to see ETH hold the 3840–3700 zone during the current recovery attempt and form a constructive consolidation above the 21/50-day moving averages.
If assets maintain their macro support zones, I expect Ethereum could once again outperform Bitcoin in the next phase of the uptrend.
Chart:
Short-term resistance zone: 4180–4360 / 4550
Local support zone: 3960–3700
⸻
In light of the historic liquidation event we witnessed last week, I’d like to share a quote from one of the veteran traders and original Market Wizards — Peter Brandt:
"Greetings crypto traders whose Friday was not a cheerful day. I need to tell you that there will be better tomorrows. While the tunnel may seen dark, there can be bright days in front of you depending upon how you respond to your present circumstances.
...
Wealth - real wealth that is secure and lasting - does not come from "bet the farm" speculative bets. Real wealth comes from accepting investing as a marathon, not a sprint.
Real wealth comes from controlling risk, not from taking huge gambles. Real wealth comes in the accumulation in small pieces, gained, then protected.
I love that the younger generation to which you belong has taken an interest in speculative markets such as crypto and futures. Welcome.
This is the arena I have operated in now in the 6th different decade starting in the 1970s.
I wiped out several accounts in the early days. These are not fond memories. But I kept at it. For me I learned how to control my risk. What does that mean exactly?
Well, for me it means to limit my risk on any given bet to no more than 1% of my total pot. I know that sounds too tame to be meaningful, but if you do not want to go through what you experienced this past week, then perhaps it should be meaningful.
It also means that I do not bet any more than 3% of my entire trading capital on the composite of highly correlated bets.
I have noticed that some in the crypto space wear as a badge of honor that they can sit through 80% drawdowns. Well, that is NOT a badge of honor. It is a crown of shame. Anyone who thinks lightly of 80% drawdowns will end up rekt at the end of the game. If you doubt me, then stay on your present course and find out.
...
So, I encourage you. Take this past week as a serious lesson of investing and of life. Take ownership of your mistakes. Don't blame this past week on some "whale" or manipulator. Own it. And move forward having learned some valuable lesson "
⸻
Thank you for your attention!
In times of heightened volatility, please remember - protecting your emotional capital is just as important as protecting your financial one. Stay disciplined, patient, and kind to yourself through market turbulence - it’s part of every trader’s journey toward mastery.
Let’s leave the past behind, take the lessons it offered, and focus on the next trade with a clear vision and renewed confidence.
Wishing everyone a strong and productive start to the new week!

BTCUSDT.P - We are not probably out of the woods yetCRYPTOCAP:BTC Ideas to think of. Probably not out of the woods yet.
This on-going pump is very likely to be dead cat bounce and we might be heading some more downside.
Bull market over? Don't think so. I think we have better odds than former World Ski Jump Champion and Olympic Medalist Matti Nykaenen have said 'it's fifty sixty'.😄
Leave me your thoughts on the comments, would love to hear them to get more ideas on the table. Maybe I missed something?

Fear-Fueled Shakeout Sets the StageMassive liquidation shook the crypto space on Friday, October 10th with nearly $20B flushed out. But while the masses panicked, the charts show smart money buying.
LINK printed a textbook high-volume spring out of the range, signaling smart money absorption amid capitulation. The weekly candle closed deep into the range, reinforcing the idea that this wasn’t random volatility, it was structured accumulation and shakeout.
Volume on the Spring exceeded that of the Selling Climax (SC), which sets the stage for a potential retest. But don’t anchor to the $7.64 wick, that’s an anomaly. Instead, watch for price to revisit the EQ of that wick zone to form a higher low (HL) and validate the test.
This setup offers a compelling Risk-to-Reward profile. If the structure holds, a minimal very simple range target sits around ~$66. from here price could go much higher but one step at a time.
