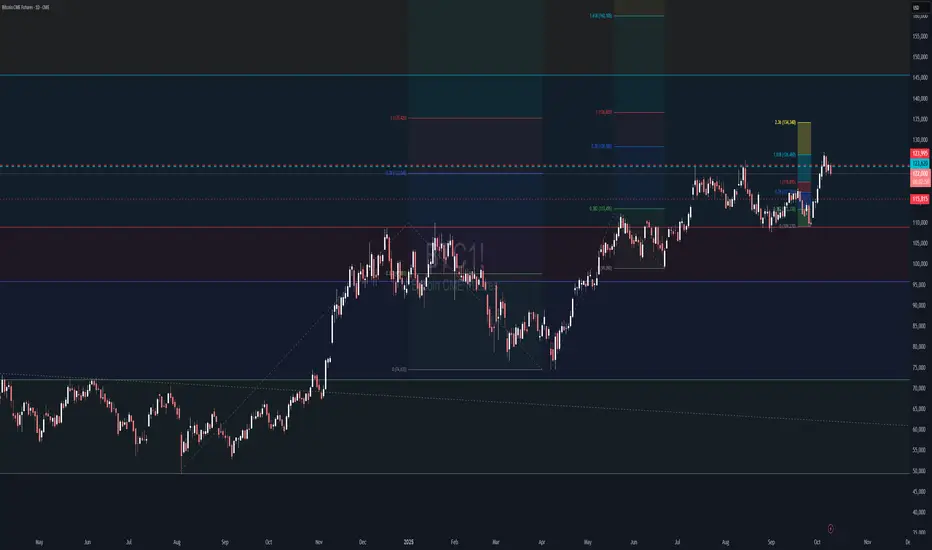
Why its bullishGrayscale's GBTC outflows, often perceived as selling, are actually bullish for Bitcoin's market cycle. These outflows reflect investors redeeming shares from a high-fee trust (GBTC) and rotating into lower-cost ETFs like BlackRock's IBIT, which has absorbed massive inflows (e.g., ~$900M on October 8, 2025). This shift represents smart money reallocating capital efficiently, not abandoning Bitcoin. Meanwhile, strong institutional buying—BlackRock holding 770K BTC and whales accumulating at dips—signals confidence in future price appreciation. Historically, such rotations have preceded rallies, as seen post-ETF launch in 2024 when Bitcoin surged ~150%. This dynamic suggests a healthy market, not a top, with capital flowing to stronger hands.
Contains IO script
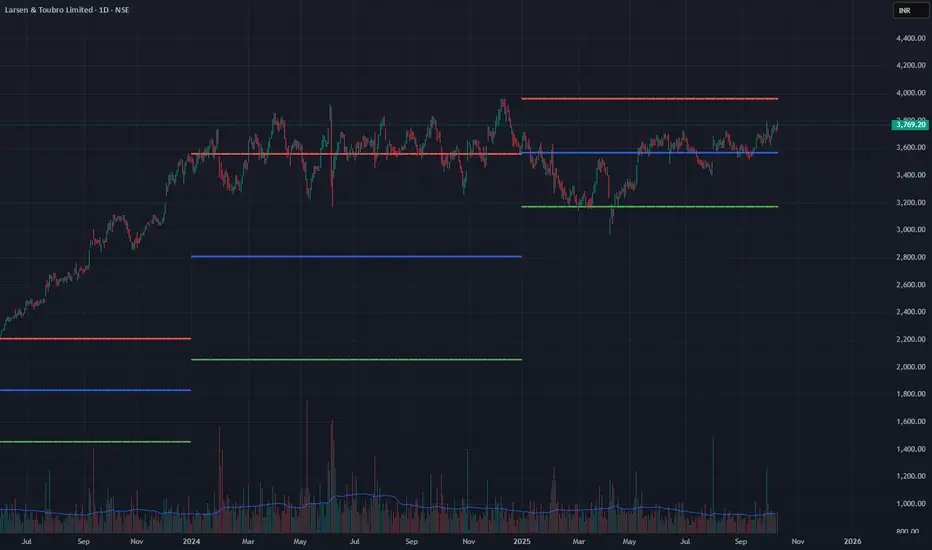
LT Stock having Price squeeze pattern.LT Stock is having a price squeeze pattern refering to the previous year high and low. Probablility of moving higher is high.
Canopy: LONGCanopy Market Cap: 400M
Risk Profile: Medium to High risk
Trading above the very important 21 Weekly MA
Broke the 200 daily MA just now at around 1.50
There is some overhead resistance (Red Striped Line) at 1.68
then previous top at 1.90
then, i expect to break it, going for the orange line at around 2.50
Last few days we have some nice pre market buying as well. Since August some nice uptick in volume as well!!
Think we can do a couple off X's from here.
Chart is 'cluttered' but important trend lines, Moving Averages and i drawn a cloud to test something.
Zoomed Out and less clutter:

Results from list of possible shorts posted Results from list of possible shorts posted. Using PAR, divergences and pivots.


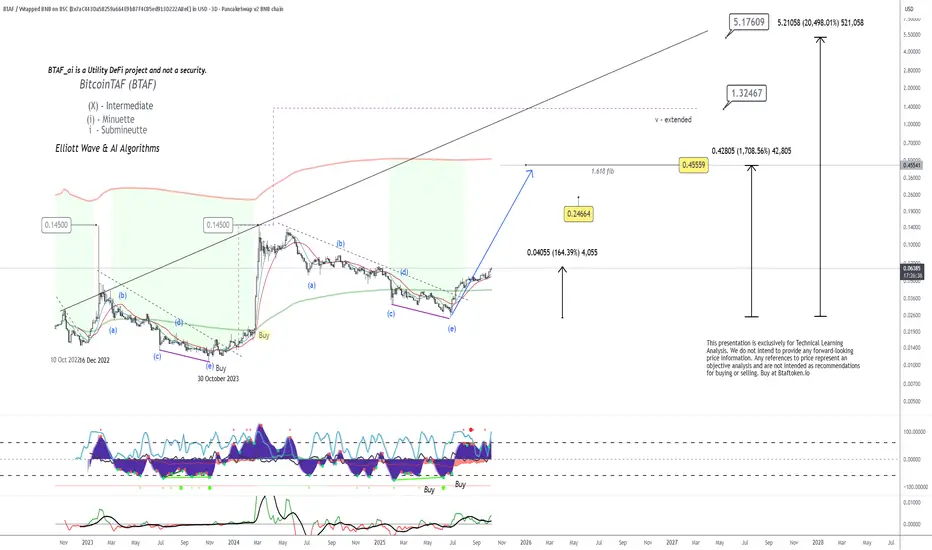
BTAF Token (BitcoinTAF) — Strong Technical StructureThe BTAF Token (BitcoinTAF) continues to demonstrate a robust technical recovery and structural strength on the BNB Smart Chain (BEP-20).
Recent Elliott Wave and AI Algorithm signals indicate that the token has completed its corrective cycle and is now transitioning into a new impulsive phase, supported by higher lows and a tightening accumulation pattern.
From a structural viewpoint, BTAF is entering a period of renewed momentum — a sign of improving sentiment, consistent community participation, and expanding token utility across BitcoinTAF.com’s DeFi ecosystem.
Elliott Wave & Algorithmic Outlook
The chart confirms a completed (a)–(b)–(c)–(d)–(e) correction, finalizing a long-term consolidation phase around 0.006–0.008 USD.
Multiple Buy signals were triggered near the October 2023 and mid-2025 levels, suggesting strong algorithmic confirmation from the BTAF AI model.
The following potential Fibonacci expansion levels highlight resistance zones near 0.04055, 0.24664, and 0.45559, marking stages where BTAF could pause for re-accumulation before continuing its longer-term trajectory.
The extended projection, based on the 1.618 and 4.618 Fibonacci ratios, places future momentum targets at approximately 1.32 USD and 5.17 USD, aligning with the anticipated growth curve of DeFi adoption.
Market Context & Ecosystem Strength
BTAF is not a speculative meme token — it represents the utility backbone of the BitcoinTAF.com ecosystem, powering education, staking, affiliate programs, and tokenized DeFi incentives.
As BitcoinTAF expands into AI-driven analytics and decentralized training products, BTAF’s core function as a utility token continues to strengthen, creating organic demand through real-world application.
The project also benefits from a deflationary design, transparent smart contract auditing, and a strong global user base, which supports long-term network sustainability.
Technical Summary
Trend: Uptrend forming after multi-phase consolidation.
Momentum: Strong “Buy” confirmation on the DTM Detonator indicator.
Key Structural Support: 0.006–0.010 USD range.
Potential Growth Zones: 0.04 → 0.24 → 0.45 → 1.32 → 5.17 (progressive Fibonacci expansions).
Outlook: Continued positive momentum as part of a larger Elliott Wave expansion cycle.
Conclusion
While this analysis is not financial advice, the technical and structural outlook for BTAF Token remains strongly positive.
The token continues to build long-term momentum, supported by recurring algorithmic buy signals and growing utility within the BitcoinTAF.com ecosystem.
As adoption increases and DeFi participation expands, BTAF stands out as a technically sound and fundamentally active project worth monitoring closely in the months and years ahead.
Have a great day!
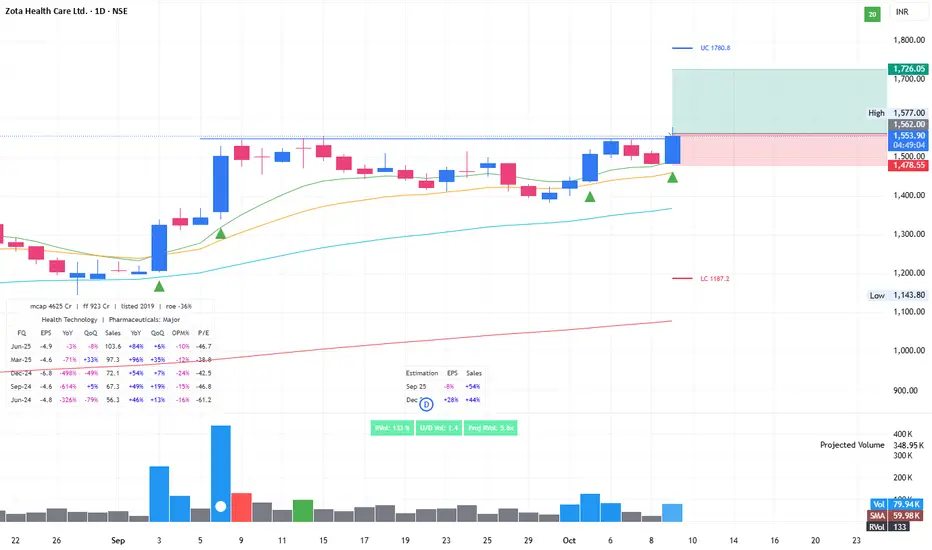
Probable swing possibilityNSE:ZOTA in uptrend. Creating tight range. Breakout above 1565 could lead to good return in short term
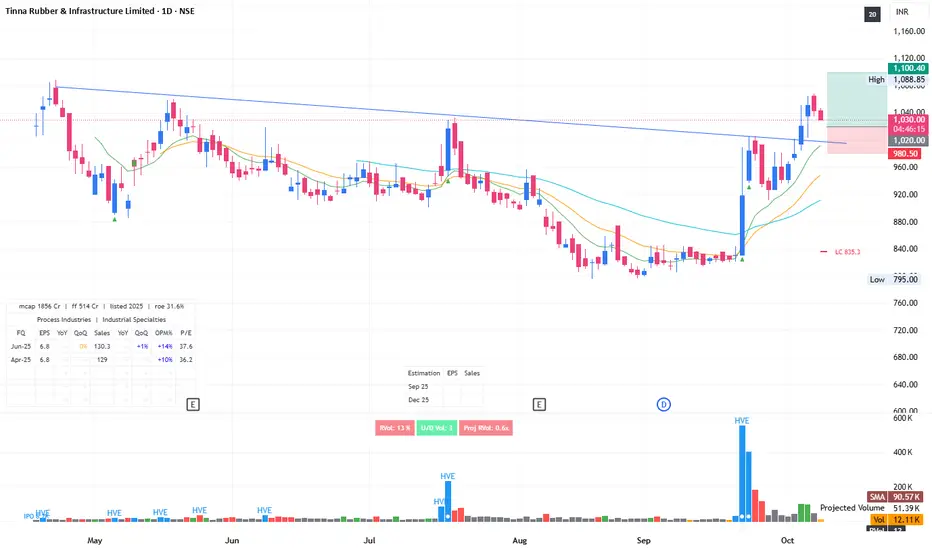
IPO base breakout - retestThis stock follows IPO breakout strategy. Currently retesting with very light volume. One can look at adding in range of 1020 - 1030 and over the couple of months, this could give good returns.
Follow string 5% SL rule from your buy price.
A look at the longs posted from today's list of potential longsA look at the longs posted from today's list of potential longs using PAR and divergences

META| 720 Breakout Setup- Gamma MORE!Price Consolidating just below 719-720- a key volume shelf and gamma pivot. A clean breakout with volume could trigger a dealer hedge-driven squeeze into 740-750 as gamma flips positive in the coming days or weeks.
74% bullish call flow today hints at an early momentum shift- watching the EMA cloud to flatten for added confluence.

A relatively Clear & Simple Bitcoin trading strategyRecently, I've noticed something. Something so simple that anyone with a simple EMA indicator can use, to achieve relatively clear, simple signals for BUYING & SELLING (or shorting) Bitcoin. Go ahead and backtest it to see what I mean.
Nearly everytime BTC crosses and closes above the EMA 33 line on the 6-hour chart Bitcoin goes much higher. And the opposite is also an effective SELL signal, as well. Go ahead and test it, I'll wait...
If Bitcoin does one of those sideways movements for a few weeks, just wait for the next clear signal instead of constantly buying and selling each time it crosses the EMA 33. It'll eventually separate and gain distance from the EMA and will start to be a clear signal again. Comments and Critics are welcome but be polite!

TON: rise from $3.13On September 9, TON printed an upward reversal on the 4H around $3.1354. The move unfolded step by step: price cleanly passed two take-profit zones and reached $3.2644, delivering about $0.13 per coin. With 10x leverage, the move looked especially compelling — the potential was there, though not everyone could hold it to the end.
I managed the trade by system — no guessing, no emotions. The tool consistently highlighted fixation zones, helping me ignore noise during pullbacks. When market structure is visual, holding the position gets easier — decisions rest on facts, not fear.
Fact: on TradingView many standard indicators rely on smoothed data and can lag 1–3 candles without trend or volume context. In my case, the win rate on TON stays above 85%, a natural result of a systematic approach.
Moves like this remind me: the market rewards those who follow a plan, not those who try to predict it. When discipline becomes part of the strategy, even volatility stops being scary.

A look at the longs posted from today's list of potential longs A look at the longs posted from today's list of potential longs using PAR

SUSDT.P - Sonic / FTM / Fantom trading planBINANCE:SUSDT.P Sonic/FTM/Fantom
This looks very delicious. If it doesn't fly from here I expect pullback to 8H FVG below and taking a nice swing breakout from there.
I don't see any other inefficiensies in the past chart than that FVG.

SOL: level by levelOn Sept 26, 1H SOL, I entered long at 199.37. Price hit all four targets: 201.73, 203.33, 205.26, 207.87 and eventually printed a peak at 237.68. Watching it run further stings, but that’s no reason to break the plan. Traded with 10x leverage: level map, scenarios, risk control — all in place.
My strategy keeps SOL’s 1H win rate above 85% — it’s about consistency, not guessing.
Yes, the move from 199.37 to 237.68 teases that fear of missing out. But when structure leads you through levels, emotions fade. I end up with repeatability over randomness: planned entry, calm management, level-based exits. Next setup — same rules.
We do not enter trades against the trend, even if we receive a clear signal to do so.
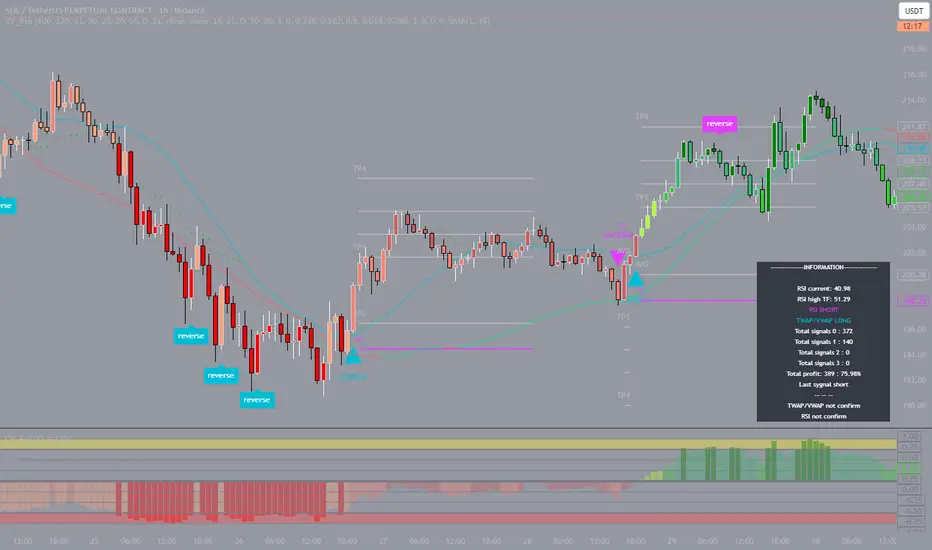
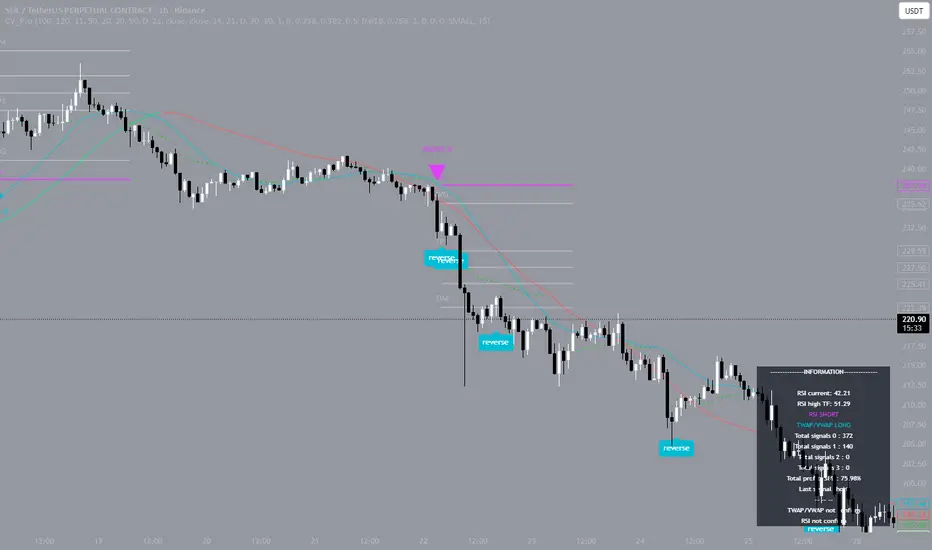
SOL: move down from $232On September 22, Solana turned into a clear downtrend on the 1H timeframe, starting from the $232.12 area. Price sequentially passed all four take-profit levels: $229.68, $227.66, $225.50, and $222.52, then printed a low at $190.78. The move offered over $40 per coin in potential, amplified by careful use of 5x leverage.
The trade was managed step by step: levels were mapped in advance, “take/hold” scenarios were defined, and decisions followed market structure. This removes haste and emotions—leaving only plan execution.
Observation: the win rate on SOL in the current market regime on 1H is notably above average - thanks to trend filtering and risk management. It’s not about guessing; it’s about math: volatility becomes measurable metrics, and metrics translate into consistent actions.
When discipline and structure are built into the process, trading stops being chaotic. Results become a function of consistency, not luck.
Wed Oct 8 quick short on STO using PAR Wed Oct 8 quick short on STO using PAR ....Wait on 5 min minimum for confirmation of turn

SOL Chaser?🧩 Every candle is another clue in the ever-changing puzzle.
🔥 CRYPTOCAP:SOL continues to ride hot narratives—first memecoins, now tokenized stocks. Momentum never sleeps.
💵 SOL/USD:
Flipped key resistance into support.
March 2024 ATH at $210 now acting as a floor, with a retest on the horizon.
Current resistance sits near $228.
📌 Game Plan:
No adds yet. Waiting for that $200–$195 demand zone, a cluster of swing highs, swing lows, and weekly closes. That’s where the real decision point lies.
🚨 Until then, patience. The next big move will be built on these levels.

BTCUSDT.P 1H update about the dip - expecting more downsideCRYPTOCAP:BTC update. Super convinced that more pullback is coded.
We get confirmation soon in few hours if 4H or 8H FVGs acts as resistance. Expecting more likely to make another sweep in to 8H FVG below.
We are talking a very small dip but it will again destroy and shake most of the ALTS positions. Again and again. I can't keep up the count for the last 2 months.
For degens, this is good buy the dip opportunity. Too risky for me. Stay SAFU!

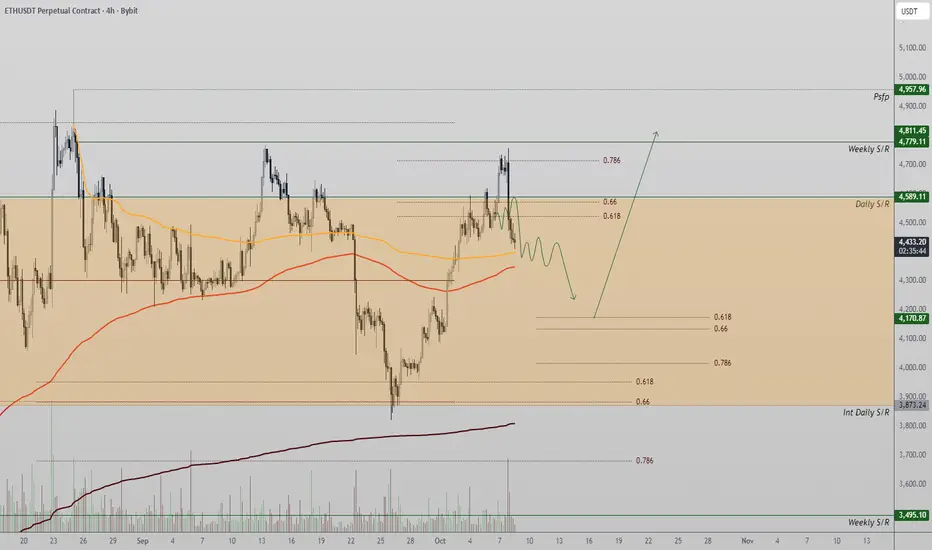
Ethereum Maintains Bullish Structure Despite Range Re-entryEthereum re-entered its prior trading range after a failed breakout above $4,589. Despite the retracement, market structure remains bullish, with a potential higher-low formation developing near the 0.618 Fibonacci zone.
Ethereum’s recent failure to sustain momentum above the $4,589 resistance led to a quick re-acceptance back into its prior range. This type of “failed auction” pattern often triggers short-term corrections, allowing the market to rebalance and find fresh demand at lower levels. However, despite the rejection, the broader uptrend remains intact, supported by higher highs and higher lows on both the daily and weekly timeframes.
The area between $4,250 and $4,300 represents a critical support zone — aligning with the 0.618 Fibonacci retracement level. Historically, ETH has treated this level as a springboard for continuation moves during trending conditions. A controlled pullback into this region would likely attract dip buyers, reinforcing the macro bullish narrative. Furthermore, on-chain metrics show steady network activity and staking participation, which supports long-term accumulation.
Should ETH reclaim the $4,589 zone, bullish continuation toward $4,950–$5,000 becomes likely. Conversely, if the 0.618 level fails to hold, a deeper retracement into $4,050 could occur before recovery.
What to Expect:
Ethereum remains bullish overall, with the current dip seen as corrective. A confirmed higher low at the Fibonacci zone would reaffirm momentum toward $5,000 resistance in the sessions ahead.
Aster (ASTR) Holds Equilibrium, Eyes Expansion Toward $2.90Aster continues to display strong market structure as it trades within equilibrium after a controlled retracement. Technical confluence at the 0.618 Fibonacci level supports a bullish breakout scenario targeting $2.90.
After weeks of steady trending behavior, Aster entered a consolidation phase that has evolved into a symmetrical equilibrium structure. Price corrected neatly into the point of control and aligned perfectly with the 0.618 Fibonacci retracement level — a zone often associated with bullish continuation setups. This confluence suggests that the current pause is a healthy correction rather than the start of a larger reversal.
Volume and order flow data reveal consistent absorption at the lower boundary of the pennant formation, indicating that buyers remain active and confident in defending this region.
The longer price consolidates within this value area, the higher the probability of an explosive expansion move once breakout confirmation occurs. A clean break above the equilibrium resistance would open a path toward the next key liquidity cluster around $2.90, which coincides with the previous channel high.
In contrast, failure to hold above $2.40 could delay bullish continuation but would not invalidate the structure entirely, as the macro higher-low formation remains intact.
What to Expect:
As ASTR continues to compress within equilibrium, traders should monitor volume spikes and candle body expansion as early signs of breakout validation toward $2.90 in the immediate short term.

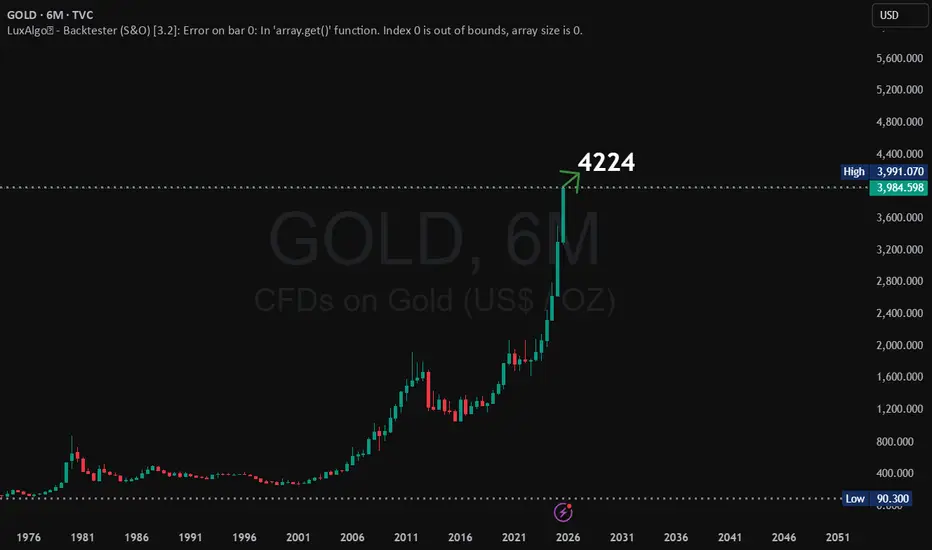
GOLD📈 GOLD 6M Analysis
Gold has touched the historical level of $3986 🚀
Next possible target 👉 $4224
💡 Long-term chart indicates bullish momentum is still strong.
⚠️ Disclaimer (As per SEBI mandate):
This content is for educational and informational purposes only. It should not be considered as investment advice, recommendation, or a buy/sell signal. Please consult your financial advisor before making any investment decisions.
#Gold #XAUUSD #Commodity #Trading #Analysis
Trades for today Tuesday 10/7 B2 shortTrades for today Tuesday 10/7 B2 short using PAR, divergences and a Demark Quarterly Pivot
