Coppershort

Copper Futures W1 Short Play Setup - DIVCopper has been on a rally, but shows divergence on W1 chart
Needs a strong shakeout before longer rally.
-Still bullish long-term

Short Copper @ 3.3125; TP @ 3.2463, SL your choiceShort Copper @ 3.3125; TP @ 3.2463, SL your choice

Copper Short CallingGiven that copper prices have climbed to an almost all time high as well as the past positive and negative correlations, a long is still profitable. However, a short where you buy and sell until 1st quarter of 2018 has a much better potential for gains. Also looking at the bollinger bands, this is still profitable but not as profitable as other things you could invest in. This is more of an overall conservative strategy to make some returns but not ones that are significant.

Interesting level on copper - inflection pointLooking to trade OANDA:XCUUSD - if it breaks cleanly below the yellow line - will be shorting

Copper breaks 20-DMA, bias lower, stay short below 50-DMACopper slips below daily Ichimoku cloud, intraday bias bearish.
Price action has broken below 20-DMA at 3.1064 and is currently holding above 50-DMA at 3.0804.
Technical indicators are turning bearish. Stochs are on the verge of a rollover from ovebought levels.
RSI has taken a turn lower, is now biased south and has slipped below 50 levels.
We see strong support at 50-DMA at 3.0802, break below to see further weakness.
Support levels - 3.0802 (50-DMA), 3.0632 (cloud base), 3.05 (trendline)
Resistance levels - 3.1059 (20-DMA), 3.1142 (cloud top), 3.1345 (5-DMA)
Good to go short on break below 50-DMA at 3.08, SL: 3.10, TP: 3.060/ 3.050/ 3.030.

Copper holds 50-DMA support, short break belowCopper is trading largely unchanged on the day, retraces from lows of 3.065.
Price action has taken support at 50-DMA at 3.067, we expect weakness to resume on break below.
We notice Doji formation at lows on daily charts which calls for caution.
Technical studies however support downside in the pair and we would recommend short position below 50-DMA.
Technical indicators on weekly charts have also turned bearish, Stochs and RSI have rolled over from overbought levels and biased lower.
Break below 50-DMA raises scope for test of 100-DMA at 2.9422. Bearish invalidation on break above 20-DMA at 3.1487.
Support levels - 3.067 (50-DMA), 3.010 (Oct 9 low), 2.9422 (100-DMA)
Resistance levels - 3.115 (5-DMA), 3.149 (20-DMA), 3.182 (Nov 1 high)
Short break below 50-DMA, SL: 3.120, TP: 3.010/ 2.940

Short Copper @ 2.8285; TP @ 2.7719, SL your choiceShort Copper @ 2.8285; TP @ 2.7719, SL your choice
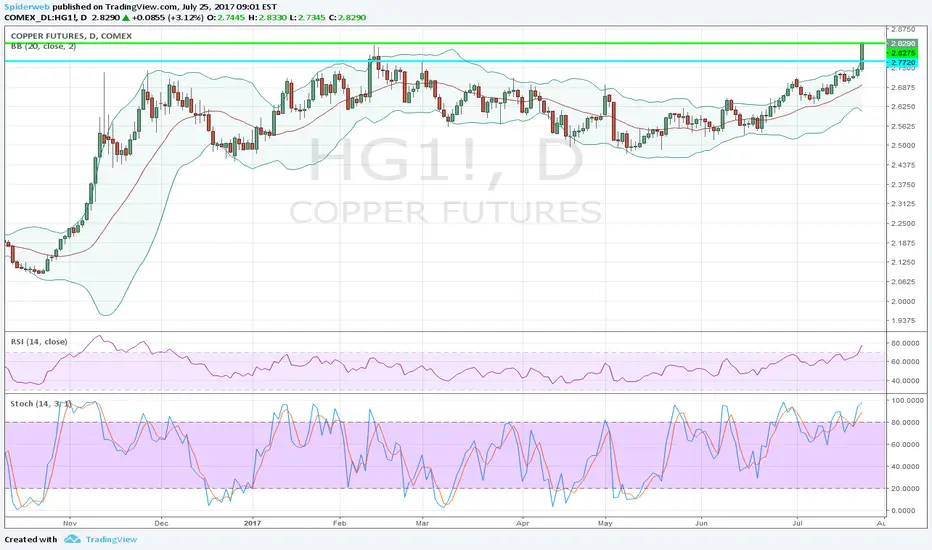
COPPER - Bearish Crab Pattern CompletedBearish price action seen, price respecting PRZ.
RSI at overbought level, good to short anytime.
Aim for 38.2% and 61.8 fib levels.

COPPER ANALYSIS - 4H CHARTHey there!
So my mate @Joshua_nate and I have been checking on this one. We are expecting reversal soon for a C wave in Daily Timeframe. Just watch for the brakeout and then sell!
-
Hola a todos,
Mi socio @Joshua_nate y yo hemos estado viendo este caso. Esperamos una reversión para realizar una onda C en temporalidad diaria. Simplemente buscad el brakeout para la venta.
Carlos

SMALLL LONG AND BIG SHORT ON XCUUSD - (LONG TERM SHORT TRADE)See my play on words? If not don't worry.
As we can see, there is a strong bullish movement.
Nice impulse formation 12345, with a good chance of extended 5th wave back to top resistance in channel.
Keep an eye for a reversal at that point. Could be a long way down!
Timeframe: 4H Chart
Duration: 70 Days

Copper finds strong support at 2.675, good to short break belowCopper edges lower from fresh 3-month highs at 2.717.
The pair finds strong support at 2.675 (converged 5-DMA and trendline), weakness only on break below.
Technical studies are bearish on 4 Hour charts, RSI and Stochs have rolled over from overbought levels and MACD is showing a bearish crossover on signal line.
Break below 2.675 could see drag till 2.634 (1H 200-SMA).
On the flipside, break above 2.717 required for further upside. 2.737 (Feb 1st high) is next bull target.
Support levels - 2.675 (converged 5-DMA and trendline), 2.655 (June 29 low), 2.634 (1H 200-SMA)
Resistance levels - 2.70 (1H 20-SMA), 2.717 (June 30 high), 2.737 (Feb 1st high)
Good to go short on break below 2.675, SL: 2.70, TP: 2.655/ 2.634

Copper Lower Again for a good buying chance?Hey guys,
We expect the market to make one leg lower to around 2.445, BUT only when the market stays below the high 2.70. When this level breaks we will be looking at a move higher to around at 2.776. Our intermarket indication supports our idea of facing south. Critical zone will be the lower range of 2.58! Around 2.444 will be a good buying chance IF market reaches that level. Let's see!
Hope that helps.
Cheers

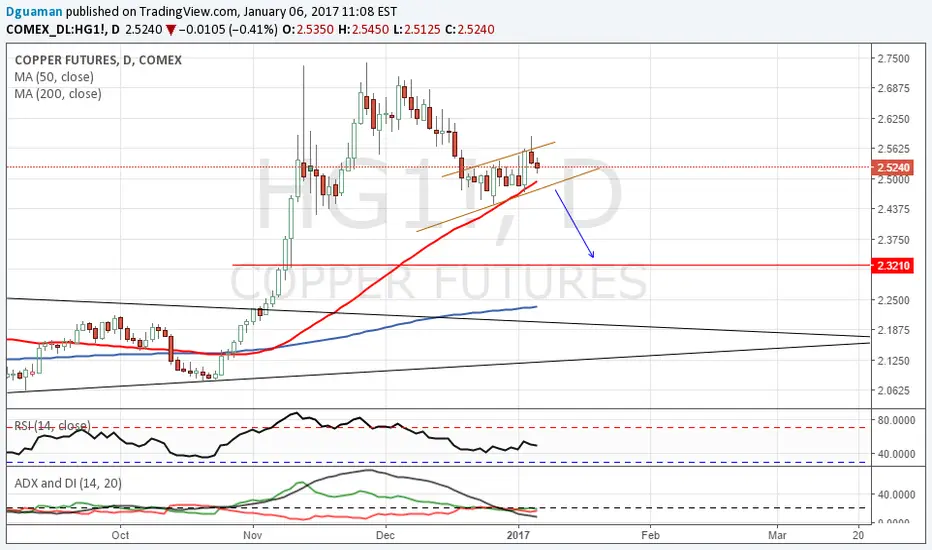
Potential Breakdown in Copper FuturesCopper Futures are flirting with their support level at 2.5775, so today I'm watching to see if they break that support line, and more importantly, I will look to see what happens Thursday to see if there is confirmation of the trend.
We could just as easily see Copper fall below the support line, just to bounce right back up on a false breakdown. That's why I prefer to wait a day after the initial breakdown.
In terms of risk - reward, this isn't the best play as of right now. You're looking at 1.69:1 ratio, however, that does include a smaller target profit right at the 200 MA. I would begin to take profits at this range, bring my stops in tighter, and extend my profit target zones to the 2.26 zone, which presents next support level.
All the best,
Brandon

INTERMARKET | Copper Suggests Short CATThe normalised chart of Copper (white) vs CAT (orange) would indicate a CAT short is a reasonable equity trade here...

TECHNICALS | Copper's Up-Trend BrokenWhilst diagonal trendlines are geometrically certain to break, they are also rather difficult to trade, looking very obvious ex-post, but hard to pull the trigger on ex-ante. In this case, I am inclined to take the signal given I have traded the vicissitudes of Copper quite well, particularly in the past 6 months.


Copper, another leg up?Copper broke the range it was trapped in on Friday, and I've been long via IVN.TO for roughly a month now.
I'll be buying any dips or retests of the previous range.
As soon as we touch sub 4.50 for IVN i'll be buying.
-Healthy RSI, MACD crossing up on the 1D.


Copper, Double Top Formation and PBOC; Bearish ConfluenceThis probably double top formation alongside PBOC tightening, signals a bearish correction to come.
Good luck,
Ali Sharifazadeh, CFTe


Copper ! Short the pullback !Wait for a sell setup on the yellow zone and go short till 2.32
Regards,
;D
