COPPER Two year Triangle may finally break.Copper (XCUUSD) is trading within a Triangle pattern since the March 07 2022 High. The price is currently above the 1D MA200 (orange trend-line), supported twice by the 1D MA50 (blue trend-line). The 1D RSI shows that we may be replicating the July 15 - September 20 2022 fractal.
If the price breaks above the top (Lower Highs trend-line) of the Triangle, then based on the fractal should target initially the 1.5 Fibonacci extension level at 4.1800.
As long as it closes below the Lower Highs, we will sell and target the 3.6870 Support.
-------------------------------------------------------------------------------
** Please LIKE 👍, FOLLOW ✅, SHARE 🙌 and COMMENT ✍ if you enjoy this idea! Also share your ideas and charts in the comments section below! **
-------------------------------------------------------------------------------
💸💸💸💸💸💸
👇 👇 👇 👇 👇 👇
Coppersignals

COPPER looks doomed on the long-term. Sell the rallies.Copper (HG1!) on the 1W time-frame appears to be repeating the previous major Bear Cycle that started in 2011/12. Based on this fractal analysis, the recent 1W rejection just below the 1W MA50 (blue trend-line) puts us at a proportionate level as on the February 06 2012 1W candle. Having rebounded on the 1W MA100 (green trend-line) both on the July 11 and September 26 candles, we expect initially to reach it again and then rebound to make a Lower High and form a trend-line similar to that of 2012 - 2014 that made structured Highs to sell that took Copper to the 2.000 - 1.9360 Support Zone.
This long-term bearish pattern will get invalidated if the price breaks above the 0.618 Fibonacci extension, which was where (slightly below) the price was rejected on the February 06 2012 1W candle.
-------------------------------------------------------------------------------
** Please LIKE 👍, SUBSCRIBE ✅, SHARE 🙌 and COMMENT ✍ if you enjoy this idea! Also share your ideas and charts in the comments section below! This is best way to keep it relevant, support me, keep the content here free and allow the idea to reach as many people as possible. **
-------------------------------------------------------------------------------
You may also TELL ME 🙋♀️🙋♂️ in the comments section which symbol you want me to analyze next and on which time-frame. The one with the most posts will be published tomorrow! 👏🎁
-------------------------------------------------------------------------------
👇 👇 👇 👇 👇 👇
💸💸💸💸💸💸
👇 👇 👇 👇 👇 👇

COBRE , COPPER This analysis allows us to see the two scenarios of buying and selling, as well as the need to wait for a confirmation in shorter time frames in order to enter the market confirmed.

Copper analysis and ideas: Will bears come back?Copper prices may remain under pressure in the coming months due to investors' apprehension about China's growth prospects in the wake of the 20th National Congress of the Chinese Communist Party, which disappointed the market.
Since September, copper prices have fluctuated within a relatively narrow range (3.2-3.6) after the earlier sharp declines occurred this year.
The long-term case for copper remains strong, as it is a key metal for the energy transition and global inventories are currently very low.
However, one of the main challenges it faces in the near future is its dependence on China’s economic growth.
The brown metal will remain under pressure unless China announces new growth-friendly economic policies to counteract the predicted slowdown in the country’s economy. However, the latest China Party Congress appears to prefer fostering sustainable growth and giving more importance to inequality, national security, and ideological matters.
Copper bull markets have historically coincided with periods of extraordinary global growth, driven primarily by China.
We have now reached a crossroads in that regard, and if China is unable to maintain high and consistent economic growth, copper will have to wait for a new global wave of coordinated investments toward the development of renewables and green energy. However, given the issues with inflation and rising interest rates that we are currently facing, it may still be years before the transition fully takes hold on a global scale. This could take the price of copper subdued for longer.
When we look at the daily chart, we can see that some bearish pressure was forming near the 78.6% Fibonacci retracement level of the 2022 range. Also the 50-day moving average has been a quite strong dynamic resistance later. The technical picture remains overall on the bearish foot, and copper needs to clear the 2022 trendline at around $3.75 and then cross the psychological $4.00 mark before materially inverting the downtrend.

Copper analysis: Has the bear market rally ended already?After a 37% decline from its peak of $5.03 per pound in early-March 2022, copper has risen 14% since July's lows.
However, the metal has recently been unable to overcome key resistance levels represented by the 50-day moving average and the descending channel trendline, as fresh worries about global growth slowdown and monetary policy tightening reemerged this week.
Key macro events of the week:
China, the world's largest consumer of copper, unexpectedly lowered lending rates in an effort to boost demand after reporting weaker-than-anticipated July numbers for industrial production (3.8% vs 4.6% expected), fixed asset investments (5.7% vs 6.2%), and retail sales (2.7% vs 5%).
In the United States, the New York Empire State Manufacturing Index plunged to -31.3 in August of 2022, from 11.2 in July. This is the lowest reading since May of 2020, and it indicates that business activity is weakening as a result of a collapse in new orders and shipments.
Germany's ZEW economic sentiment index has fallen to its lowest level since October 2008, and the UK inflation rate has risen to double digits, the highest in 40 years, adding fuel to the fire and reigniting fears of a global recession.
Ultimately, the Minutes of the FOMC's July meeting revealed that there is still a long way to go before declaring the war on inflation won, with members indicating that adopting a more restrictive policy stance was critical to avoiding a worsening of inflation expectations. This implies that the Fed's tightening is far from over.
Copper technical analysis
A bear market rally that is nearing exhaustion can be seen on the copper daily chart. The price action this week has been unable to break above both the bearish channel and the 50-dma, the RSI has tilted to the downside, and the MACD is getting close to a bearish crossover.
A similar pattern occurred earlier this year, in the first week of June.
After a 14% rebound from May's lows, copper briefly surpassed the 50-day moving average before beginning a severe, steep decline that lasted until mid-July. The RSI and MACD indicators both showed similar patterns to what we are seeing now.
Bottom line, a copper's short-term pullback to the bearish channel's midline in the $3.2-3.3 area seems more likely, given the current technical setup. Breaking decisively the 50-dma and bearish channel resistances would invalidate the thesis and raise the odds of a $4.00 per pound test.
Idea written by Piero Cingari, forex and commodity analyst at Capital.com

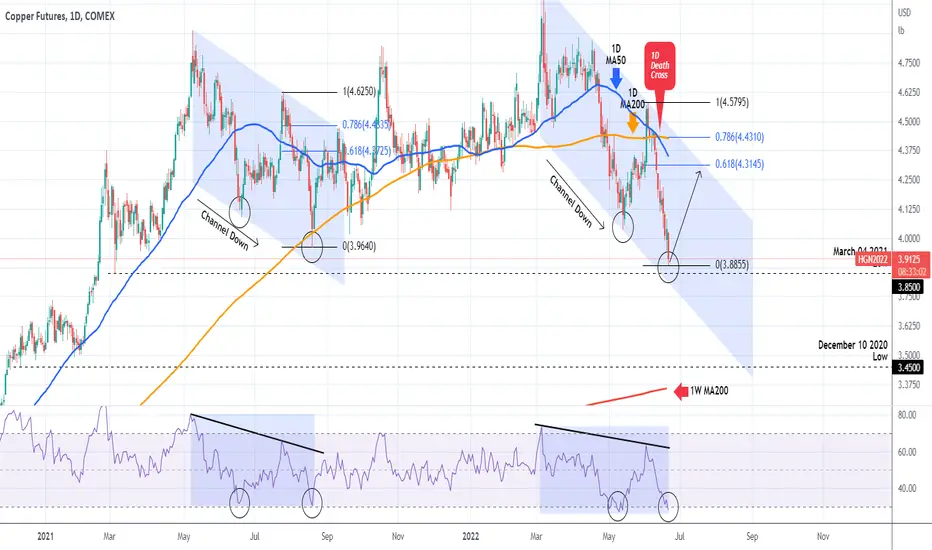
COPPER High probability for a reboundCOPPER (HG1!) has been trading within a Channel Down ever since the March 07 High caused of the Russia - Ukraine war escalation. Right now the price isn't just approaching the Channel's Lower Lows trend-line (bottom) but also the March 04 2021 Low of 3.8500. With the RSI dropping below the oversold 30.00 barrier on the 1D time-frame and making a Double Bottom. the market may soon reverse towards the Channel's top again.
The last time we saw all these parameters aligned in the same order was during the May - August 2021 Channel Down, where the price after the RSI Double Bottom on the 30.00 mark, it rebounded above the 0.618 Fibonacci to the top (Lower Highs trend-line) of the Channel.
Our strategy is to initially settle for a short-term target just below the 0.618 Fib extension at 4.3000 and then re-evaluate as a break above the 1D MA200 (orange trend-line) is most likely needed in order to reverse the trend completely.
If on the other hand 3.8100 breaks, we expect a sharp sell-off towards the 3.4500 Low of December 10 2020, where the price can also make contact with the 1W MA200 (red trend-line).
--------------------------------------------------------------------------------------------------------
Please like, subscribe and share your ideas and charts with the community!
--------------------------------------------------------------------------------------------------------
XCUUSD Slips below Weekly CloudCopper opens the week on a bearish note, slips below 110-week EMA
Technical indicators are biased lower. Stochs and RSI show bearish momentum.

Coppe (Comex) - Weekly UpdateComex Copper - Weekly
Bottom Line : Adjusted wave count: Comex Copper may complete a flat correction by rising to a new high.
Comex Copper may be rising in wave (C) of a flat correction developing as wave X (circled) of an ongoing bear market from 2011.

COPPER Hrly Short | algo tradingCopper hrly short
shortstop @ 4.4788
TP #1 @ 4.4541 75% wr
TP #2 @ 4.4271 50% wr
SL @ swing high 4.5395 17.50% hr
WR and HR determined from past trades on this metal
More trades like this on my profile and on Bifrost Trades.

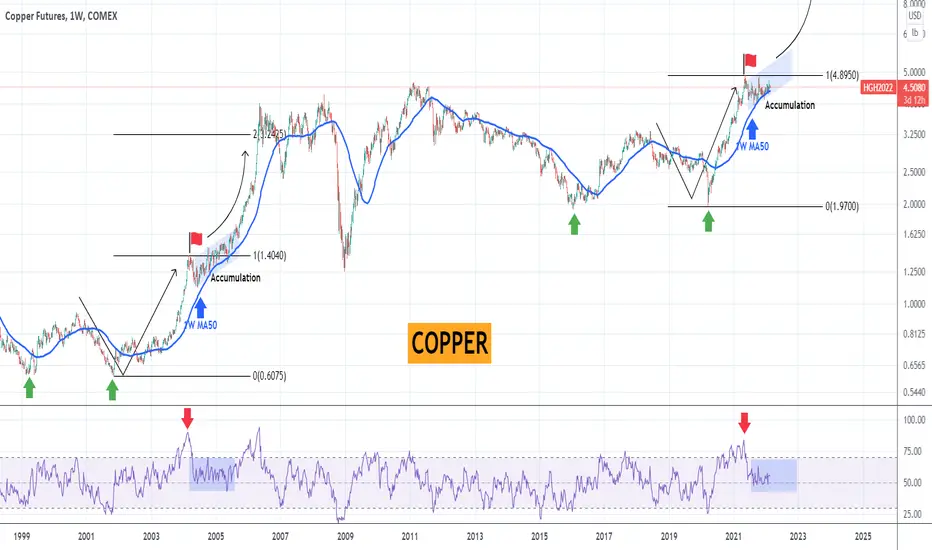
COPPER is one of the best investments on a 2 year basisInvestors looking for value long-term better have a look at Copper, which has been consolidating ever since its May 2021 All Time High (ATH). The 1W MA50 (blue trend-line) has been supporting all this time, indicating that the market has found a new long-term demand zone where buyers step in.
The last time a similar demand level on the 1W MA50 took place was half-way through Copper's historic parabolic rally of the 2000s. In particular, in February 2004, the market made a similar High (red flag), then turned sideways into a +1 year accumulation period, when again the 1W MA50 was supporting. Eventually that demand level initiated the last and more aggressive part of this rally during 2005-2006. The 1W RSI sequences between the accumulation phases of today and 2004 are also identical.
The 2006 rally peaked a little higher than the 2.0 Fibonacci extension. That should be a solid benchmark for long-term investors looking for value.
--------------------------------------------------------------------------------------------------------
** Please support this idea with your likes and comments, it is the best way to keep it relevant and support me. **
--------------------------------------------------------------------------------------------------------
copper is about to break the high ...... hold for target 810....copper is about to break out ... hold for bullish move . next good move

Copper MCX chart indicates strong bull run about to startCopper is managed to bounce from 750 level and in last trading session give strong recover from bottom.
On daily time frame made a bullish pin candle near resistance zone.
Breaking above 760 will trigger strong buying and target will be 770 to 775.

Copper Short SetupCOPPER Short Setup
🔵 Entry Level: $ $4.2785
🟢 Take Profit: $ $4.2085
⛔ Stop Loss: $ $4.3050

COPPER Buy signalPattern: Channel Up on 1D.
Signal: Buy as the price is rebounding on the Higher Lows (bottom) trend-line of the Channel Up while the MACD just formed a Bullish Cross.
Target: 4.980 (the 1.236 Fibonacci extension).
--------------------------------------------------------------------------------------------------------
** Please support this idea with your likes and comments, it is the best way to keep it relevant and support me. **
--------------------------------------------------------------------------------------------------------

COPPER best time to buy now. 2 year rally ahead.This is COPPER on the 1W time-frame. I've made this idea to show to long-term investors why the metal is currently on the most optimal buy levels ahead of a two-year rally.
As you see, the price has been rising since the August pull-back. Not only is it posting a recovery but the August low happened almost on the 1W MA50 (blue trend-line), which has been the markets major Support since the June 2020 bullish break-out.
The pattern bears strong resemblance with the 2004 fractal. As you see both Cycles made a Double Bottom, which initiated the rally, a 1W Golden Cross was formed along the way and when the price hit the Resistance of the previous Cycle High, it made the first substantial correction/ pull-back. In both cases, the 1W MA50 held and then a 1 year Channel Up followed supported by the 1W MA50, which eventually paved the way for the final parabolic rally. The RSI sequences are also quite similar.
It is obvious the Copper is replicating the previous Bull Cycle and since the 1W MA50 held so emphatically, it is most likely the most optimal level to buy on the long-term.
** Please support this idea with your likes and comments, it is the best way to keep it relevant and support me. **
--------------------------------------------------------------------------------------------------------
!! Donations via TradingView coins also help me a great deal at posting more free trading content and signals here !!
🎉 👍 Shout-out to TradingShot's 💰 top TradingView Coin donor 💰 this week ==> Vergnes
--------------------------------------------------------------------------------------------------------

HG1! Daily TimeframeSNIPER STRATEGY
This magical strategy works like a clock on almost any charts
Although I have to say it can’t predict pullbacks, so I do not suggest this strategy for leverage trading.
It will not give you the whole wave like any other strategy out there but it will give you huge part of the wave.
The best timeframe for this strategy is Daily, Weekly and Monthly however it can work any timeframe above three minutes.
Start believing in this strategy because it will reward believers with huge profit.
There is a lot more about this strategy.
It can predict and also it can give you almost exact buy or sell time on the spot.
I am developing it even more so stay tuned and start to follow me for more signals and forecasts.

COPPER Buy SignalPattern: Fibonacci Channel on 1D.
Signal: Buy as the price rebounded on the 1D MA50.
Target: The 1.5 Fibonacci extension level (low-risk) or the 2.0 Fibonacci level (high-risk).
Previous COPPER signal:
** Please support this idea with your likes and comments, it is the best way to keep it relevant and support me. **
--------------------------------------------------------------------------------------------------------
!! Donations via TradingView coins also help me a great deal at posting more free trading content and signals here !!
🎉 👍 Shout-out to TradingShot's 💰 top TradingView Coin donor 💰 this week ==> kylevd23
--------------------------------------------------------------------------------------------------------

Copper - SHORT; SELL it!! Long-term SHORTThis is a (very) long-term SHORT!
The long-term picture - the Monthly;


Copper Short SetupCopper Short Setup
🔵 Entry: 4.0263
🟢 TP & RR: $3.8877 (1.89)
⛔ Stop Loss: $4.0996
Trade Reasons:
✔️ Position in direction of the trend
✔️ Price reversed at the upper diagonal trend line

Copper Short SetupCopper Short Setup
🔵 Entry: $4.327
🟢 TP & RR: $4.140 (2.02)
⛔ Stop Loss: $4.420
Trade Reasons:
✔️ 1.618 Fib Level Extension
✔️Market Flow overbought level
📝 Fairly basic setup, trying to capitilize on a potential pullback.


COPPER (XCU/USD) – Week 6 –Consolidation not over yet.Copper price moved sideways for the whole trading week, as we predicted in our past analysis.
For this week we are expecting the bearish corrective move to finish with a high chance that we will test the support area and the lower channel line highlighted on the chart. Once this move is completed, our long-term bias for this pair will be bullish.
Trade with care.
Best regards,
Financial Flagship
Disclaimer: The analysis provided is purely informative and it should not be used as financial advice. Remember that you need a plan before you start trading; so, take this knowledge and use it as a guidebook that will ultimately help you understand the market and easily predict your next move.
