COPPER - CU 31/01Pair : Copper - CU
Description :
Completed " 12345 " Impulsive Waves and " A " Corrective Waves. Bullish Channel as an Corrective Pattern in Short Time Frame with the Breakout of the Lower Trend Line and Retracement. Rejection from Fibonacci Level - 78.60% / 100.00%
Coppertrade

Copper - CUPair : Copper - CU
Description :
Completed the Breakout of Lower Trend Line of the Corrective Pattern " Bullish Channel " in Short Time Frame. " 12345 " Impulsive Waves and " AB " Corrective Waves will be completed at Fibonacci Level - 78.60%

COPPER 13/01Pair : Copper - CU
Description :
Bullish Channel as an Corrective Pattern in Long Time Frame with the Breakout of the Lower Trend Line and Bearish Channel as an Corrective Pattern in Short Time Frame and Rejection from Upper Trend Line. Completed " 12345 " Impulsive Waves and making its " A " Corrective Wave. We have LL - LH and Break of Structure

Copper 08/01Pair : Copper - CU
Description :
Bearish Channel as an Corrective Pattern in Short Time Frame , Rejection from Lower Trend Line. Completed " 12345 " Impulsive Waves at Daily Resistance Level and making its " A " Corrective Wave. Break of Structure

Copper CU 22/12 Pair : Copper CU
Description :
Bullish Channel as an Corrective Pattern in Long Time Frame and Rejection from Lower Trend Line. Rising Wedge as an Corrective Pattern in Short Time Frame with Strong Divergence and Break of Structure
Entry Precaution :
Wait for Rejection or Breakout

COPPER 06/12Pair : Copper - CU
Description :
Completed " 12345 " Impulsive Waves and " ABC " Corrective Waves at Daily Demand Zone. Its Rejecting from the Resistance Level to make its Impulse Again. Rising Wedge as an Corrective Pattern in Short Time Frame and Breakout of the Lower Trend Line
Entry Precautions :
Wait for the Proper Retracement

Copper 30/11Pair : Copper - CU
Description :
Completed " 12345 " Impulsive Waves and " ABC " Correction in Short Time Frame. Making Impulse in Short Time Frame and " C " Correction in Long Time Frame. We have Falling Wedge as an Corrective Pattern in Short Time Frame.
Entry Precautions :
Wait for the Breakout or Rejection of UTL

COPPERPair : CU - Copper
Description :
Breakout and Retest of the Corrective Pattern " Bullish Channel " in Short Time Frame and Completed Impulsive Waves " 12345 " and " ABC " Corrective Waves at Daily Descending Trend Line / Resistance Level
Entry Precaution :
Wait for Rejection and Retracement

COPPER Pair : Copper - CU
Description :
Completed " 1234 " Impulsive Wave at Lower Trend Line of the Corrective Pattern Bullish Channel in Short Time Frame and it will Complete its " 5th " Corrective Wave at Demand Zone or Daily Descending Trend Line at Fibonacci Level - 61.80%
Entry Precaution :
Wait until it complete its " 5th " Corrective Wave and Reject

Copper 26/10Pair : Copper - CU
Description :
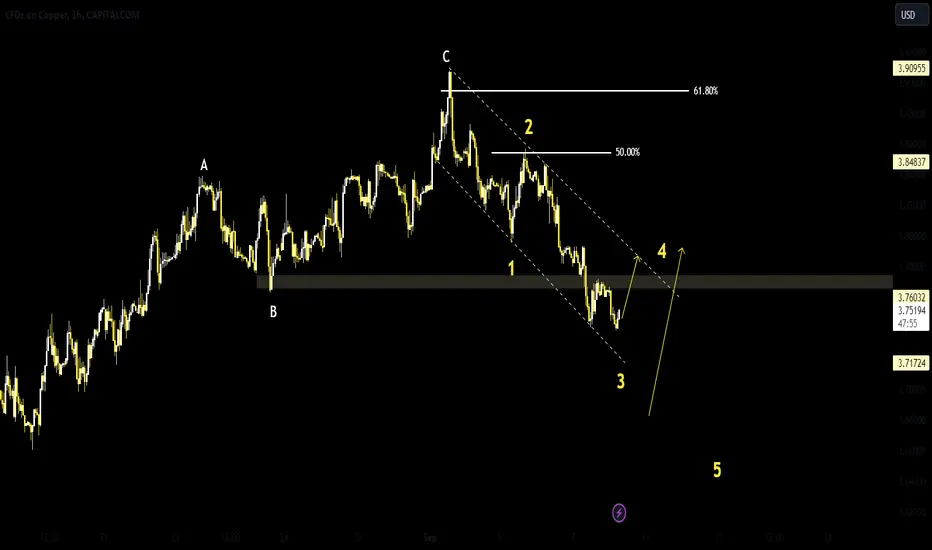
Completed " 123 " Impulsive Waves and it will make its " 4th " Wave at Fibonacci Level - 38.20% / 50.00%. Rising Wedge as an Corrective Pattern in Short Time Frame and Formed " wxyx " Corrective Wave and will make its " z " wave at Daily Descending Trend Line
Entry Precautions :
Wait until it Breaks UTL / LTL and Retest

COPPER - CU 20/10 MovePair : Copper - CU
Description :
Falling Wedge as an Corrective Pattern in Long Time Frame and Breakout the Upper Trend Line and making its Retracement in a Corrective Pattern " Bearish Channel " in Short Time Frame. Completed Impulse and Correction " ABC "
Entry Precautions :
Wait until it Breaks and Retest UTL

Copper Next Move Pair : Copper CU
Description :
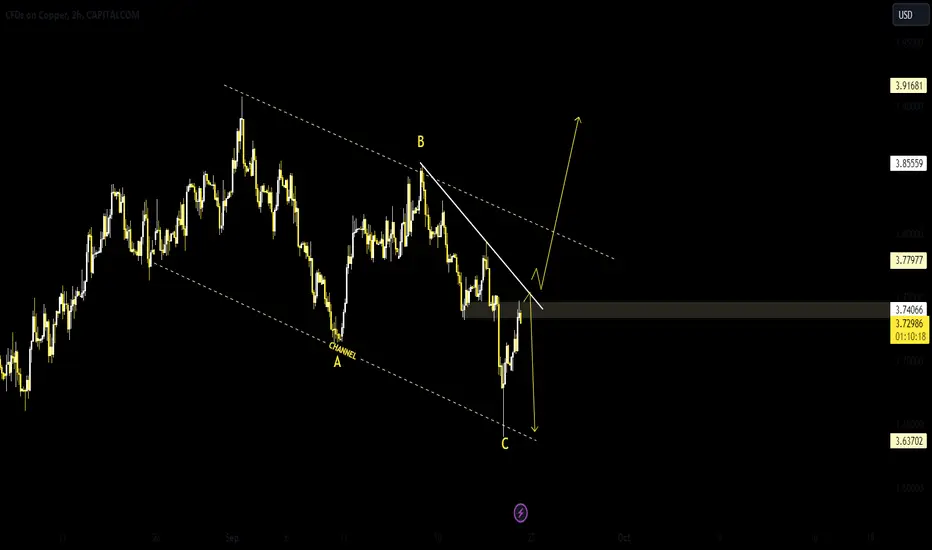
Falling Wedge as an Corrective Pattern in Long Time Frame and Rejection from the Lower Trend Line to Complete its Corrective Waves " ABC " after Impulsive Waves. Bullish Channel in Short Time Frame and Rejection from Lower Trend Line after " B " Wave
Precautions :
Wait until it Breaks Bullish Channel or Rejects from Upper Trend Line

COPPER 02/10 MovePair : CU Copper
Description :
Symmetrical Triangle as an Corrective Pattern in Short Time Frame and Breakout the Lower Trendline and Completed the Retracement after Impulsive Waves and Correction " wxyxz " , If it Breaks the Lower Trendline of the Correction " Bearish Channel " then sell

Copper Futures - Short - BearishSeeing a rising wedge pattern forming.
Trading bearing with thought breakout to the downside soon
***Always use proper risk management***

CU Copper 22 / 09 MovePair : CU - Copper
Description :
Impulse Correction Completed and it will again make its Impulse in a Corrective Pattern Bearish Channel in Short Time Frame. We have Break of Structure if it breaks the Upper Trend Line then Buy and If it Rejects from the Demand Zone then Sell
Copper 08/09 MovePair : CU - Copper
Description :
It has Completed its " 12 " Impulsive Wave at Fibonacci Level - 50.00 or Demand Zone. Bearish Channel in Short Time Frame and Impulse Correction in Long Time Frame completed its Impulse and Correction at Fibonacci Level - 61.80% it will again make Impulsive move
COPPER 24-08 MovePair : COPPER
Description :
Impulse Correction Impulse
Break of Structure
Bullish Channel in STF as an Corrective Pattern
RSI - Divergence
Fibonacci Level - 50.00%/ 61.80%

CU Copper Next MovePair : Copper CU
Description :
Bullish Channel in STF and LTF as an Corrective Pattern
Resistance Level
Fibonacci Level - 50.00% / 61.80%
Completed " 12345 " Impulsive Wave and " AB " Corrective Wave
Break of Structure


HG1! One word - CLEAN!COMEX:HG1! One word - CLEAN!
What a beautiful chart for copper! Technically it's ever so clean, when it comes to set ups like this - Be careful of fake breaks.
Pattern - Triangle/Pennant
Highs: 4.2100
Lows: 3.8255
A break of highs I expect: 4.3550 & 4.5570. However, a break of the lows I expect: 3.6740 & 3.5040 and perhaps lower!
Currently, as long as we within this channel and within these ranges... until break either side!
Have a great week ahead & it's a long weekend for some of us!
🔆 Trade Journal 🔆

COPPER ANALYSIS 1WIn my opinion, copper will move like this for the coming months and years until 2026

Copper analysis and ideas: Will bears come back?Copper prices may remain under pressure in the coming months due to investors' apprehension about China's growth prospects in the wake of the 20th National Congress of the Chinese Communist Party, which disappointed the market.
Since September, copper prices have fluctuated within a relatively narrow range (3.2-3.6) after the earlier sharp declines occurred this year.
The long-term case for copper remains strong, as it is a key metal for the energy transition and global inventories are currently very low.
However, one of the main challenges it faces in the near future is its dependence on China’s economic growth.
The brown metal will remain under pressure unless China announces new growth-friendly economic policies to counteract the predicted slowdown in the country’s economy. However, the latest China Party Congress appears to prefer fostering sustainable growth and giving more importance to inequality, national security, and ideological matters.
Copper bull markets have historically coincided with periods of extraordinary global growth, driven primarily by China.
We have now reached a crossroads in that regard, and if China is unable to maintain high and consistent economic growth, copper will have to wait for a new global wave of coordinated investments toward the development of renewables and green energy. However, given the issues with inflation and rising interest rates that we are currently facing, it may still be years before the transition fully takes hold on a global scale. This could take the price of copper subdued for longer.
When we look at the daily chart, we can see that some bearish pressure was forming near the 78.6% Fibonacci retracement level of the 2022 range. Also the 50-day moving average has been a quite strong dynamic resistance later. The technical picture remains overall on the bearish foot, and copper needs to clear the 2022 trendline at around $3.75 and then cross the psychological $4.00 mark before materially inverting the downtrend.

Copper analysis: Has the bear market rally ended already?After a 37% decline from its peak of $5.03 per pound in early-March 2022, copper has risen 14% since July's lows.
However, the metal has recently been unable to overcome key resistance levels represented by the 50-day moving average and the descending channel trendline, as fresh worries about global growth slowdown and monetary policy tightening reemerged this week.
Key macro events of the week:
China, the world's largest consumer of copper, unexpectedly lowered lending rates in an effort to boost demand after reporting weaker-than-anticipated July numbers for industrial production (3.8% vs 4.6% expected), fixed asset investments (5.7% vs 6.2%), and retail sales (2.7% vs 5%).
In the United States, the New York Empire State Manufacturing Index plunged to -31.3 in August of 2022, from 11.2 in July. This is the lowest reading since May of 2020, and it indicates that business activity is weakening as a result of a collapse in new orders and shipments.
Germany's ZEW economic sentiment index has fallen to its lowest level since October 2008, and the UK inflation rate has risen to double digits, the highest in 40 years, adding fuel to the fire and reigniting fears of a global recession.
Ultimately, the Minutes of the FOMC's July meeting revealed that there is still a long way to go before declaring the war on inflation won, with members indicating that adopting a more restrictive policy stance was critical to avoiding a worsening of inflation expectations. This implies that the Fed's tightening is far from over.
Copper technical analysis
A bear market rally that is nearing exhaustion can be seen on the copper daily chart. The price action this week has been unable to break above both the bearish channel and the 50-dma, the RSI has tilted to the downside, and the MACD is getting close to a bearish crossover.
A similar pattern occurred earlier this year, in the first week of June.
After a 14% rebound from May's lows, copper briefly surpassed the 50-day moving average before beginning a severe, steep decline that lasted until mid-July. The RSI and MACD indicators both showed similar patterns to what we are seeing now.
Bottom line, a copper's short-term pullback to the bearish channel's midline in the $3.2-3.3 area seems more likely, given the current technical setup. Breaking decisively the 50-dma and bearish channel resistances would invalidate the thesis and raise the odds of a $4.00 per pound test.
Idea written by Piero Cingari, forex and commodity analyst at Capital.com
