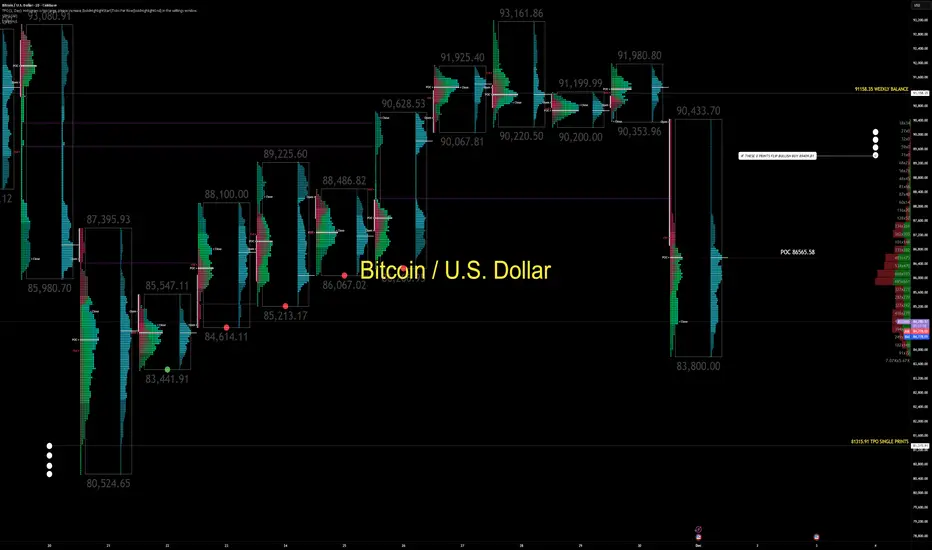
BTCUSD: Midrange Trap With One Behavior Line That Decides DirectBTCUSD respected weekly balance, rallied sharply, and left a clear volume imbalance behind.
Today’s session opened with a bearish TPO profile, attacking the lows immediately after midnight.
The chart presents a classic midrange manipulation environment.
From a CORE5 lens, today’s read is driven by two pillars:
Volume Flow Analytics (VFA) and Order Flow Dynamics (OFD).
1. The Key Behavior Level: 89,409
Today’s TPO left four critical prints around 89,409.
That zone is the behavior divider:
Below it: sellers remain in control, downside work unfinished.
Above it: structure flips decisively bullish.
BTCUSD remains “hidden behind” the weekly candle as long as it trades under 89,409.
2. Range Low Liquidity Still Unfinished
BTC has already attacked most local range lows except the deeper pocket at 83,441.91.
Below that sits a clean liquidity pool:
Buying tails and single prints around 81,315.91
Classic range-low liquidation structure
A pattern BTC often completes before resetting upward
This keeps downside behavior technically open despite weekly balance strength.
3. Midrange = Manipulation Zone
BTC is mid-structure.
This is where institutional players defend higher timeframe bias while algos rotate price intraday to trap both sides.
Execution guidelines:
Prioritize 15m structure shifts
Track behavior flips around 89,409
Expect two-sided noise
Treat midrange as deception territory, not confirmation territory
On higher timeframes, BTC remains inside a monthly structure mapping zone near 95 percent discount—explaining recurring dip demand without removing intraday trap risk.
The Core Message
89,409 is the line that defines directional clarity.
Below it: behavior stays two-sided and manipulative.
Above it: bullish structure re-establishes with real conviction.
Liquidity remains open at 83,441.91 and 81,315.91.
Trade the behavior, not the story.
— CORE5DAN
Institutional Logic. Modern Technology. Real Freedom.
Core5dan
CORE5 WEEKLY WARMAP — 1 DECEMBER 2025The market opens the week with the dollar locked inside a well-defined range between 97.67 and 99.98. Price is sitting near the mid-zone around 98.60, showing no structural breakout. Until one of these levels is taken out with conviction, this is a rotation environment, not a trend environment.
Yields continue to firm. The 10-year is up about 1.63 percent and the 2-year roughly 1.66 percent. Higher yields paired with a rangebound dollar create a more selective backdrop for risk assets. ES holds strength inside its upper band, but rising volatility signals a shift toward more two-way movement. Gold liquidated last week’s high and remains in a two-month bullish range. Across the six-chart grid, the underlying message is the same: strength on the surface, tension underneath.
The calendar is dense. ISM Manufacturing, ADP employment, ISM Services, trade balance, consumer credit, Michigan sentiment, and the full employment situation report arrive in a tight cluster. Each print feeds directly into expectations for the Fed’s December path.
Through the CORE5 lens, the dollar’s range defines the entire week. Market Structure confirms a rotation box. Dynamic Geometry shows price in discount, favoring fast intraday swings rather than smooth trends. Volume Flow flipped bearish last week after failing the bullish daily range, turning prior volume shelves into supply. Order Flow across FX pairs remains bullish, removing justification for blind shorting of risk assets. Execution must stay high-frequency, level-to-level, and based on clear confirmation.
The weekly thesis is direct: markets are being driven by firm yields and a heavy sequence of U.S. data. This is a reaction-driven week, not a predictive one. Intraday rotations offer more clarity than directional conviction.
The takeaway: the dollar remains inside its box, yields are firm, and volatility is rising. Treat every level as a behavior test. Trade the rotations, not your opinions.
— CORE5DAN
Institutional Logic. Modern Technology. Real Freedom.

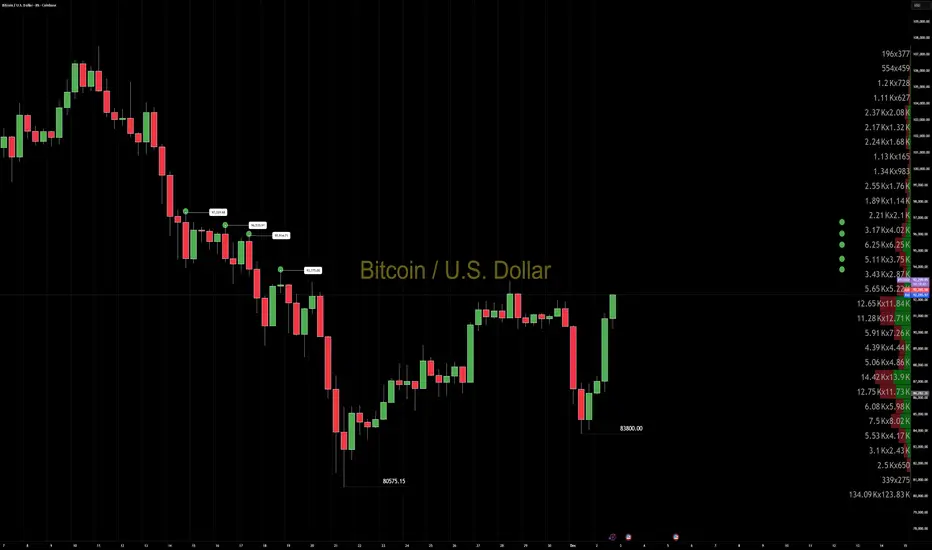
BTCUSD: Clean Higher Low and Orderflow Drive Toward MidrangeBTCUSD confirmed a new higher low at 83,800.
Today’s session delivered a strong orderflow boost that cleared the daily highs and pushed price back toward midrange.
From a CORE5 lens — using Order Flow Dynamics and Volume Flow Analytics — the tape shows sustained buyer aggression after the higher low formed.
Key upside levels ahead:
93,775
95,914
96,535
97,329
As long as the 83,800 higher low holds, BTCUSD maintains a clean intraday bullish behavior profile into midrange rotation.
Trade the behavior, not the story.
— CORE5DAN
Institutional Logic. Modern Technology. Real Freedom.
BTCUSD — next Target 89,697 CORE5 Pillar: MSM (Market Structure Mapping)
Bitcoin balanced last week’s imbalance and rejected lower with strength, showing buyers are still present at the lower liquidity pockets.
The internal structure remains bullish, even though price continues to operate inside a defined range.
Current behaviour shows rotation through discount rather than trend continuation. This confirms that participation is still intact and the structural map hasn’t broken.
The mid-range liquidity pool at 89,697 is the most logical magnet if buyers maintain control inside discount.
Until that level is cleared with conviction, expect rotation instead of expansion. Price still respects the range environment, and behaviour continues to favour a move into the mid-range liquidity before anything larger develops.
Bullish bias remains valid — but the range is still in control.
Respect the map. Follow the liquidity. Read behaviour, not hope.
— CORE5DAN
Institutional Logic. Modern Technology. Real Freedom.

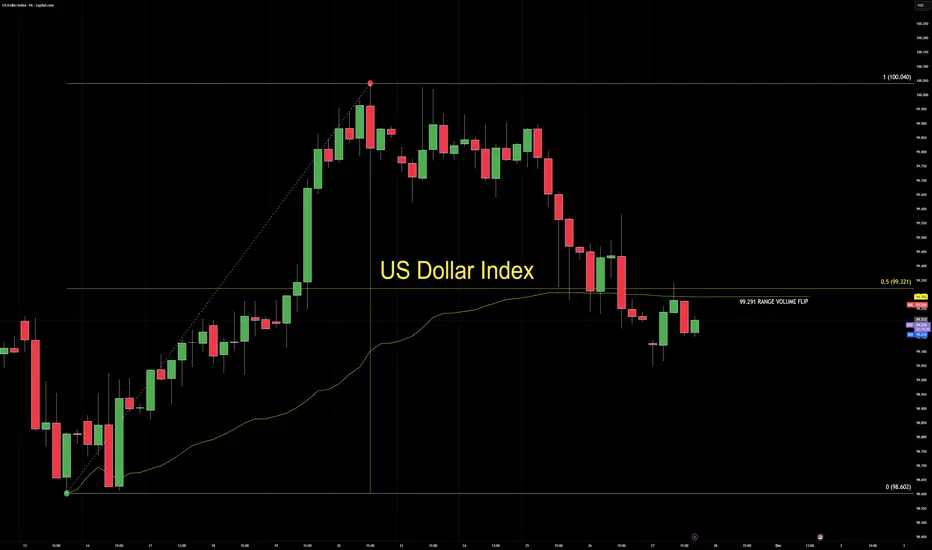
US DOLLAR UPDATEDollar is trading in the discount of the daily bullish range, losing momentum, and flipping the range volume node bearish at 99.291.
Range 98.602 → 100.040.
1. DRIVERS
Softening Dollar with fading participation.
2. STRUCTURE
Discount test with weak rotation.
Bearish node flip shows shifting participation, not a macro break.
3. IMPLICATION
Range location doesn’t confirm a flush.
Cross-market rally only forms when yields, risk tone, and correlations align.
4. CORE5 PILLARS
MSM: discount test
DGM: momentum fading
VFA: bearish flip at 99.291
OFD: no strong absorption
PEM: wait for confirmation
5. TAKEAWAY
This is a probe, not a confirmed reversal.
— CORE5DAN
Institutional Logic. Modern Technology. Real Freedom.
Bitcoin — Higher Low Confirmed at 86,247Bitcoin pushed away from 86,247, confirming a higher low inside the third range. Structure is still bullish for the week, even though we are sitting inside the daily bearish range discount. That means the environment favours upside, but the odds are thinner — you’re trading against the higher-timeframe imbalance.
Geometrically the market is climbing from discount with compressed rhythm, and the behaviour fits a controlled accumulation rather than emotional chasing. Volume shows a cap in today’s action, which often fills later in the session or early tomorrow. If that fill forms another higher low, the path for continuation opens.
We’re also sitting inside a macro week where the dollar is soft: weaker USD flows, softer yields, and reduced risk-off pressure showing across assets. That backdrop supports higher Bitcoin prints, but structure still decides the next move.
Order flow shows absorption at the lows, not panic. Pullbacks are being tested and rejected fast. That’s coordinated behaviour, not randomness. A break above the bearish range high at 93,080 is the clean trigger for a fresh bullish leg. Until then, patience. Professionals load after the break — not before it.
Premium trading conditions today favour high-frequency setups only. Most traders get trapped for forcing trades inside a half-formed range. Let the Composite Mind set the next intention. Behaviour is clearer than prediction.
— CORE5DAN
Institutional Logic. Modern Technology. Real Freedom.

The 74,420.69 Decision Zone: Bitcoin’s Next Regime Depends on ItBitcoin is approaching 74,420.69, a long-term structural decision level where macro conditions, liquidity behavior, and monthly market structure converge.
Macro conditions are tightening: the Dollar is firm, yields are stable, and liquidity across major crypto venues is thinner into month-end. This is the first time BTC has tested a structural ceiling under genuine macro pressure.
Key upcoming catalysts influencing liquidity and Dollar direction include U.S. CPI, Core CPI, PPI, FOMC Minutes, weekly labor data, consumer confidence, month-end rebalancing flows, and Q4 options positioning. BTC is meeting structural resistance at the exact moment these events cluster.
From a Market Structure Mapping perspective, the monthly bullish regime remains intact only if November closes above the prior range low. A close beneath that threshold would trigger a rare long-horizon regime inversion, shifting models from accumulation toward distribution. Monthly structural breaks are uncommon and typically define multi-year liquidity cycles.
Participation metrics confirm the tension. Volume Flow Analytics shows significant absorption at the high, with buy-side flows consistently consumed across major venues. Order Flow Dynamics aligns, indicating buyers being absorbed rather than defended — a common pattern at structural ceilings.
74,420.69 is not a target. It is the structural axis around which Bitcoin’s next multi-year regime will form. Confirmation requires the monthly close.
— CORE5DAN
Institutional Logic. Modern Technology. Real Freedom.

PRE-NY CONDITIONS Dollar is pressing into a major cross-asset high, recognized across FX, yields, and risk assets. London kept DXY inside a tight structure with no clean breakout, which turns this level into stop-time: the point where liquidity pauses and the market decides whether the move extends or fades.
Front-end yields remain firm, anchoring the Dollar’s support. The 10-year is indecisive, offering no confirmation and keeping the curve without a clear macro signal. ES holds its overnight gap on Nvidia strength, but volatility near 21 keeps risk fragile. Gold remains neutral, reflecting a balanced but uncertain safety tone into the U.S. session.
DXY: Testing a major high; range-bound after London; structure stretched but supported by 2Y strength.
US10Y: Indecisive daily structure; long end is not confirming Dollar strength; macro tone remains unclear.
US2Y: Firm short-end repricing; maintains policy pressure and supports Dollar tone.
ES: Holding gap; risk appetite supported but shallow; volatility still limiting follow-through.
Gold: Neutral safety tone; neither attracting nor rejecting flows; reflects cross-asset indecision.
VIX: Near 21; elevated volatility keeps conditions reactive and reduces trend reliability.
Cross-asset alignment remains mixed. The Dollar is firm, but only the front end confirms it. Long-end yields hesitate. ES shows controlled appetite, but volatility denies conviction. Gold confirms the indecision. Liquidity conditions lean cautious, shaped more by bond market signals than by clean macro drivers.
Pillar Focus: PEM — Confirmation Entries
Today's environment aligns with PEM logic. A stretched Dollar at a major level, split yields, and elevated volatility mean operators should rely on confirmation-based triggers, shorter engagements, and strict timing. High-frequency windows (NY open → 10:00 → London fix) carry more clarity than directional assumptions.
Follow higher-timeframe direction
Ignore noise from earlier sessions
Wait for structure + flow alignment
Act only on confirmation
Summary: NY opens into a cautious environment defined by a stretched Dollar, mixed yields, and elevated volatility — a clear PEM day.
— CORE5DAN
Institutional Logic. Modern Technology. Real Freedom.

NY SESSION STRUCTURE UPDATEES continues to hold an inside-day structure, with price contained inside yesterday’s range.
This keeps the market in a balancing regime under MSM — compression, not trend.
The key level today is the inside-day break.
Until price resolves either side of the range, there is no confirmed directional intent.
The behaviour is straightforward:
– Liquidity is building at both edges
– Momentum remains muted
– No side is showing initiative
– Structure is coiling, not expanding
Operator approach:
Ignore early movement.
The valid move only appears once the inside-day resolves and behaviour confirms expansion.
— CORE5DAN
Institutional Logic. Modern Technology. Real Freedom.

BTC — Original Distribution Still UnfinishedBTC continues to move inside unfinished structure. Risk tone is neutral and overnight flows were thin, leaving the market waiting for direction from today’s U.S. releases. The only event with enough weight to shift risk appetite is the FOMC Minutes later today.
On the chart, BTC has rejected the original bullish distribution gap at 88,804.64 for several sessions. That gap remains unclosed, which signals unfinished architecture rather than trend continuation. Price is still confined within Monday’s range between 91,158 and 95,950, forming a clean mid-range compression. Nothing in this structure confirms resolution yet.
Market Structure Mapping views this compression as a neutral regime: the market is balancing, not trending. The failure to close the distribution zone shows the prior move left imbalance behind, and markets generally rebalance before committing to a new leg. Retail sees “sideways.” Professionals see preparation.
The non-obvious point: this isn’t hesitation; it’s the market restoring balance before revealing intent.
For operators, the approach is straightforward. Let New York volatility clear the noise. Structural clarity only appears once price resolves above 95,950 or below 91,158. Anything before that is positioning, not direction.
— CORE5DAN
Institutional Logic. Modern Technology. Real Freedom.

TRADINGVIEW — NY SESSION UPDATELondon pushed the Dollar into 99.591, but DXY remains inside yesterday’s structure.
Compression unchanged.
Yields softer into NY — 10Y −1.11%, 2Y −1.27% — defensive tone with no directional commitment.
ES reclaimed the 6655.50 London low and trades back inside its range.
Gold steady above 4019.57.
Volatility stable.
NY opens into a tight Dollar and softer yields.
First expansion sets the tone.
— CORE5DAN
Institutional Logic. Modern Technology. Real Freedom.

PRE-LONDON CONDITIONS — DXY Range-Bound, Yields Slide, ES HeavyU.S. Dollar Index (DXY) holds a tight 98.99–99.59 range in a third consecutive inside bar.
U.S. 10-year yield drops ~1.01% in Asia.
U.S. 2-year yield falls ~1.27%.
S&P 500 futures (ES) extend lower toward the 6.571 fractal.
Gold tests support after filling imbalance.
Volatility remains elevated.
DXY — Dollar Index
Dollar stays inside 98.991–99.591.
Inside-bar stack remains unbroken.
Price sits near the 0.6 premium zone.
Neutral until London breaks the range.
Yields — 10Y & 2Y
10Y yield: -1.01% in Asia → long-end compression.
2Y yield: -1.27% → dovish policy tone.
Curve: both ends lower → risk-off positioning.
ES — S&P 500 Futures
ES moves lower toward 6.571.
Yesterday’s high-volatility expansion continues.
Tone remains defensive.
Gold — Safety Premium
Gold fills imbalance and presses into support.
Break = active safety flows.
Hold = passive bid.
Volatility
VIX closed pre-London.
Futures hold elevated regime.
Conditions favor fast intraday expansions.
Calendar Risk
Medium-tier data ahead.
Yesterday’s partial data production repeats → limited visibility.
Expect flow-driven moves until major prints arrive.
Execution View
DXY bias neutral inside range.
Yields down + ES down = risk-off.
Gold support = key inflection.
London expansion outside 98.99–99.59 sets direction.
Trade second move, not first spike.
Summary:
Dollar trapped. Yields lower. ES heavy. Gold at support.
Fragile pre-London environment; London’s first expansion defines the session.
— CORE5DAN
Institutional Logic. Modern Technology. Real Freedom.

BTCUSD updateMacro Context
Dollar strength, rising U.S. yields, and elevated volatility keep global risk conditions defensive.
Crypto follows that tone: liquidity is cautious, and participation slows ahead of a heavy macro week.
Crypto News Snapshot
Bitcoin trades near a six-month low as fading rate-cut expectations pressure risk assets.
Ethereum headlines a new “supercycle” claim, though critics question whether fundamentals support it.
XRP gains attention as ETF-related institutional flow expectations rise.
MSM — Market Structure Mapping
BTC trades in the daily discount zone under prior bearish highs.
Liquidity from last week’s 92,630 remains active.
VFA — Volume Flow Analytics
The previous bullish volume node is lost.
Participation favors defensive flow rather than expansion.
OFD — Order Flow Dynamics
Orderflow is bearish at negative 2 deviation levels.
Sell-side engagement is cleaner than buy-side behavior.
PEM — Precision Execution Modeling
Engagement is difficult at these levels.
Dollar strength and rising yields tighten conditions across crypto and risk assets.
Until macro stabilizes, stick to structure + flow alignment.
No anticipation. Only confirmation.
CORE5 Rule of the Day
Slow down when the macro speeds up.
One-Line Summary
BTC trades in a defensive macro regime with selective participation and a neutral-to-cautious bias.
— CORE5DAN
Institutional Logic. Modern Technology. Real Freedom.

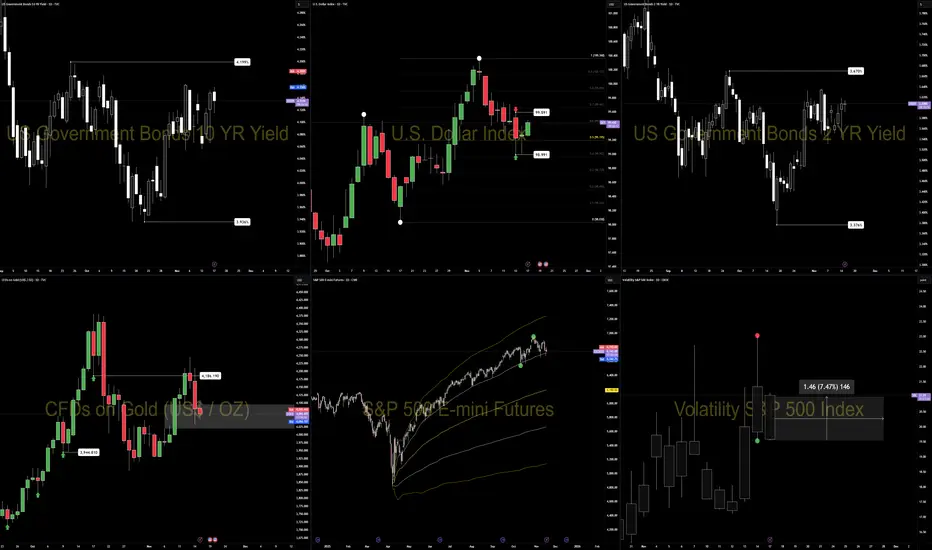
PRE-NY CONDITIONS — 17 November 2025New York inherits a defensive London session: steady Dollar, firm short-end yields, weaker equities, and rising volatility.
1. Market Environment (London → NY Transition)
Dollar:
DXY holds mid-range near 99.40. No shift in macro tone during London.
Yields:
US10Y near 4.15%, US2Y near 3.60%. Both stayed contained inside narrow ranges — policy tone unchanged.
Risk Tone:
ES weakened through London. Volatility elevated. Global tone remains cautious.
Liquidity:
Thinner into NY as VIX climbs and equities soften.
Quick Insight:
Stable 2Y = stable policy tone.
Rising VIX = cautious liquidity.
2. Six-Chart Snapshot (Operator View)
DXY:
Mid-range (98.991–99.981), inside-bar structure. No bias until a break.
US10Y:
Range-bound. Today’s move sits inside a 1.03% range.
US2Y:
Up 0.64% on low volume — quiet policy tone, data-waiting behavior.
ES:
Bearish through London with clear rotation lower into NY.
Gold:
Lower inside daily imbalance. Down 1.46% — weak safety demand.
VIX:
Up 7.47% — rising volatility regime.
3. Cross-Asset Signals
Yields:
Stable long-end + firm short-end → Dollar supported.
Equities:
ES weakness maintains defensive tone.
Gold:
Lower → no significant safety bid.
Volatility:
Higher VIX → cautious liquidity and reactive flows.
Global Risk:
Neutral-to-defensive.
4. Core Drivers for NY
• Dollar reaction inside the inside-bar range
• Short-end yield firmness (2Y)
• ES tone post-NY open
• VIX regime (expanding vs contained)
• Yield alignment (10Y + 2Y)
5. Execution Notes — CORE5 PEM
Follow higher-timeframe direction
Ignore noise from earlier sessions
Wait for structure + flow alignment
Act only on confirmation
One-Line Summary
NY opens into a defensive setup: steady Dollar, firm yields, weak equities, and rising volatility.
— CORE5DAN
Institutional Logic. Modern Technology. Real Freedom.
DXY — Sunday War MapThe U.S. government has reopened after a 43-day shutdown, but the gap in economic data remains.
Several key datasets were not collected during the closure, and the missing information cannot be reconstructed.
As a result, the Dollar is now trading on partial visibility rather than complete fundamentals.
Macro Overview
The most recent complete inflation report is September CPI at 3.0%, with core inflation also at 3.0%.
Earlier in the month, the U.S. Dollar Index (DXY) briefly moved above 100.
It then retreated toward 99 after consumer sentiment fell to a three-year low.
Last week’s muted behavior reflects uncertainty, not a structural shift.
When information is missing, liquidity becomes cautious and price action compresses.
Key Events This Week (Nov 17–21)
FOMC Minutes — Wednesday, Nov. 20
This release provides the first reliable view into Federal Reserve discussions since the shutdown.
Markets will look for whether policymakers supported multiple rate cuts or expressed hesitation.
Consumer Sentiment — Friday, Nov. 22
Last month saw a more than 30% year-over-year decline.
Another weak reading will influence Dollar positioning.
Delayed Data Returns
Housing, industrial production, and jobless claims will re-appear gradually this week.
These incomplete releases still matter ahead of the December 9–10 Federal Reserve meeting.
The Dollar is currently driven more by data absence than by clear economic direction.
MSM — Market Structure Mapping
DXY remains inside a major daily bullish range:
Range Low: 97.672
Range High: 99.985
Price sits near the 50% geometric midpoint.
Last week closed at 98.776, maintaining structural balance and preserving the broader bullish framework.
VFA — Volume Flow Analytics
Price continues to hold on the 98.725 bullish volume node, a level typically used for quiet accumulation.
This suggests ongoing absorption of buy-side orders at discount levels ahead of potential volatility expansion.
OFD — Order Flow Dynamics
Liquidity remains concentrated around two notable participation zones:
Aggressive buyers: 98.243
Aggressive sellers: 99.225
These zones are often retested early in the week to assess participation or clear weak inventory before direction establishes.
PEM — Precision Execution Modeling
Mid-range conditions are typically used to clear stops on both sides before intent forms.
Execution criteria for the week:
Respect higher-timeframe direction
Wait for confirmation
Avoid mid-range noise
Act only when structure, flow, and behavior align
High-quality setups generally appear after liquidity sweeps, not before.
Psychological Frame
The major risk this week is acting on incomplete data.
The shutdown left a statistical gap that has not yet been resolved.
Professionals avoid committing capital until visibility improves.
The appropriate approach for the week is simple: observe first, act later.
— CORE5DAN
Institutional Logic. Modern Technology. Real Freedom.

BTCUSD | NEUTRAL BIAS | DAILY TIMEFRAME Bitcoin isn’t trending — it’s negotiating value.
Price is sitting deep in the discount zone of the broader bullish range while resting directly on the naked point of control at 94,353.90.
This is negotiation, not momentum.
Next week’s US Dollar data will decide whether participation expands or stays muted.
MSM — Market Structure Mapping (The Framework)
Price has rotated into the 74,420 → 126,402 deep-discount region.
Today’s candle prints inside-bar behaviour, meaning the market is compressing and trying to rebalance yesterday’s distribution lower.
This is not breakout behaviour — it’s value discovery.
VFA — Volume Flow Analytics (The Participation Map)
The 94,353.90 NPOC is the key behaviour hinge.
As long as price interacts with this level, participation remains cautious and undecided.
Value is being weighed — not chased.
OFD — Order Flow Dynamics (The Behavior)
Order flow leans bearish on the daily timeframe.
Yesterday’s 99,836 high → 93,984 low shows sellers pressing, but without meaningful delta expansion or aggressive continuation.
Intent here is defensive, not dominant.
PEM — Precision Execution Modeling (The Engagement Rules)
Market is in a controlled daily pullback phase.
The high-probability behaviour target sits below the 91,362 liquidity pool, where stops, inefficiency, and unfinished business remain.
Execution here must stay rule-driven — wait for confirmation, not anticipation.
- NEXT WEEK’S US DOLLAR DRIVERS TO WATCH
Bitcoin’s next move depends less on patterns and more on USD participation.
Key US events:
1. Industrial Production & Manufacturing Data
Weak = USD eases → crypto gains breathing room.
Strong = USD firm → risk assets remain cautious.
2. Housing Starts & Building Permits (High-Impact)
Often shift USD volatility and near-term sentiment.
3. FOMC Minutes + Fed Speaker Schedule
Hawkish tone → Dollar strength → BTC hesitation.
Dovish tone → Dollar ease → BTC participation improves.
4. US Budget & Broader Macro Releases
These feed directly into FX algos → crypto indirectly reacts through risk appetite.
Bitcoin will respond to flows, not predictions.
CORE5 Rule of the Day:
Don’t trade what you hope. Trade what participation confirms.
— CORE5DAN
Institutional Logic. Modern Technology. Real Freedom.

DXY Near Key Liquidity Pools — Which One Gets Taken First?NY Session Update
The Dollar opens New York trading holding firm in mid-range, rotating around the 0.50 region near 98.828.
The session begins with a steady structure, and flow remains shaped primarily by the broader macro tone rather than intraday volatility.
The Dollar spent the week under steady pressure as investors reassessed U.S. growth momentum. Several datasets were delayed, and the backlog created uncertainty around how strong the underlying economy actually is. The tone from the Federal Reserve shifted subtly toward patience — less focus on tightening, more on maintaining optionality.
At the same time, global risk appetite improved. Equities held firm, and capital rotated into other major currencies, reducing the Dollar’s safe-haven advantage. That combination — softer growth signals, stabilizing risk, and non-committal policy language — kept the Dollar pinned in mid-range structure.
Looking ahead, the next meaningful movement will likely come from surprise prints rather than scheduled events. Employment data, inflation momentum, and backlog clears remain the pressure points. Until those catalysts hit, the Dollar stays in observation mode: stable, compressed, and sensitive to macro tone rather than intraday noise.
NEXT WEEK’S U.S. DOLLAR DRIVERS
Inflation releases – Headline and core CPI/PPI data will test momentum in pricing pressure.
Employment & labour data – Wage momentum, participation and unemployment trends remain under the microscope.
Policy tone from the Federal Reserve – Speeches and any shifts in guidance around timing will carry enhanced weight.
Global risk-sentiment flow – Equity performance and risk-asset appetite at the NY open will continue to influence USD positioning.
Data backlog clarity – Delayed prints and residual effects from previous disruptions may create surprises in either direction, affecting Dollar flow.
CORE5 Pillar Overview
MSM — Market Structure Mapping:
Price remains inside weekly balance, with activity clustered around 98.776 — consistent with mid-range conditions.
VFA — Volume Flow Analytics:
The 4H anchored volume node at 98.725 continues to mark the area of most participation.
OFD — Order Flow Dynamics:
Recent activity shows hesitation to move deeper into the lower inefficiency zones.
PEM — Precision Execution Modeling:
Liquidity context remains defined by areas near 98.30 and 99.30, with the broader range limits at 97.672 and 99.985.
This provides the wider map for understanding structural rotation.
CORE5 Rule of the Day
Mid-range moves feed ego, not equity.
—
— CORE5DAN
Institutional Logic. Modern Technology. Real Freedom.

BTCUSD | London Session | Bullish Structure BalanceThe monthly bullish structure balance has now been filled, and the higher-timeframe map remains intact.
BTC continues to rotate inside a bullish range and is still positioned in the discount zone.
Range boundaries:
• Range low (invalidation): 78.167
• Range high (continuation): 123.231
As long as price holds above the range low, the bullish bias stands.
- Market Structure Mapping (MSM) — Current View
The structural picture is straightforward:
BTC is holding a clean range.
There is no breakdown. No structural shift.
The architecture is stable.
Cross-market structure adds context:
• The U.S. dollar sits directly on a major volume node.
If the dollar pushes higher from here, risk assets usually feel it.
If the dollar softens, crypto keeps its bullish rotation.
• FX majors recently cleared liquidity lows, resetting the structural map.
• Crypto majors remain balanced with no directional damage.
This is a classic data-waiting phase.
The structure is already drawn. The market is waiting for a catalyst to decide the next expansion path.
- Precision Execution Modeling (PEM) — Guidance for Volatile News Days
When heavy data is on the calendar, PEM shifts the playbook:
• Do not react to the first spike.
The wick is emotion. The candle close is intent.
• Step back to higher timeframes.
4H and 1D candles filter out noise and reveal real direction.
• Expect wicks to violate levels without changing structure.
Large funds do not trigger algorithms on a random spike; they react to confirmed structure.
• Protect capital until the market shows its hand.
In fast conditions, patience is a position.
CORE5 :
If you need excitement, watch Netflix. If you need results, wait for the candle close.
— CORE5DAN
Institutional Logic. Modern Technology. Real Freedom.

DXY Is Entering a Decision Zone — The Next Move Starts Here.DXY | Neutral Bias | 4H Frame
CORE5 View: Price has filled its inefficiencies and now meets the weekly balance head-on. This is the decision point for the next impulse.
Fundamental Context
Tomorrow is the real driver: PPI + jobless claims, with CPI right behind it.
These three data points set the short-term path for the dollar’s yield expectations.
Markets are holding steady into the releases — no rush, no conviction.
This is a waiting zone until numbers show direction.
Market Structure Context
Price has pushed into the discount side of the 4H range, tapping the same zone that has triggered rotations before.
All single prints beneath have now been filled, removing imbalances.
Now the structure is pressing the weekly balance at 98.766, a level that normally slows momentum and forces the market to show its hand.
This is where structure decides between rotation or continuation.
MSM — Market Structure Mapping
The 4H structure carries a bearish tone, but it is pushing straight into weekly balance, which often neutralizes momentum.
Nothing is broken, but nothing is confirmed.
This is where professionals wait for liquidity to choose dominance.
DGM — Dynamic Geometry Modeling
The downward leg into discount matches the prior leg in size and rhythm.
Symmetry is complete.
Geometrically, this is a natural location where rotation can start — but only if liquidity agrees.
VFA — Volume Flow Analytics
Anchored volume sits at 98.725, only a few points below current price.
This is a reliable decision level:
• Rotation often begins here when volume defends.
• If price accepts below this node, bearish continuation opens quickly.
It’s a participation pivot — the market chooses, not us.
OFD — Order Flow Dynamics
Order flow still favors the bearish side.
No meaningful attempt higher, no failed push, no shift in intent.
Buyers are quiet; sellers are steady.
Patience here protects capital.
PEM — Precision Execution Modeling
We’re sitting mid-range into end-of-day liquidity with clear pools both above and below.
In these conditions, price often drifts, cleans both sides, and waits for tomorrow’s data.
For cross-market positioning, holding off until USD bias confirms is the professional move.
🧠 CORE5 Rule of the Day
“Context leads. Direction follows. Structure only works when you let it speak first.”

BTCUSD | Bearish Range | Daily — Market on Hold Ahead of CPIBTCUSD’s still in a bearish structure, bouncing between the two volume fractal pivots — 106463 and 100996. It’s hanging near the bottom of the daily range (116410 to 98892) with no clean push either way. Volume flow’s midrange around 108333, showing balance — no real momentum. With dollar strength and CPI data on deck this week, the market’s just soaking liquidity and waiting for the next macro trigger to hit.
Volume tells the truth before price does!
-core5dan

DXY, US DOLAAR UPDATEDXY — Structure & Flow Brief
DXY | Bullish Bias | Daily Frame | CORE5 View:
Dollar remains in short-term pullback mode inside a broader bullish structure, holding between 97.67 and 99.98 while traders watch this week’s macro lineup.
The key data hits Thursday and Friday — Jobless Claims, followed by PPI and Retail Sales.
Those reports will show if the economy is cooling or still running hot, shaping the next leg for the dollar.
Yields stay firm, keeping the tone quietly bullish, but most desks are flat until the data drops.
MSM — Market Structure Mapping (The Framework)
We’re trading inside a daily bearish candle, sliding into the imbalance near 98.964.
A close back above that cap would keep the broader trend context bullish.
If price doesn’t reclaim that level, the structure favors a move toward lower zones before the next leg.
VFA — Volume Flow Analytics (The Participation Map)
A main POC sits at 98.562, right inside the discount area of the range.
That’s a heavy-volume zone — price action can drive into it if downside momentum develops.
On news days, markets often run through these areas to clear liquidity before direction returns.
OFD — Order Flow Dynamics (The Behavior)
Price is currently parked inside an order-flow imbalance, filling single-print orders around 98.964.
It’s an absorption phase — volume is active, but larger players are keeping it balanced until catalysts arrive.
We’re seeing divergences across EURUSD, gold, and yields heading into Friday’s PPI and Retail Sales.
When the data hits, volatility often increases, and these imbalance zones tend to resolve.
PEM — Precision Execution Modeling (The Engagement Rules)
Trading the middle of the range is a low-edge play unless you’re scalping.
We’ve already had strong moves today, so there’s no reason to force new triggers here.
Within the CORE5 framework, we avoid engaging at the 50/50 range midpoint and wait for direction, confirmation, and flow alignment.
For now, it’s about risk control and patience until tomorrow’s data gives a clean framework signal.
CORE5 Rule of the Day:
Mid-range moves feed ego, not equity.
— CORE5DAN
Institutional Logic. Modern Technology. Real Freedom.

BTCUSD — All Targets HitCORE5 Market Note
- Market Structure Mapping (MSM)
Bitcoin (BTCUSD) hit our weekend targets early and bounced from the volume fractal at 106.463.
Price still trades inside the bearish range from 116.432 (high) to 98.952 (low) — the same structure carried over from last week.
BTC is now testing the midrange zone, trading lower within the daily structure.
MSM shows a sell reaction from the fractal, but we still need a proper shift in structure before bias confirms.
For now, it’s a waiting game — the London session already delivered strong moves, so patience remains the higher-probability play.
- Volume Flow Analytics (VFA)
The weekly fractal near 100.996 has absorbed nearly five days of price action — a clear zone where buyers stepped in with size.
Above, the 106.463 fractal marks where sellers defended, creating two strong reference points that now frame the market.
These levels must break before any clear directional bias forms.
Until then, it’s still a waiting game.
- Macro Context
The U.S. dollar softened as traders expect more Fed rate cuts ahead, while Washington moves closer to reopening the government.
That calmer tone helped risk markets rebound — Bitcoin included.
If yields stay near 4.1% and confidence keeps building, crypto has room to recover.
But a sudden dollar rebound could flip sentiment fast.
🧠 CORE5 RULE: The next move doesn’t need you — it needs confirmation.
— CORE5DAN
Institutional Logic. Modern Technology. Real Freedom.

DXY — Range Structure HoldsThe US Dollar Index (DXY) started the week trading just below a bearish distribution fractal low at 99.321. Price holds inside a short-term bearish range between 99.000 (low) and 99.500 (high) while still operating within the broader daily bullish structure. DXY is currently moving through the daily imbalance cap near 99.035, sitting in the premium zone — compression remains active as larger participants stay patient. Market Structure Mapping (MSM) shows price tightening in that upper zone — the calm before the bigger players step in.
Market Structure Mapping (MSM) shows price pressing into the daily imbalance high near 99.035, lining up with the range-low fractal around 99.032. That’s the lower edge of Monday’s structure — tight, clean, and holding steady. Volume Flow Analytics (VFA) points to order-flow absorption — buyers keep hitting the tape, but liquidity keeps taking the other side.
It’s that slow-burn type of session where participation fades and bigger players quietly build positions under the surface. If that pattern holds, price could drift back toward the discount area once participation increases.
No rush — London already had its short trade this morning.
Now it’s just about waiting for confirmed order flow before taking the next setup.
The dollar’s steady as Washington works on a funding deal to end the government shutdown, calming market nerves.
Ten-year Treasury yields hover just above 4.1 %, keeping a floor under USD as investors still get paid to hold dollars.
Inflation’s sitting near 3 %, growth data is mixed, and delayed reports mean traders are reacting more to headlines than numbers.
For now, yields and improving political tone offer support — but it’s not bulletproof.
If debt or growth headlines turn sour again, that support can fade fast.
🦅 CORE5 RULE:
Slow days build strong traders. Wait for the flow, not the noise.
— CORE5DAN
Institutional Logic. Modern Technology. Real Freedom.
