EURUSD: Price May Continue To Fall Inside WedgeHello everyone, here is my breakdown of the current Euro setup.
Market Analysis
From a broader perspective, the price of EURUSD has shifted into a bearish phase after a prior Upward Channel failed and broke down. This reversal led to the formation of the current Downward Wedge, a pattern that has been guiding the price lower through a series of lower highs and lower lows.
Currently, the price is at a critical decision point. After bouncing from the lower part of the wedge, it has rallied correctly and is now directly testing the descending resistance line of the formation. This is a key area where sellers have repeatedly shown strength in the past.
My Scenario & Strategy
My scenario is based on the expectation that this Downward Wedge is a continuation pattern and the dominant downtrend will resume. I'm looking for the price to be rejected from the wedge's resistance line. A confirmed failure to break higher would be the key signal that the next impulsive move down is about to begin.
Therefore, the strategy is to watch for this rejection. A confirmed reversal would validate the short scenario. The primary target for this move is the 1.1615 Support, which aligns with the major Support zone.
That's the setup I'm tracking. Thank you for your attention, and always manage your risk.
Correction

EURUSD: Rally from Wedge Support to 1.1880Hello everyone, here is my breakdown of the current Euro setup.
Market Analysis
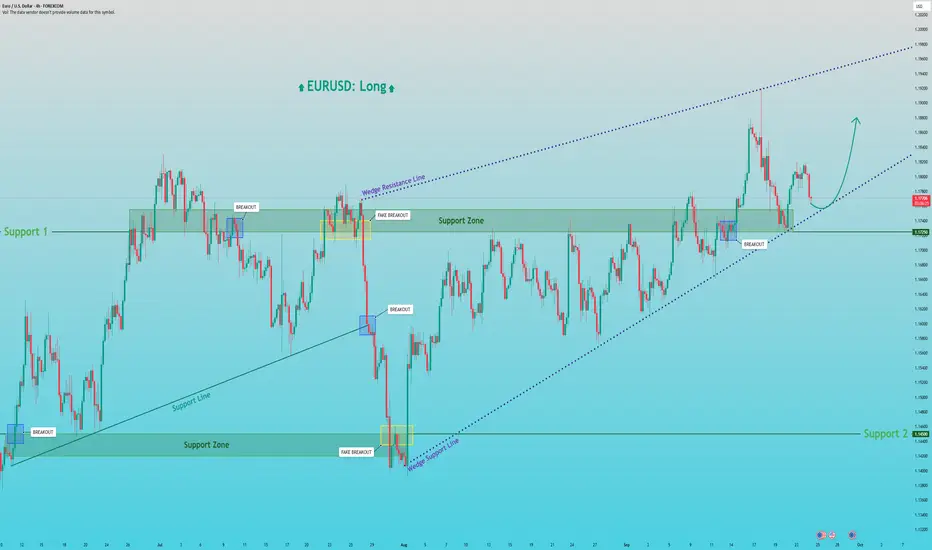
A prior uptrend failed, leading to a sharp drop down to the major Support zone 2 around the 1.1450 level. However, strong buying pressure emerged from that low, initiating a powerful reversal and establishing the current market structure.
This new bullish phase has formed a well-defined Upward Wedge. The price successfully broke through Support 1 and tested the wedge's resistance. Currently, it's in a healthy corrective pullback and is testing the ascending support line of this wedge, which is a key area to watch.
My Scenario & Strategy
I'm looking for the price to complete its correction and find a solid floor on the ascending support line. A confirmed bounce from this dynamic support would be the key signal that the next impulsive move up is about to begin.
Therefore, the strategy is to watch for this bounce. A successful rebound would validate the long scenario. The primary target for the next wave higher is 1.1880, which would represent a new structural high within the Upward Wedge.
That's the setup I'm tracking. Thank you for your attention, and always manage your risk.
XAUUSD Long: Bullish Momentum to ContinueHello, traders! The price auction for XAUUSD has been in a strong bullish phase, confirmed by the establishment of a well-defined ascending channel. This uptrend was initiated after a breakout from lower levels and has shown significant strength by pushing through multiple prior resistance areas, including the 3470 DEMAND 2 and 3675 DEMAND levels, turning them into new support.
Currently, the price action is continuing its ascent within the upper portion of this ascending channel, indicating that the bullish initiative remains firmly in control. The market is in a clear expansion phase, with very little sign of significant selling pressure, suggesting that any pullbacks are likely to be minor and short-lived.
My scenario for the development of events is a direct continuation of the current bullish momentum. I believe that the price will only make a shallow correction from the current levels before the next impulsive wave higher begins. In my opinion, the underlying trend is strong enough to carry the price to a new high within the channel. The take-profit is therefore set at 3835 points, targeting the upper resistance line of the channel. Manage your risk.

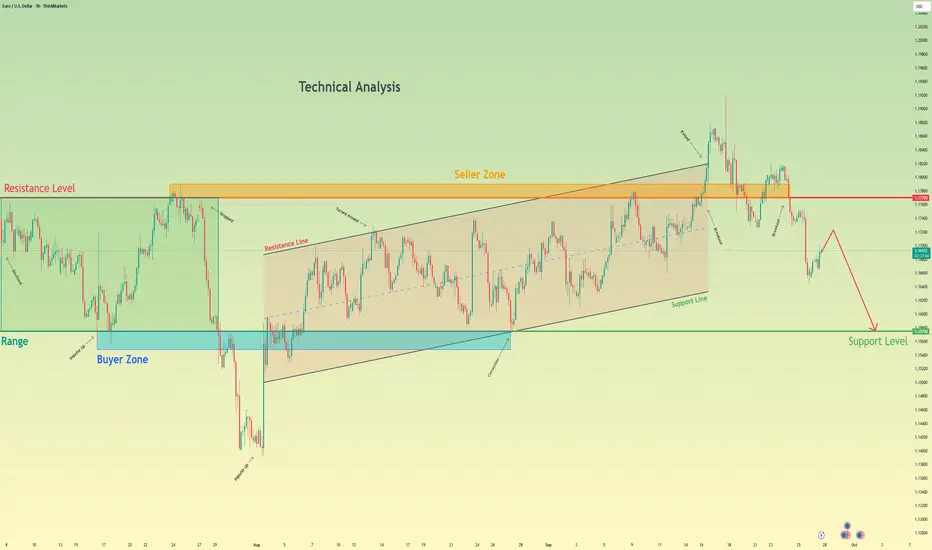
Euro will Fall Towards the 1.1575 Support LevelHello traders, I want share with you my opinion about Euro. The market for the Euro has recently shown a significant sign of weakness, with a failed breakout above the key 1.1770 Resistance Level. After a sustained rally within an upward channel, the price of EURUSD pushed into the 1.1770 - 1.1790 seller zone but failed to find acceptance, quickly reversing back below the broken levels. This 'bull trap' has invalidated the immediate bullish momentum and shifted the short-term market structure to a bearish bias. Currently, after the initial sharp decline from the highs, the asset is in a minor corrective bounce. In my mind, this price action represents a low-momentum pause before the next wave of selling. I expect that this small upward movement will soon be exhausted, and the price will continue its bearish movement downwards. A failure to produce a strong rally from these levels confirms that sellers have regained control. Therefore, I have placed my TP for this trend-continuation scenario at the major 1.1575 support level. This target is a logical objective, as it represents the next significant area of historical support and aligns with the 1.1575 - 1.1548 buyer zone. Please share this idea with your friends and click Boost 🚀
Disclaimer: As part of ThinkMarkets’ Influencer Program, I am sponsored to share and publish their charts in my analysis.
Gold can Resume its Uptrend After This CorrectionHello traders, I want share with you my opinion about Gold. The market context for Gold has been firmly bullish since the price action reversed from the deep 3335 - 3355 buyer zone, a move which established the current, well-defined upward channel. This bullish structure has since been guiding the price of XAU higher through a series of impulsive moves and corrective pullbacks, confirming that buyers are in control of the dominant trend. Currently, after testing the upper boundary of the channel, the asset is undergoing a healthy correction. This pullback is now guiding the price towards a critical confluence of support, where the ascending support line of the channel meets the horizontal support zone around the 3675 current support level. In my mind, this pullback is a classic trend-continuation opportunity. I expect that the price will find strong support in this area and bounce from the channel's support line. I think this rebound will signal the end of the correction and the resumption of the primary upward trend. Therefore, I have placed my TP at 3820, a target representing a new structural high and a logical objective for the next impulsive wave. Please share this idea with your friends and click Boost 🚀
Disclaimer: As part of ThinkMarkets’ Influencer Program, I am sponsored to share and publish their charts in my analysis.

BTCUSD Short: Fading the Rally in a Bear ChannelHello, traders! The price auction for BTCUSD has been in a clear bearish phase since its rejection from the SUPPLY ZONE 2 near 115200. This has established a well-defined descending channel that has been guiding the price lower through a series of impulsive declines and corrective rallies, confirming that sellers have the initiative.
Currently, after testing the lower support line of the channel, the price is in the midst of a corrective bounce. This upward move is carrying the auction towards the upper boundary of the channel, which represents a major area of dynamic resistance.
My scenario for the development of events is that this corrective rally will fail upon testing the channel's resistance line, which aligns with the SUPPLY ZONE around the 111000 level. I expect this area to hold as strong resistance, causing a rejection and a continuation of the primary downtrend. The take-profit is therefore set at 107000, targeting a new lower low within the channel. Manage your risk!

EURUSD Long: Reversal from Wedge Support ExpectedHello, traders! The prior market structure for EURUSD was a bullish ascending channel, which concluded with a pivot point high at the SUPPLY 2 level of 1.1835. A subsequent breakdown from that channel shifted the market's momentum, initiating a corrective phase that has since taken the form of a downward wedge, guiding the price lower.
Currently, the price auction has completed another leg down within this wedge and is now at a critical inflection point. The price is directly testing the descending support line of the formation, a key area where a bullish reversal could originate. This represents a major test of the prevailing bearish momentum.
My scenario for the development of events is a bullish reversal from the support of this downward wedge. I expect the price to find strong support at the current demand line and initiate a new rally. In my opinion, this move will be strong enough to break through the immediate SUPPLY at 1.1690 and continue towards the upper resistance line of the wedge. The take-profit is therefore set at 1.1755, targeting that upper boundary. Manage your risk!

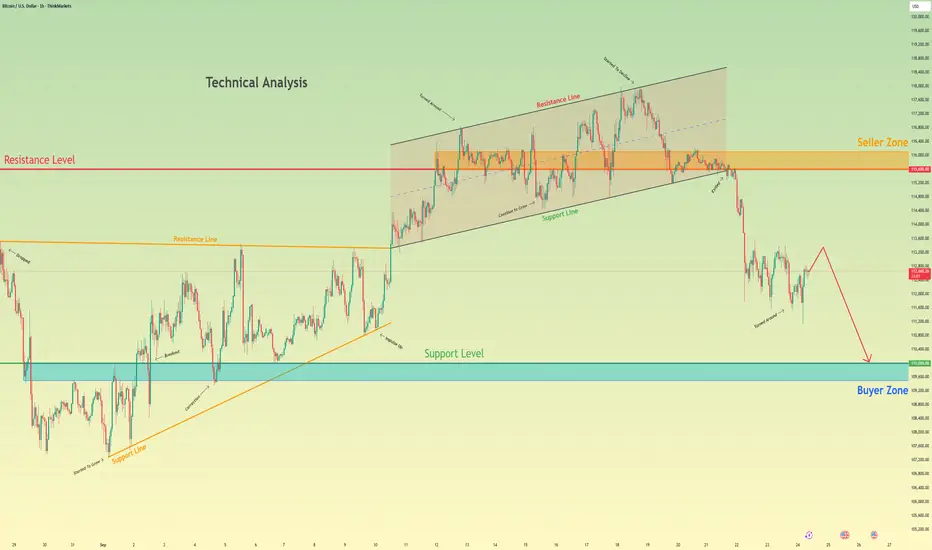
Bitcoin can Continue to Decline to Support LevelHello traders, I want share with you my opinion about Bitcoin. The market structure for Bitcoin has recently shifted to a bearish bias following a significant breakdown from its prior upward channel. After a complex consolidation within a triangle, the price of BTC made a final push to the highs near the 115600 seller zone before being strongly rejected, which led to the failure of the channel's support. This structural break initiated a new bearish phase, causing a sharp decline to a recent low of 111600. Currently, the asset is in a small consolidation, attempting a minor corrective bounce after the significant fall. In my mind, this consolidation is simply a pause before the next wave of selling pressure resumes. I expect that this small upward movement will soon be exhausted and that the price will continue its bearish movement downwards. A failure to produce a strong rally from these levels confirms that sellers remain in control of the market. Therefore, I have placed my TP for this trend-continuation scenario at the major 110000 support level. This target is a logical objective, as it represents the next significant area of historical support and aligns with the 110000 - 109500 buyer zone. Please share this idea with your friends and click Boost 🚀
Disclaimer: As part of ThinkMarkets’ Influencer Program, I am sponsored to share and publish their charts in my analysis.
MARKET UPDATE BTC/USDT 25/09/2025📊BTC/USDT Update
On the low time frame, BTC has broken down and failed to reclaim the 113,223 – 114,019 zone.
This breakdown signals loss of the cycle structure, confirming that the previous bullish cycle has ended.
Key levels:
113,223 – 114,019 → resistance zone. As long as BTC remains below this, the structure stays bearish.
111,900 → current trading area, under pressure.
Upside scenario: BTC would need to reclaim 113,223 first, and then confirm above 114,019, to even consider restarting an uptrend cycle. Without that, upside potential remains very limited.
Downside risk: Staying below 113,223 keeps BTC in breakdown mode, with increased probability of further decline toward 110,000 – 108,000.
📌 Summary
BTC lost the cycle support → bearish confirmation.
Reclaim above 114,019 is required to regain bullish momentum.
As long as BTC trades below 113,223, the bias remains bearish with downside risk.

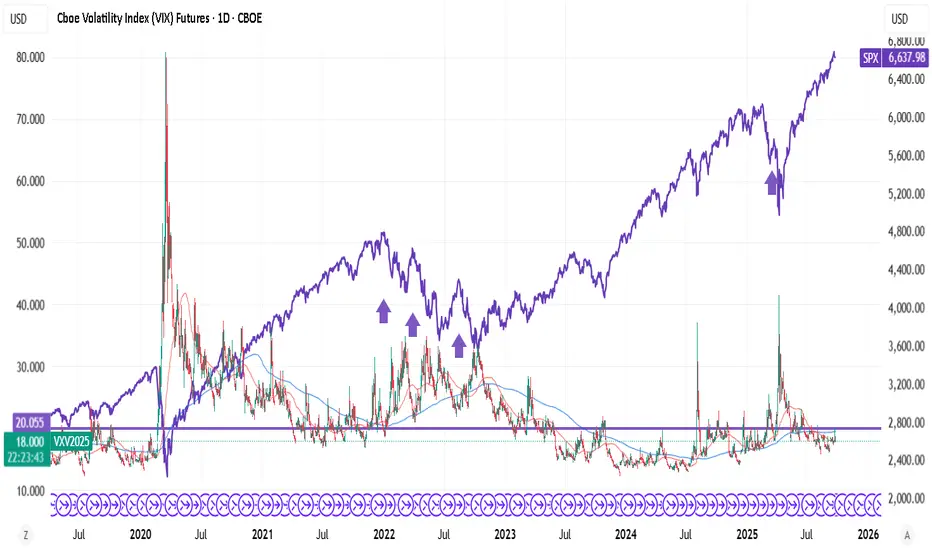
VIX FUT trending above 20 - high probability SPX crash indicatorVIX never trends above 20. You lose money buying VIX FUT above 20.
In nutshell, VIX FUT supporting at 20 is a guaranteed crash - for low risk positions.
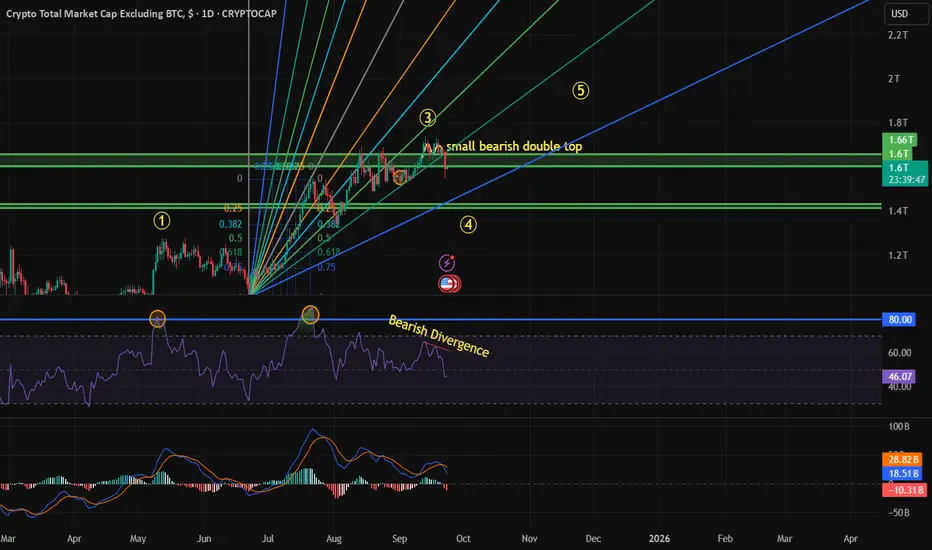
Altcoin Market Correction Underway – Final wave is coming!The total crypto market cap excluding BTC has likely completed Wave 3. At the end of Wave 3, a small bearish double top appeared, and the RSI confirmed weakness with a bearish divergence. During Wave 1, the RSI crossed 80. During Wave 3 going up, the RSI crossed 80 again and reached 86, which indicated that the uptrend would continue. However, at the peak of Wave 3, the divergence suggests exhaustion.
On the Fibonacci speed resistance band, drawn from the end of Wave 2, the price already broke below the 0.618 level. At the same time, BTC dominance broke its downtrend line and increased by more than 1 percent and breaking 0.618 fib resistance, showing capital rotation back to Bitcoin.
All these signals point to the start of Correction wave, the nearest strong support is the 1.42-1.43 trillion (speculative to reach those levels) bulls could push higher before reaching those, BTC correction wave is still ongoing aswell
UDS - Correction Inside an Uptrend: Eyes on 1.45–1.35UDS remains overall bullish on the 4H , riding a rising channel. After the impulse, price is drifting in a falling channel and inching toward the lower blue trendline.
The 1.45–1.35 area is key 🔑. It lines up with channel support and a prior structure base—clean confluence for buyers to step in. As long as it holds, I’ll look for trend-following longs toward 1.80 first, then 2.00–2.20 on momentum 🚀.
If 1.35 breaks and holds, I’ll step aside and reassess a deeper pullback toward 1.25 before looking for fresh confirmation ⏳.
What’s your move here => buy the dip at confluence or wait for a break of the red channel before joining? 🤔
⚠️ Disclaimer: This is not financial advice. Always do your own research and manage risk properly.
📚 Stick to your trading plan regarding entries, risk, and management.
Good luck! 🍀
All Strategies Are Good; If Managed Properly!
~Richard Nasr

EURUSD: Dip and Bounce from Triangle SupportHello everyone, here is my breakdown of the current Euro setup.
Market Analysis
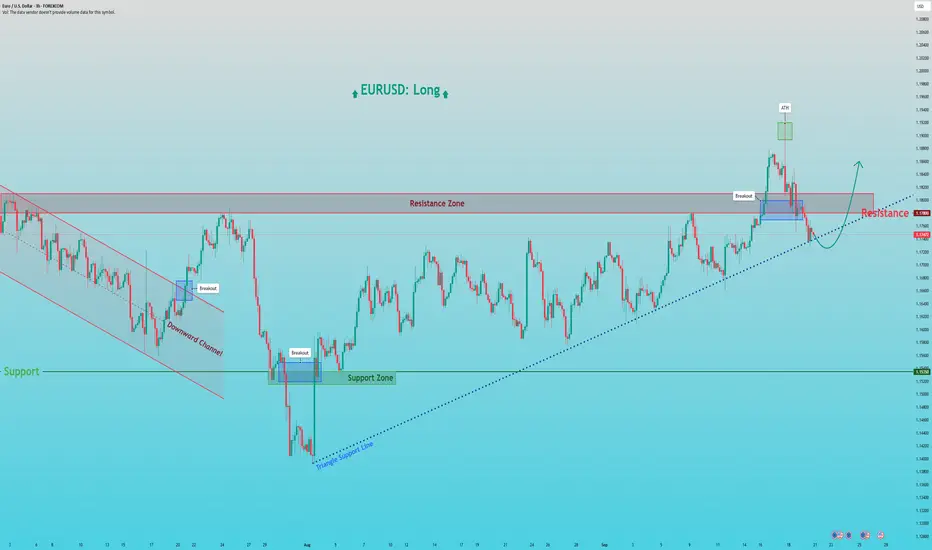
After reversing from a prior Downward Channel, EURUSD has been consolidating in a large Upward Triangle. This pattern is typically bullish and is defined by a flat horizontal Resistance at the 1.1780 level and an ascending support line, showing that buyers are becoming progressively more aggressive on each dip.
An interesting part of this pattern's history is the 'fake breakout' we saw previously, where the price spiked to a local ATH at 1.1920 before falling back inside. Currently, the price is again in a corrective pullback, heading towards the ascending Triangle Support Line for another test.
My Scenario & Strategy
My scenario is based on the expectation that this Upward Triangle will eventually resolve to the upside. I'm looking for the price to complete its downward movement and find strong support on the ascending Triangle Support Line. A confirmed bounce from this line would be the key signal that buyers are stepping in to defend the trend.
Therefore, the strategy is to watch for this bounce. A successful rebound that finally leads to a decisive breakout above the Resistance Zone would validate the long scenario. The primary target for the subsequent expansion is 1.1860, a logical objective for the move that would follow.
That's the setup I'm tracking. Thank you for your attention, and always manage your risk.
EURUSD Long: Rally Continues in Ascending ChannelHello, traders! The prior price auction for EURUSD was dominated by a wide consolidation range, bounded by the demand zone 2. Within this range, a new bullish structure began to form as an ascending channel, which eventually gathered enough momentum to break out and confirm a new uptrend, shifting market control to the buyers.
Currently, the price action continues to be guided by this ascending channel. Following a recent test of the upper price levels, the market has entered a corrective phase. The auction is now pulling back towards a significant confluence of support, located near the 1.1740 DEMAND level, which also aligns with the channel's dynamic support line.
My scenario for the development of events is a continuation of the uptrend after this correction completes. I expect the price to find strong support at the confluence of the channel's demand line and the 1.1740 - 1.1760 DEMAND ZONE. In my opinion, a confirmed bounce from this area will signal the end of the pullback and trigger the next impulsive move higher. The take-profit is therefore set at 1.1865, an intermediate target within the channel's structure. Manage your risk!

Euro can Bounce From Wedge Support and Rally to 1.1930Hello traders, I want share with you my opinion about Euro. The market for the Euro has transitioned from a clear trending phase into a more complex corrective structure after the prior upward channel failed to sustain its momentum. Following a significant rejection, the price broke down and underwent a deep correction, which was ultimately absorbed by the major 1.1430 - 1.4000 buyer zone. This level served as a critical pivot, halting the decline and initiating the current market phase, which has taken the form of a large upward wedge. The price action for EURUSD has since been contained within this new pattern, rotating between its ascending support and resistance lines. Currently, the asset is at a key inflection point, having completed a corrective swing down to test the ascending support line of this wedge. In my mind, this sets up a long, rotational scenario. I expect that buyers will defend this dynamic support. A confirmed bounce from this support line would validate the integrity of the wedge and signal the start of a new rally towards the upper boundary. Therefore, I have placed my TP at 1.1930, a target that aligns perfectly with the resistance line of the wedge. Please share this idea with your friends and click Boost 🚀
Disclaimer: As part of ThinkMarkets’ Influencer Program, I am sponsored to share and publish their charts in my analysis.

Gold can continue its bullish trend after small correctionHello traders, I want share with you my opinion about Gold. The market context for Gold has been firmly bullish since the price broke out of its prior consolidation range, a move that originated from the deep 3270 - 3290 buyer zone. This breakout shifted the market structure, initiating a new impulsive phase that has since been guided by a major ascending mirror line. The price action for XAU has been respecting this dynamic support, creating a clear sequence of higher highs and higher lows. Currently, after reaching a new local high, the asset is undergoing a healthy corrective phase. This pullback is guiding the price back towards a critical confluence of support, defined by the 3622 - 3598 support zone and the ascending mirror line itself. The primary working hypothesis is a long, trend-continuation scenario, which anticipates that buyers will step in to defend this key support cluster. A confirmed bounce from this area would signal the conclusion of the corrective move and the resumption of the dominant upward trend. This would likely initiate the next impulsive wave higher. Therefore, the TP is logically placed at 3720, representing a new potential structural high. Please share this idea with your friends and click Boost 🚀
Disclaimer: As part of ThinkMarkets’ Influencer Program, I am sponsored to share and publish their charts in my analysis.

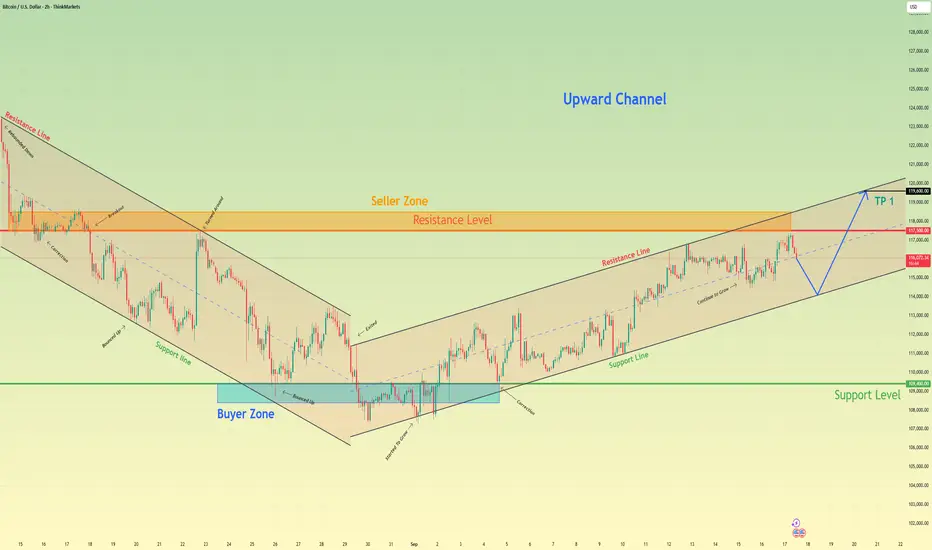
Bitcoin will break resistance level and continue to move upHello traders, I want share with you my opinion about Bitcoin. The market dynamic for Bitcoin has undergone a significant shift, with the prior bearish trend being invalidated by a strong breakout from a downward channel. This reversal has established a new bullish market structure, with the price action for BTC now being methodically guided higher within a well-defined upward channel. This pattern has been confirmed by multiple rotations between its support and resistance boundaries, originating from the 108400 - 109400 buyer zone. Currently, the asset is undergoing a healthy correction after testing the upper part of the channel, and the price is now approaching a critical confluence of support. This area is defined by the ascending support line of the channel and the major horizontal 109400 support level. The primary working hypothesis is a long, trend-continuation scenario, anticipating that buyers will defend this support confluence. A confirmed bounce from this area would signal the end of the correction and the resumption of the primary upward trend. This move is expected to break through the intermediate 117500 resistance level. Therefore, the TP is logically placed at 119600, targeting the upper resistance line of the channel. Please share this idea with your friends and click Boost 🚀
Disclaimer: As part of ThinkMarkets’ Influencer Program, I am sponsored to share and publish their charts in my analysis.
BTCUSD: Price Exit from Triangle and Reach Resistance LevelHello everyone, here is my breakdown of the current Bitcoin setup.
Market Analysis
From a broader perspective, the price of Bitcoin has been consolidating within a wide Range, oscillating between the major Support zone around the 109500 level and the Resistance Zone up to 121200. This lengthy period of balance has now tightened into a more defined triangle pattern, suggesting energy is building.
Currently, the price is coiling within the final stages of this triangle, a classic sign of volatility compression. After a recent test of the upper resistance line, the price is in a corrective pullback, heading towards the ascending support line for what I see as a key test of buyer strength.
My Scenario & Strategy
I'm looking for the price to complete its corrective move and find strong support on the ascending Triangle Support Line. A confirmed bounce from this dynamic support would be the key signal that the next impulsive move up is about to begin, with the goal being a breakout from the top of the triangle.
Therefore, the strategy is to watch for this bounce. A successful rebound that leads to a breakout above the Resistance Zone would validate the long scenario. The primary target for this breakout move is the 120000 Resistance level.
That's the setup I'm tracking. Thank you for your attention, and always manage your risk.

EURUSD: Correction will ContinuesHello everyone, here is my breakdown of the current Euro setup.
Market Analysis
From a broader perspective, we saw a significant bullish impulse on EURUSD after the price broke out of a multi-week upward wedge. This breakout carried the price well above the Support 1 level at 1.1780, culminating in a new local All-Time High before entering a corrective phase.
Following that peak, the market has pulled back and is now consolidating. Currently, it appears that the price is attempting to build support for another move higher, likely to re-challenge the recent highs.
My Scenario & Strategy
My scenario is a bearish one, built on the expectation of a failed retest of the recent ATH. I'm looking for the price to make one more push upwards towards the recent ATH. The key signal for this short idea would be a clear and strong rejection from that high, showing that buyers no longer have the strength to continue the trend.
Therefore, the strategy is to watch for this failure at the highs. A confirmed reversal would validate the short scenario. The primary target for the subsequent decline is the 1.1795 support zone, which aligns with the Support zone 1 area.
That's the setup I'm tracking. Thank you for your attention, and always manage your risk.

EURUSD Long: Correction Before Impulse UpHello, traders! A large upward wedge pattern has defined the price auction for EURUSD. This bullish structure has been formed by a series of higher highs and higher lows, with key pivot points establishing the diverging supply and demand lines. The auction has been rotating between the demand zone 2 and the supply zone near the 1.1780 level.
Currently, following a rejection from the wedge's upper supply line, the price has entered a corrective phase. This pullback is guiding the auction towards a significant confluence of support. The price is now approaching the ascending demand line, a key area where buyers have previously shown initiative and are expected to defend the trend.
The primary scenario anticipates a successful defense of this ascending demand line. A confirmed bounce from this dynamic support would validate the integrity of the upward wedge and signal that the bullish initiative is ready to resume. This is expected to trigger a full rotation back to the top of the pattern, breaking through the 1.1780 demand level. The take-profit is therefore set at 1.1810, targeting the upper supply line of the wedge. Manage your risk!

Gold Pulls Back Within UptrendGold pushed higher to the upper side of the triangle this month, and then also broke above the 3450 area, above both waves D and B swing points. This suggests the contracting range since May is finished and we are now in a new bullish phase, likely the fifth wave on the higher time frame chart. We see metal now in the third subwave of this fifth wave, extending now to 261.8% Fib target. So gold is clearly in an uptrend as long as we trade above 3400, but keep in mind that this higher-degree fifth wave could complete the bull run from the 2023 lows within the next few weeks. But we are not in that final stage yet, looks like more upside after intraday sub wave four pullback., First support is at 3579-3600. So after some slow-down, gold is expected to stay up.

XAUUSD Short: Awaiting Rejection from the Supply LineHello, traders! The price auction for XAUUSD has been defined by a broadening wedge pattern, signaling a period of expanding volatility. This structure has been formed by a series of higher highs and lower lows, with key pivot points establishing the diverging supply and demand lines. This indicates a fierce but structured battle between buyers and sellers within a clear range.
Currently, the auction is at a critical inflection point at the top of this wedge. Following a strong rally from the demand line, the price is now directly testing the descending supply line. This is a high-liquidity area where seller initiative has previously overwhelmed buyers, making it a key decision point for the market.
The primary scenario anticipates a rejection from this supply line, continuing the rotational pattern within the wedge. The expectation is that sellers will defend this upper boundary and initiate a new downward swing back towards support. A failure to break out higher would confirm the short-term corrective scenario. The take-profit is therefore set at 3595, targeting the upper part of the first major demand zone. Manage your risk.

Gold will correct to support area and then continue to growHello traders, I want share with you my opinion about Gold. The market context for Gold has been firmly bullish, with the price action being guided by a well-established upward channel that has defined the trend for a significant period. The structure of this channel has been confirmed by multiple rotations between its support and resistance lines, originating from the deep 3370 - 3390 buyer zone. Currently, after a rejection from the channel's highs, the price of XAU is undergoing a healthy corrective phase. This pull-back has brought the asset into a critical confluence of support, defined by the 3635 - 3615 support zone and the ascending support line of the channel itself. The primary working hypothesis is a long, trend-continuation scenario, which anticipates that buyers will step in to defend this key support cluster. A confirmed bounce from this area would signal the conclusion of the corrective move and the resumption of the dominant upward trend. This would likely initiate the next impulsive wave higher within the channel's structure. Therefore, the TP is logically placed at 3740 points, representing a new potential structural high and a measured objective for the next impulsive wave. Please share this idea with your friends and click Boost 🚀
