EURUSD - Follow The Bulls Indeed!Hello TradingView Family / Fellow Traders. This is Richard, also known as theSignalyst.
📈EURUSD has been overall bullish trading within the rising channel marked in blue.
This week, EURUSD has been retesting the lower bound of the channel.
Moreover, the orange zone is a strong demand.
🏹 Thus, the highlighted blue circle is a strong area to look for buy setups as it is the intersection of the lower blue trendline and orange demand.
📚 As per my trading style:
As #EURUSD approaches the blue circle zone, I will be looking for trend-following bullish reversal setups (like a double bottom pattern, trendline break , and so on...)
📚 Always follow your trading plan regarding entry, risk management, and trade management.
Good luck!
All Strategies Are Good; If Managed Properly!
~Richard Nasr
Correction

XAUUSD Short: Correction After the All-Time HighHello, traders! The prior market structure for XAUUSD was a prolonged consolidation range, from which the price broke out with significant bullish momentum. This breakout initiated a powerful upward trend, with the price auction pushing through multiple resistance levels to establish a new all-time high. This marked the climax of the recent buying initiative.
Currently, following the peak at the ATH, the market has entered a corrective phase. Sellers have taken control in the short term, and the price is now declining from the highs. The auction is presently challenging the first major demand zone located between 3585 and 3570, but the bearish momentum appears strong.
The primary scenario anticipates a continuation of this corrective move. The expectation is that the current 3570 demand level will fail to hold against the selling pressure. A confirmed breakdown below this demand zone would validate the short thesis and open the path for a deeper correction towards the main ascending trend line. The take-profit is therefore set at 3565, targeting the area immediately following this breakdown. Manage your risk!

Ripple Finished A Correction Within Bullish TrendRipple Finished A Correction Within Bullish Trend, as we see it recovering in an impulsive fashion, which can extend the rally from technical perspective and by Elliott wave model.
Ripple with ticker XRPUSD is waking up from projected support after an ABC correction in wave IV, so bulls could be back, as we see it breaking above channel resistance line and important 3.08 level. So after current short-term pullback, we may see more gains and another push toward all-time highs for wave V, possibly to the 4-5 area.

Bitcoin will start to correction after touching resistance levelHello traders, I want share with you my opinion about Bitcoin. The established market structure for Bitcoin remains bullish, with the price action being methodically guided higher within a well-defined upward channel. This pattern has been in effect since the resolution of a prior upward wedge, creating a clear sequence of higher highs and higher lows between its support and resistance lines. The price of BTC has just completed another full rotation from the channel's support and has now arrived at a critical inflection point. Currently, the asset is directly testing the upper boundary of the channel, a level which forms a powerful confluence of resistance with the horizontal 118200 - 117200 seller zone. The primary working hypothesis is a short, corrective scenario, based on the high probability that the channel's resistance will be respected. A confirmed rejection from this area would signal that the current upward impulse is exhausted and a downward rotation towards the channel's support is underway. Therefore, the TP for this rotational play is logically placed at 112200 points. This target aligns perfectly with the ascending support line of the channel, representing the most probable objective for a corrective move of this nature. Please share this idea with your friends and click Boost 🚀
EURUSD Short: Rejection from Channel ResistanceHello, traders! The price auction for EURUSD has been in a bullish phase, with the market structure being defined by a large upward wedge. This pattern has been guiding the price higher through a series of higher highs and higher lows, but such formations often signal that the underlying trend is losing momentum and may be approaching a point of exhaustion.
Currently, the price action is at a critical inflection point, testing the upper resistance line of this multi-week wedge. The auction is being squeezed into the apex of the pattern, a situation that typically precedes a volatile move. This is a key area where sellers are expected to challenge the bullish initiative and attempt to take control.
The primary scenario anticipates a bearish resolution to this upward wedge. The expectation is that the price will be rejected from the resistance line, triggering a sharp reversal. This move is expected to have sufficient momentum to break down below the wedge's ascending support line, confirming a structural shift. The take-profit for this breakdown scenario is therefore set at the 1.16800 support level, which is also the upper boundary of the current demand zone. Manage your risk!

Euro will reach seller zone and then start to fallHello traders, I want share with you my opinion about Euro. The market for the Euro is currently positioned at a critical inflection point, as a prolonged period of consolidation appears to be nearing its resolution. After transitioning from a prior downward channel, the price action for EURUSD has been contained within a large symmetrical triangle, a pattern of contracting volatility. This structure has been defined by a clear descending resistance line and an ascending support line, anchored by the major seller zone and the buyer zone. At present, the asset has rallied from the support line and is now directly testing the upper boundary of this triangle. This area represents a powerful confluence of resistance, where the dynamic trendline meets the horizontal seller zone near the 1.1730 Resistance Level. The primary working hypothesis is a short, rotational scenario, based on the expectation that this resistance will hold. A confirmed rejection from this 1.1730 - 1.1750 area would validate the integrity of the triangle and signal that another major swing to the downside is underway. Therefore, the TP is logically placed at 1.1620 поинтов, a key target located in a high-liquidity area on the path towards the main 1.1575 support level. Please share this idea with your friends and click Boost 🚀

Gold will bounce from support area and continue to riseHello traders, I want share with you my opinion about Bitcoin. The market context for Gold remains firmly bullish, with the price action being guided by a well-established upward channel that has defined the trend for a significant period. The structure of this channel has been confirmed by multiple rotations between its support and resistance lines, originating from the deep buyer zone near the 3390 support level. Currently, after a rejection from the channel's highs, the price of XAU is undergoing a healthy corrective phase. This pullback has brought the asset into a critical confluence of support, defined by the 3630 - 3615 support area and the ascending support line of the channel itself. The primary working hypothesis is a long scenario, which anticipates that buyers will step in to defend this key support cluster. A confirmed bounce from this area would signal the conclusion of the corrective move and the resumption of the dominant upward trend. This would likely initiate the next impulsive wave higher within the channel's structure. Therefore, the TP is logically placed at 3735 points, a target that aligns with the upper resistance line of the channel and represents a new potential structural high. Please share this idea with your friends and click Boost 🚀

BTCUSD: Consolidation will ContinueHello everyone, here is my breakdown of the current Bitcoin setup.
Market Analysis
From a broader perspective, the market for Bitcoin has shifted from a trending phase into a wide consolidation Range. This occurred after the price broke down from a prior Upward Wedge, signaling a pause in the bullish momentum and establishing the current boundaries between the 107700 Support and the 119000 Resistance.
Currently, the price has completed a full rotation from the bottom of this Range and is now approaching the major horizontal Resistance at the 119000 level. This is a historically significant area that has repeatedly capped rallies and acted as a strong barrier for buyers.
My Scenario & Strategy
I'm anticipating that the price will make a final push into the 119800 - 119000 Resistance Zone. The key signal I'm watching for is a clear rejection from this area, confirming that sellers are still in control at these prices and that another rotation downwards is likely.
Therefore, the strategy is to watch for this rejection at the top of the Range. A confirmed reversal would validate the short scenario. The primary target for this downward rotation is 111000 points, an intermediate level within the Range where a price reaction could be expected.
That's the setup I'm tracking. Thank you for your attention, and always manage your risk.

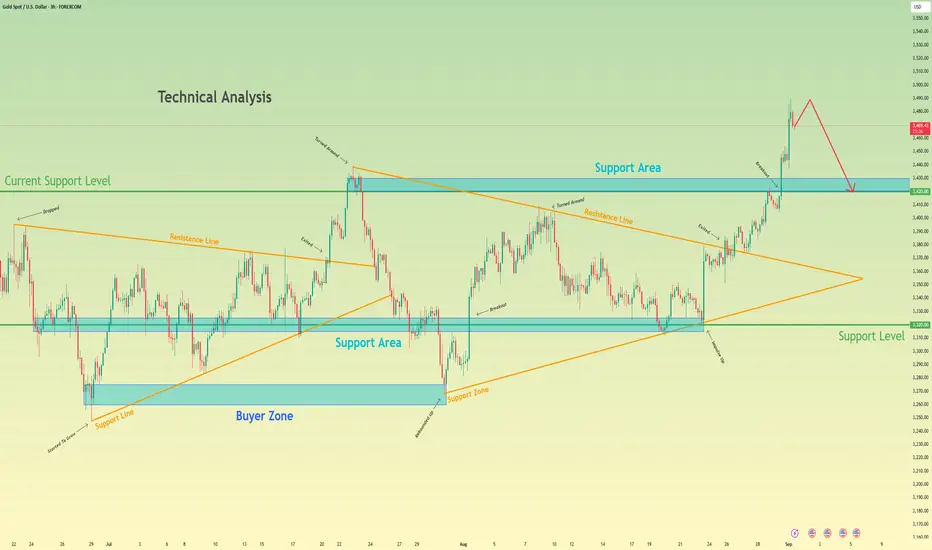
XAUUSD: Rully Will Continue in ChannelHello everyone, here is my breakdown of the current Gold setup.
Market Analysis
From a broader perspective, the price of Gold has been in a strong and sustained uptrend for some time. This entire bullish phase has been neatly contained within a well-defined Upward Channel, which has been guiding the price through a series of higher highs and higher lows, establishing a clear bullish market structure.
Currently, the price is trading in the upper half of this channel, consolidating after its most recent push higher. The momentum appears to be pausing, which is a normal and healthy sign in a sustained trend. This pause often precedes a brief corrective move before the next leg higher.
My Scenario & Strategy
My scenario is based on the expectation that this dominant uptrend will continue to be respected. I am looking for the price to make a small corrective dip from its current position.
Therefore, the strategy is to watch for this bounce as a potential entry to rejoin the trend. A confirmed rebound would validate the long scenario. The primary target for the next impulsive wave higher is 3710 points, aiming for a new high within the channel's structure.
That's the setup I'm tracking. Thank you for your attention, and always manage your risk.

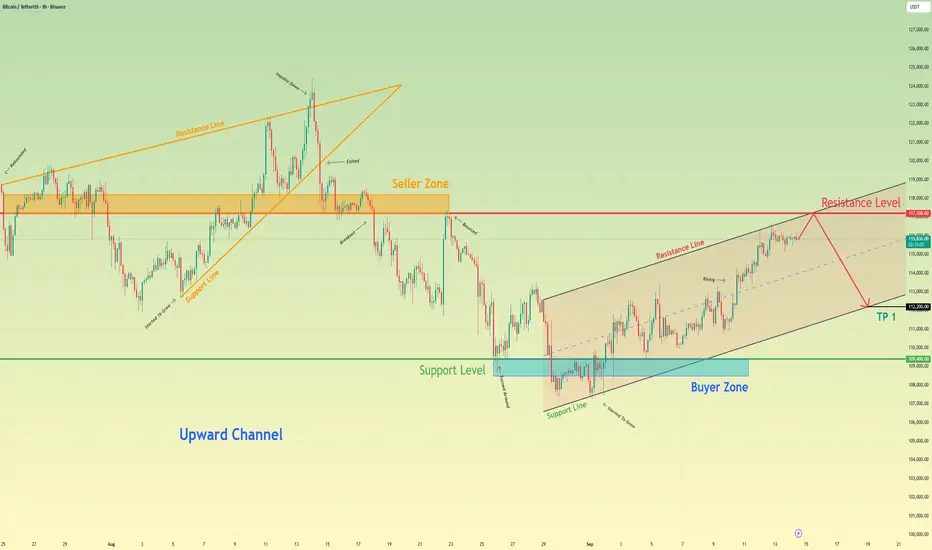
BTCUSD Short: A Corrective Decline is AnticipatedHello, traders! The price auction for BTCUSD has been clearly defined by a large ascending channel. This bullish structure has guided the price higher through a series of higher highs and higher lows, with the demand zone 2 at the 110000 level acting as a major foundational low. The initiative has remained firmly with the buyers throughout this trend.
Currently, the auction is at a critical inflection point, having reached the upper supply line of the ascending channel. This test of the highs comes after a sustained rally, and the market is now in a key area where selling pressure is expected to emerge. This price action could indicate a phase of trend exhaustion.
The primary scenario anticipates a short-term corrective move from these highs. The expectation is that after a potential final push higher, the price will be rejected from the channel's resistance. A confirmed reversal would signal a temporary shift in control to sellers. The take-profit for this corrective play is therefore set at the 113400 level, targeting the major horizontal demand zone. Manage your risk!

Bitcoin will reach resistance line of channel and then dropHello traders, I want share with you my opinion about Bitcoin. The current market structure for Bitcoin is defined by a well-established upward channel that was formed after the price broke out of a prior triangle consolidation. This bullish pattern has been guiding the price action of BTC higher through a clear sequence of higher highs and higher lows between its dynamic support and resistance lines. The market has just completed another full upward rotation within this structure and is now positioned at a critical inflection point. Currently, the price is directly testing the upper boundary of the channel, which forms a powerful confluence of resistance with the horizontal 113500 - 114000 seller zone. This area has historically been a strong barrier where price has reversed on previous occasions. The primary working hypothesis is a short, rotational scenario, based on the expectation that sellers will once again defend this significant resistance confluence. A confirmed rejection from this seller zone would validate the integrity of the upward channel and likely initiate a new corrective swing to the downside, which would first need to break the current support level at 113500. Therefore, the TP is logically placed at 112400 points, a target that aligns perfectly with the ascending support line of the channel. Please share this idea with your friends and click Boost 🚀

XAUUSD Long: Upward Rully Will ContinueHello, traders! The price auction for XAUUSD has been in a clear bullish phase, with the market structure defined by a well-established ascending channel. This pattern originated from a pivot point low near the DEMAND ZONE 2 and has since guided the price higher through a series of impulsive and corrective waves, confirming that buyers have maintained the initiative.
Currently, following a test of the channel's upper boundary, the price has entered a corrective phase. This pullback is guiding the auction towards a significant confluence of support located around the 3620 DEMAND level. This DEMAND ZONE is critical as it represents the intersection of a horizontal support area and the dynamic support line of the ascending channel.
The primary scenario anticipates a successful defense of this support confluence. A confirmed bounce from the channel's demand line would validate the integrity of the uptrend and signal that the corrective phase is over. This is expected to trigger the next impulsive wave higher within the channel's structure. The take-profit is therefore set at 3705 points, targeting a new structural high just below the channel's upper resistance line. Manage your risk!

EURUSD: Price Exit from Triangle and Start FallHello everyone, here is my breakdown of the current Euro setup.
Market Analysis
From a broader perspective, EURUSD has been in a prolonged consolidation phase, forming a large symmetrical triangle. The price has been coiling between the major Support zone around the 1.1580 level and the key Resistance Zone up to the 1.1755 area, indicating a long period of market balance.
Currently, the price is at a critical decision point, trading at the apex of this triangle. It is directly challenging the descending resistance line, and the contracting volatility suggests a powerful, decisive move is on the horizon for the market.
My Scenario & Strategy
My scenario is built around the idea of a potential 'bull trap' or a failed breakout. While the price may initially break the triangle's resistance line, I believe the major Resistance Zone between the 1.1735 and 1.1755 area will hold firm, as it has done in the past.
I'm looking for the price to push above the trendline and into the Resistance Zone, which would likely trap optimistic buyers. The key signal would be a swift and forceful rejection from this area, pushing the price back down below the breakout point and eventually below the triangle's ascending support line. The primary target for this move is 1.1640, an objective below the current consolidation.
That's the setup I'm tracking. Thank you for your attention, and always manage your risk.

EURUSD Short: Price Reverse and Start FallHello, traders! The price auction for EURUSD has been operating within a well-defined ascending channel for several weeks. This bullish structure has been confirmed by multiple pivot points, with buyers defending the ascending demand line and sellers consistently emerging at the upper supply zone near the 1.1715 level. This has established a clear rotational pattern between the channel's boundaries.
Currently, the auction is at a critical inflection point, once again testing the upper boundary of this channel. The price has rallied to meet the ascending supply line, which forms a strong confluence of resistance with the horizontal 1.1715 - 1.1740 supply area. This is the same zone where previous rallies have failed, making it a key battleground.
The primary scenario anticipates a rejection from this resistance confluence, continuing the established pattern of rotation. The expectation is that sellers will defend the supply zone and initiate a new downward move back towards the channel's support. A failure to break out higher would confirm a short-term correction is underway. The take-profit for this rotational play is therefore set at 1.1605 points, targeting the ascending demand line of the channel. Manage your risk!

Gold may move up a little and then start to declineHello traders, I want share with you my opinion about Gold. The market for Gold has transitioned from a prolonged balancing phase into a strong directional trend, following a decisive breakout from its prior multi-week big range. This breakout, originating from the support area near the 3445 level, shifted market control firmly to buyers and initiated a new impulsive phase. The price action for XAU since then has been characterized by a steep, high-momentum rally, which is being guided by an ascending mirror line. Currently, the asset is at a new high, continuing to push upwards along this aggressive trendline. However, such accelerated trends are often unsustainable and can signal that the market is becoming overextended and due for a correction. I expect that after a potential final push higher, the price will stage a sharp reversal, with enough selling pressure to cause a breakdown below the steep mirror line. A break of this dynamic support would be the first confirmation that a corrective phase has begun. Therefore, the TP for this corrective scenario is logically placed at 3520 points. Please share this idea with your friends and click Boost 🚀

XAUUSD Short: Correction Phase Will ContinueHello, traders! The prior market structure for XAUUSD was a bearish descending channel. This trend was decisively reversed by a bullish initiative from the pivot point low near the demand zone 2, which triggered a breakout and established the current bullish market phase, shifting control to the buyers.
Currently, the price auction is being guided by a well-defined ascending channel. A strong impulse has carried XAUUSD to the upper boundary of this channel, which represents dynamic resistance. The market is now testing this ceiling after a sustained rally, a key area where sellers may emerge to initiate a corrective phase against the dominant uptrend.
The primary scenario anticipates a short-term corrective move from the channel's resistance. The expectation is that the upper boundary will hold, leading to a rejection and a downward rotation back towards the channel's median. A failure to break higher would confirm that a temporary pause in the uptrend is likely. The take-profit is therefore set at 3555 points, targeting an intermediate liquidity level. Manage your risk!

EURUSD: Correction Before the Impulse UpHello everyone, here is my breakdown of the current Euro setup.
Market Analysis
From a broader perspective, after exiting a prior Upward Channel, the price action has entered a lengthy period of consolidation. This price action has been forming a large ascending triangle, which is typically a bullish continuation pattern. The boundaries are defined by the horizontal Resistance at the 1.1740 level and an ascending support line.
Currently, the price is trading in the upper portion of this triangle, having recently bounced from the ascending Triangle Support Line. We are now approaching the critical flat resistance at the 1.1740 level for another significant test. This Resistance Zone has successfully capped all rallies for several weeks.
My Scenario & Strategy
My scenario is built on the idea of one final corrective dip before the potential bullish resolution of this triangle. I'm looking for the price to pull back from the current levels and make a move down to test the Triangle Support Line.
Therefore, the strategy is to watch for this bounce, which should then lead to a breakout above the 1.1740 Resistance. A confirmed break would validate the long scenario, with the primary target for the subsequent upward expansion set at 1.1840 points.
That's the setup I'm tracking. Thank you for your attention, and always manage your risk.

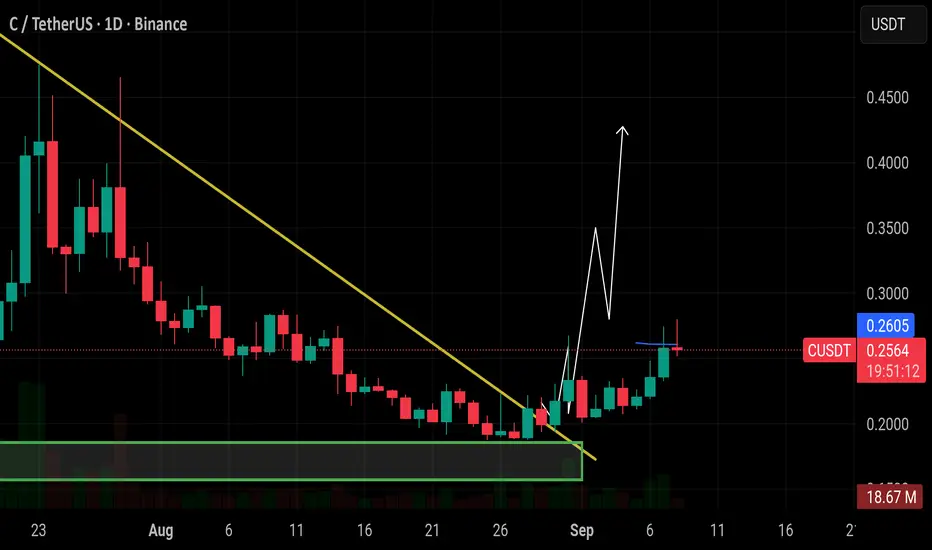
$C breakout retest played out perfectly — already up 30%+ $C breakout retest played out perfectly — already up 30%+ on spot and still showing strength. 🚀
EURUSD Long: Impulse Up from Demand Line of TriangleHello, traders! The price auction for EURUSD has been consolidating for an extended period, forming a large symmetrical triangle pattern. This structure signifies a period of balance and contracting volatility, with key pivot points establishing the upper supply line near the 1.1735 SUPPLY level and the lower demand line originating from the 1.1575 DEMAND level. The market has been coiling within these boundaries, building energy for a decisive move.
Currently, the auction is at a critical inflection point. Following a rejection from the supply line, the price has completed a full rotation to the downside and is now directly testing the ascending demand line. This area represents a key potential support, where the market will decide if the bullish initiative can absorb the recent selling pressure and maintain the pattern's integrity.
The primary scenario anticipates a successful defense of this ascending demand line by buyers. A confirmed bounce from this dynamic support would validate the triangle pattern and signal that a bullish rotation back towards the upper boundary is underway. The take-profit is therefore set at 1.1730 points, targeting the descending supply line of the triangle, which is the logical objective for this rotational play. Manage your risk!

XAUUSD: The Correction Phase BeginsHello everyone, here is my breakdown of the current Gold setup.
Market Analysis
From a broader perspective, the price of Gold has been in a strong uptrend since breaking out of a prior Downward Channel. This entire bullish phase has been developing within the confines of a large broadening wedge, a pattern that indicates expanding volatility as price makes higher highs and higher lows.
Currently, the price is at a critical point, testing the Broadening Resistance Line at the very top of this wedge. This test comes after a very strong and steep upward impulse, which often suggests that a trend might be overextended and due for a correction.
My Scenario & Strategy
My scenario is a tactical short, based on the idea that this strong rally is due for a healthy pullback. Trends rarely move in a straight line forever, and the resistance line of this multi-week wedge is a high-probability area for sellers to step in.
I'm looking for the price to make one final, small push higher and then show a clear sign of rejection. The primary target for this corrective fall is 3500 points. As you noted, this is an intermediate target, not the major Support 1, making it a logical first objective for a pullback.
That's the setup I'm tracking. Thank you for your attention, and always manage your risk.

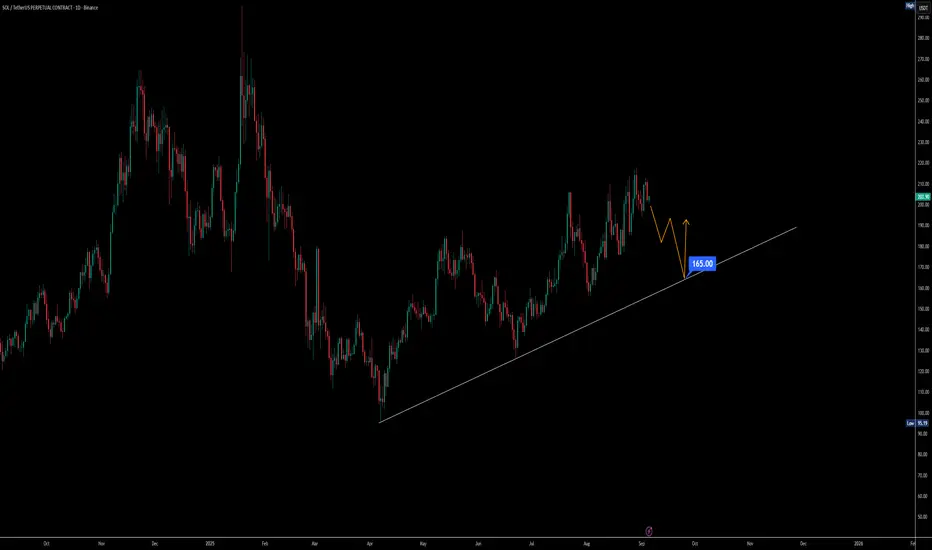
Solana momentum slowing correction to 165 or 100 possibleIf we look at Solana on the daily timeframe, the structure has been holding higher lows consistently, which shows strength. But the reality is that liquidity from the retail side is drying up while Bitcoin dominance keeps climbing. On top of that, today’s U.S. unemployment data will be a key driver. A stronger report could put pressure on the market and trigger a correction, while weaker numbers may shift sentiment but won’t erase the need for a healthy pullback.
Right now, both MACD and RSI, along with Stochastic RSI, are hinting at momentum exhaustion. Volume is steadily declining, which usually signals an upcoming correction phase. The critical zone to watch is around $165. If Solana holds this trendline support, the structure remains intact. But if this level breaks, the move could accelerate toward the $100 region — a deeper, more volatile correction.
Overall, I’m expecting September to deliver that correction. It’s not a bearish outlook but rather a needed reset. Without such a shakeout, the market won’t have the fuel to retest previous all-time highs or push into new ones. A correction here is not weakness — it’s preparation for the next strong rally.
EURUSD: Price Exit from Pennant and DropHello everyone, here is my breakdown of the current Euro setup.
Market Analysis
From a broader perspective, the price has been consolidating in a wide range between the 1.1600 support level and the 1.1720 resistance level. This extended period of balance has now tightened, leading to the current, more compressed pattern where a significant move is becoming more likely.
Currently, the price action is coiling within a pennant pattern. This compression of volatility suggests that energy is building for a breakout. The price is now trading very close to the apex of this pennant, testing the upper boundary near the major horizontal Resistance Zone.
My Scenario & Strategy
While a breakout from a pennant might seem likely, the overhead resistance at the 1.1720 level is historically significant. I'm watching for a situation where the market fakes a move to the upside to trap optimistic buyers before revealing its true intention.
Specifically, I'm watching for a brief dip, followed by a rally that pushes the price just above the pennant's resistance line and into the 1.1720 - 1.1730 resistance area. The key signal would be a swift and forceful rejection from this area, pushing the price back below the breakout point. And the primary target for the resulting decline is the 1.1600 level, which aligns with the major horizontal support zone.
That's the setup I'm tracking. Thank you for your attention, and always manage your risk.

Gold may make correction, after strong upward movementHello traders, I want share with you my opinion about Gold. The prolonged period of consolidation for Gold has decisively resolved to the upside, following a powerful breakout from a multi-week symmetrical wedge. This event signalled a clear shift in market control to buyers, invalidating the prior ranging environment and initiating a new, impulsive bullish phase. The price action for XAU since the breakout has been characterised by a strong, high-momentum rally that has pushed the asset to new highs. Currently, this upward movement appears to be overextended, suggesting that the market may be due for a healthy corrective pull-back. The primary working hypothesis is a short, counter-trend scenario designed to capture this anticipated correction. The expectation is that the current rally will soon find a peak, exhaust itself, and undergo a sharp decline back towards the breakout point. This corrective fall would be a natural part of a healthy uptrend, allowing the market to test the old resistance as new support. Therefore, the TP is logically placed at the 3420 level. This target is highly significant as it corresponds precisely with the current support level and the support area where the breakout originated. Please share this idea with your friends and click Boost 🚀