Cosmos Health (COSM) Coils for a Breakout as $1 Comes Into ViewCosmos Health Inc. (NASDAQ: NASDAQ:COSM ) is on our radar as price action begins to signal a potential upside reversal, with the stock now setting up for a move that could challenge the $1 resistance zone if momentum continues to build. After a prolonged correction, COSM is showing early technical signs that downside pressure is fading and buyers are starting to step back in.
Cosmos Health operates as a diversified pharmaceutical and healthcare company with an international footprint spanning Greece, Croatia, Bulgaria, the United Arab Emirates, the United Kingdom, and Cyprus, while being headquartered in Chicago. The company manufactures and distributes prescription medications, over-the-counter drugs, nutraceuticals, medical devices, cosmetics, and wellness products across multiple established brands, including Sky Premium Life and Mediterranation.
From a market standpoint, COSM shares are down approximately 36.9% over the past 52 weeks, a decline that has pushed the stock into oversold territory and reset expectations. The recent consolidation appears constructive rather than weak, with selling pressure easing as price stabilizes.
Technically, COSM is trading within a well-defined falling wedge pattern, a structure commonly associated with bullish reversals following extended downtrends. The RSI remains near 42, suggesting the stock is no longer overbought and that downside momentum has largely been exhausted. As price continues to compress toward the upper boundary of the wedge, the probability of a breakout is increasing.
A confirmed move above the wedge resistance would open the door for a broader trend shift, placing the $2 level back into focus as a key upside area traders will be watching. This technical setup, combined with the stock’s discounted valuation and diversified healthcare exposure, is why Cosmos Health stands out as our new pick at current levels.
January 20, 2026: Press Release
Cosmos Health Announces Accelerating Customer Growth, Improving Unit Economics and Robotic Expansion Supporting $40M in Additional Annual Revenue
Greg Siokas, CEO of Cosmos Health, stated:
"Cosmofarm continues its record-setting momentum, reflecting strong execution across customer acquisition, improving unit economics, and operational efficiency. Our ongoing investment in advanced automation significantly expands capacity and positions the platform to support incremental annual revenue potential of approximately $40 million as volumes scale. As we expand robotic infrastructure and last-mile capabilities, Cosmofarm remains a strategically important asset supporting sustainable growth and long-term value creation for Cosmos Health.”
Cosmosusdt

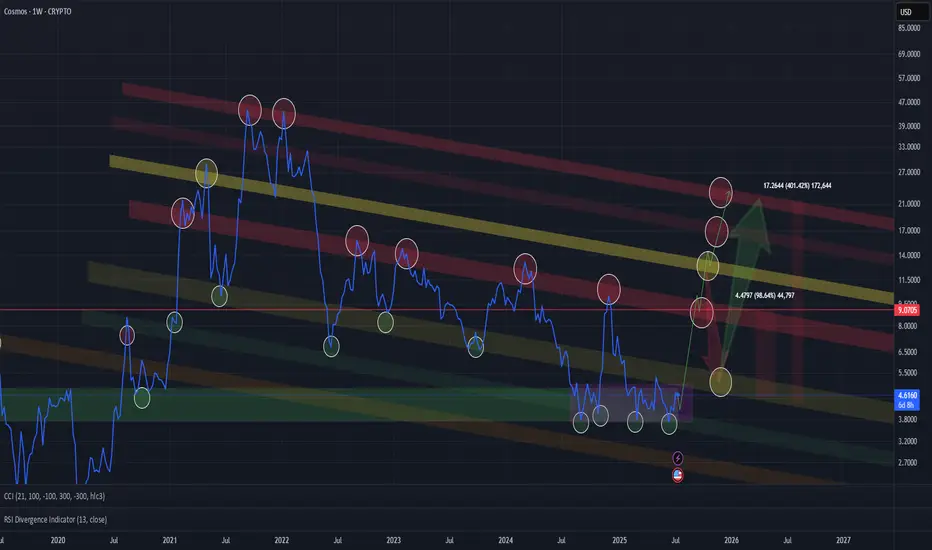
Atom , update .Didn’t went well as 4 years cycle fooled most of us and almost at the. Mars 2020 level , now that we left the 4 year cycle behind I can see clearly that we hit the bottom, RSI bullish divergence with price channel tightening tells us a possible reversal is on the edge, for me an ATH is ideal and possible, remember the history is being written by tough times.

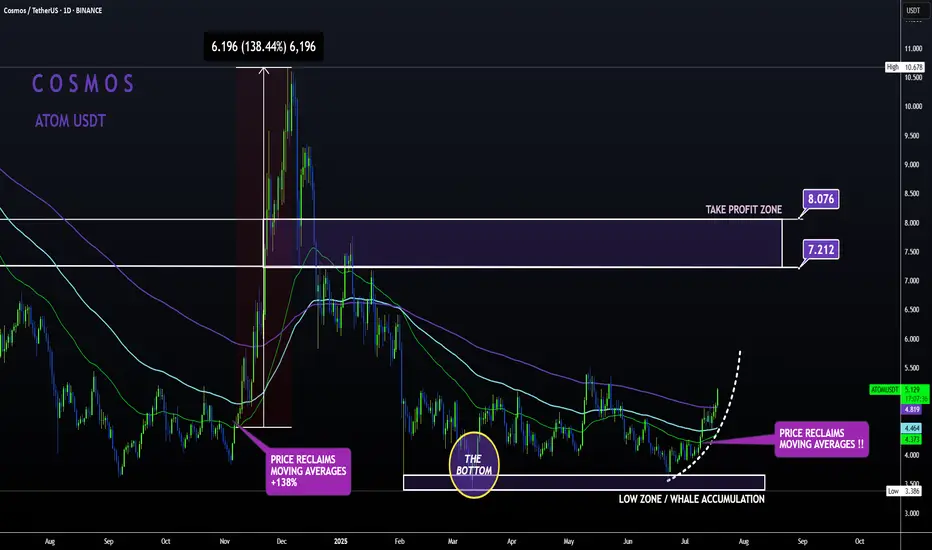
ATOM Sleeping GIANT ALT | Moving Averages BULLISH like NOV24'ATOM is slowly but surely making a turn up towards the first Take Profit point.
From the bottom, Cosmos has already increased a whopping 52% , with even more room to grow:
In my previous update, the 4 was still bearish when looking at trend lines and moving averages.
However, this has flipped to bullish from the 4h upward, with the price trading high above the moving averages in the 4h and in the daily timeframe:
4H:
Daily:
Note how previously, the big increases started as soon as the price regained the moving averages as support.
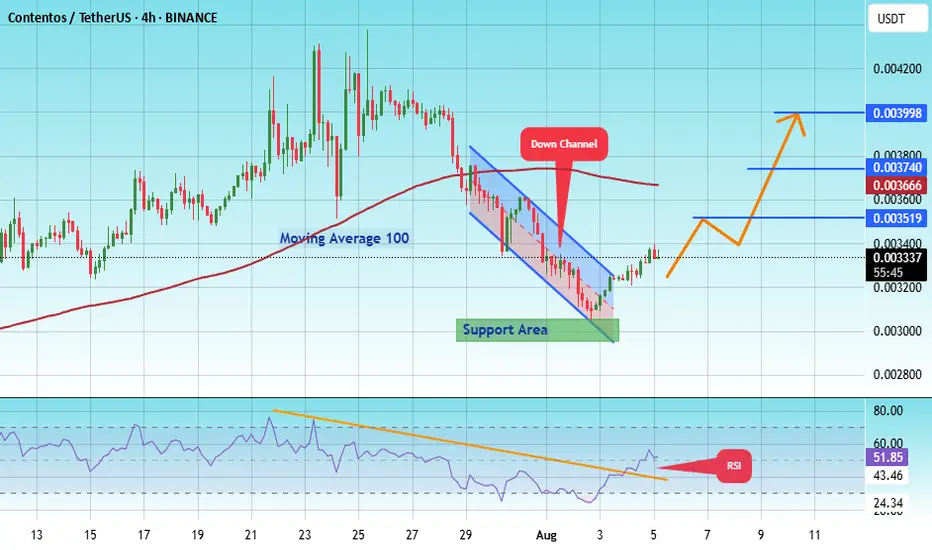
#COS/USDT : Breakout setup ? #COS
The price is moving within an ascending channel on the 1-hour frame, adhering well to it, and is poised to break it strongly upwards and retest it.
We have support from the lower boundary of the ascending channel, at 0.003071.
We have a downtrend on the RSI indicator that is about to break and retest, supporting the upward trend.
There is a key support area (in green) at 0.002970, which represents a strong basis for the upward trend.
Don't forget one simple thing: ease and capital.
When you reach the first target, save some money and then change your stop-loss order to an entry order.
For inquiries, please leave a comment.
We have a trend of stability above the Moving Average 100.
Entry price: 0.003339
First target: 0.003520
Second target: 0.003740
Third target: 0.004000
Don't forget one simple thing: ease and capital.
When you reach the first target, save some money and then change your stop-loss order to an entry order.
For inquiries, please leave a comment.
Thank you.
Cosmos (Atom)Atom usdt Daily analysis
Time frame daily
We have 2 models of analysis
1. The green line. Price can't break the resistance line and fall down to 3.5$
2. Price can break the resistance (gray line) and pump to 9$
Therfore we must watch the reaction of price and resistance

ATOM (COSMOS)🔹 Accumulation Phase in Play
We’re currently sitting in a clear accumulation zone — price is holding steady, showing signs of position-building by stronger hands.
📈 The next key areas are distribution zones, all of which are already marked on the chart. If you're entering a position now, odds are high you'll be able to secure profits as we move up. Just make sure to set a stop-loss — and don’t get greedy if you're aiming for the top.
⚠️ Even though it’s less likely, there’s a small chance of a shakeout near the yellow zone, but I personally doubt it — the market is already heavily shaken, sentiment is fearful, and many have been waiting for a move for too long.
🕰️ We’re also running out of time — the 4-year cycle is coming to a close by the end of this year. Historically, this aligns with significant market moves
ATOM | SLEEPING GIANT | Altcoin GEMATOM is an alt that I have high expectations for.
From a 4h perspective, we can see the short term price is still very bearish.
This is confirmed by trading under the moving averages, which indicates that the sellers are in control.
The great news about this is that the price doesn't stay long UNDER the moving averages in the 4h. From the chart below, we see a very evident bearish trend - the price STAYS under the moving averages, with occasional, random wicks above and to the upper purple (200d MA).
After the bottom, marked the " BIG TURNAROUND ", we see the price trading mostly just under or just above, as we observe range trading. This is how we know, the bottom is in / close. And from here, it's only a matter of time until we start turning around to another bullish cycle . Where the gains far outweigh the risk.
Following this logic, the next reasonable ( very reasonable ) target, is the purple moving averages, and beyond. Currently at $4.3, a nice +8% from here.
_______________________

ATOM | Sleeping GIANT Altcoin Gem 1️⃣ATOM is probably one of my favorite altcoins at the moment.
If you look at ATOM from a macro timeframe such as the weekly, it seems like there is barely any hope and that it's just been one big liquidity run.
And although ATOM has retraced nearly 92% since it's ATH, we see a much brighter picture when we look at the daily, or 3D timeframe.
______________________
BINANCE:ATOMUSDT

Don't Miss This Big Move on COSMOS (ATOMUSDT)Hello Everyone!
With Bitcoin on the rise and Ethereum likely to follow—as outlined in my recent ETHEREUM analysis idea —we continue to look for strong opportunities in the altcoin market. Right now, all eyes are on COSMOS ( BINANCE:ATOMUSDT ) as it shows promising signs of a potential breakout.
On Weekly timeframe
Price has swept the bottom of September 2024 liquidity zone.
On 4D timeframe
- On the OBV (On-Balance Volume) indicator , price has broken a downtrend—similar to the breakout seen in October 2024 , which was followed by a 170% rally.
- The previous 4-day candle closed above a key Fair Value Gap (FVG), indicating potential bullish momentum.
On 1D timeframe
- V shape inverse pattern.
- There’s significant liquidity in the $6.5–$7.5 range . After successfully breaking above the $5.1 level —just as I strongly anticipated—price is now likely targeting that liquidity zone.
To sum up, BINANCE:ATOMUSDT is demonstrating both fundamental strength and technical confirmation, making it a high-potential candidate in the current market environment.

ATOMUSDT – Accumulation Phase with Bullish Breakout Potential!ATOM is currently trading within a key accumulation zone, showing signs of potential reversal after a liquidity sweep below the 2024 bottom support level around 3.63 USDT. This move may indicate the presence of strong demand at lower levels.
As long as ATOM holds above the 3.63 USDT level on a daily closing basis, the bullish scenario remains valid. A sustained move above the 5.15 USDT resistance may confirm the start of a bullish breakout, with potential upside targets at 7.76 and 9.30 USDT.
However, a daily close below 3.63 USDT would invalidate the bullish bias and suggest further downside pressure.
Key Levels to Watch:
Support: 3.63 (bottom support of 2024)
Resistance: 5.15 (accumulation zone breakout level)
Bullish Targets: 7.76 and 9.30
The structure remains bullish unless invalidated by a breakdown below support. Always manage risk accordingly.
#ATOM #COSMOS #ATOMUSDT

ATOM Will Reach $3 In This Bear MarketHello, Skyrexians!
As we shared with you earlier we suppose that the last bearish wave will happen for all altcoins in April and BINANCE:ATOMUSDT is not the exception. Despite the growth against the market the waves order shall be remained and we will finally see this dump.
Let's take a look at the daily chart. You can tell us that wave 5 has been already finished recently and now this is bull run but pay attention that Awesome oscillator has not crossed the zero line. It means that it was wave 5 inside wave 3. Now price is in wave 4 and entering the target area. The most optimistic scenario if price will reach $5.7 at 0.38 Fibonacci retracement, but it can reverse even now as well. Finally it will reach $2.5-3.5 in the wave 5 in April.
Best regards,
Skyrexio Team
___________________________________________________________
Please, boost this article and subscribe our page if you like analysis!

How Cosmos ATOM Will Outperform Market In 2025?Hello, Skyrexians!
We have already forgot about BINANCE:ATOMUSDT , asset which can only drill the bottom and be weaker than other crypto, but last 2 days it shows strength against all market. While most of coins are below the February 3 low, Cosmos is about escape this dead zone. The Elliott waves order is the king and price cannot be in correction forever, so it's ATOM's time and we will explain why.
Let's take a look at the weekly time frame. We can see two green dots on the Bullish/Bearish Reversal Bar Indicator , both of them have been conformed. They have the great angle with Alligator and have been formed at 0.61 Fibonacci level. Moreover we can see the divergence between first and second reversal bar with Awesome Oscillator. We have a lot of strong signals that bear market is over and now price can reach the new ATH in the global wave 3. We need just wait!
Best regards,
Skyrexio Team
___________________________________________________________
Please, boost this article and subscribe our page if you like analysis!

ATOM Is Escaping From The Dead Zone: Wyckoff Accumulation Done!Hello, Skyrexians!
Let's update the previous Cosmos analysis today. It was one the weakest coin in 2024 and it looks like finally reached the bottom, completed accumulation and is about to explode. In our opinion BINANCE:ATOMUSDT is one of the most undervalued crypto asset for 2025.
Let's take a look at the weekly time frame. We can see the clear Wyckoff accumulation, no single event and phase has not been violated. The most painful time, the spring has been already passed. Price showed the impulse to the upside after that. You can see that Fractal Trend Detector turned green and started print the green support zone. Last time we have seen it there was a fake growth, but this time there is a high probability of true bull run on this asset!
Best regards,
Skyrexio Team
___________________________________________________________
Please, boost this article and subscribe our page if you like analysis!

Cosmos Atom usdt Daily analysis
Time frame daily
Risk rewards ratio =2👈👈👌
First target 9.2$🥇
Second target 13$🥈
According to the daily chart we see, today's analysis is based on Elliott waves.
The bullish impulse wave ( 1-5 ) has ended ↗️and the 3-point retracement wave or correction wave has also ended. ↘️
Based on the analysis of experts and what we see and hear today, the possibility of the alt-season starting is very high.
Based on this, I have chosen two targets, which are the $9 and $13 ranges, respectively. Which are wise targets and will bring very good profits to traders.👌🎯


ATOMUSDT Long Setup Setting / Quick 15Min LongBINANCE:ATOMUSDT
COINBASE:ATOMUSD
📈Which side you pick?
Bull or Bear
SL1 ---> Low-risk status: 3x-4x Leverage
SL2 ---> Mid-risk status: 5x-8x Leverage
(If there is just one SL on the chart, I suggest, low risk status)
👾Note: The setup is active but expect the uncertain phase as well. also movement lines drawn to predict future price reactions are relative and approximate.
➡️Entry Area:
Yellow zone
⚡️TP:
8.723
8.811
8.913
9.029
🔴SL:
8.358
🧐The Alternate scenario:
If the price stabilizes against the direction of the position, below or above the trigger zone, the setup will be canceled.

COSMOS ATOM- A smart trader focuses on buying assets that haven't yet started their upward trend, rather than chasing those that have already pushed hard.
- Atom hasn’t surged yet, making it a strong candidate to consider given its solid project fundamentals.
As always, everything is annotated on the chart : trends, bubbles, resistance, and support levels are all clearly marked.
----------------------------------------
Trading part
----------------------------------------
- Buy around 5$ ( 30% invest ).
- Rebuy around 4$ ( 70% invest ).
OR
- Buy Breakout after 6.15$
----------------------------------------
- TP1 : Before 8.8$
- TP2 : Before 15$
----------------------------------------
- Long Term Hodl : 100-110$
----------------------------------------
Be wise & stay safe!
Happy Tr4Ding !

ATOM | ALTCOINS | +77% | What does the future hold for COSMOS?I've been following Cosmos for many months, and it's recently seen a very decent increase of +77%. Unfortunately I didn't get all of it, but ATOM has increased moderately since I bought in a few weeks ago.
However - comparing it to DOGE particularly, it pales in comparison. Again, like with LTC, we need to start reclaiming previous resistance zones in order to be sure that this coin has a future. Ultimately - we are in crypto for the increases😉 And many altcoins have fallen behind over the last year. Although they can (and are) still being traded, the increases are nowhere near that of other alts.
____________
BINANCE:ATOMUSDT

Will Cosmos ATOM Be Reborn From the Dead Zone?Hello, Skyrexians!
Today we have the most hated coin for analysis. Do you remember how everybody told that BINANCE:ATOMUSDT will hit $40 in 2024, but in fact it was one of the worst asset of this year? We have also supposed that price will reach new ATH, but showed you the potential negative scenario which has been played out. Let's try to understand if ATOM still can have significant gains or this is completely dead coin!
On the price chart you can see the weekly time frame. In 2020-2021 asses has printed the global wave 1 which consists on 5 waves. Please, don't be confused that wave 4 slightly overlapped wave's 1 top. Sometimes it can happen, Elliott waves is not a math! Since there price is forming the corrective wave 2 which has the very beautiful shape. Wave A is impulse, wave B is a triangle and wave C is also impulse which could be already finished.
You can see that wave 2 reached 0.61 Fibonacci retracement zone and have some reaction from here. Moreover, Bullish/Bearish Reversal Bars Indicator has printed the green dot almost at the bottom. You can see how it performed in the past. For example, after the red dot in 2021 the huge crash has been started. Another one very important thing is that in March 2024 the mood was super bullish for ATOM, but in September it dramatically changed to bearish. Now almost everybody tells that it's scam and dead coin. You, probably understand that on negative sentiment it's much easier to pump for asset's price.
Wave 2 in our opinion has been finished, now it's time for the wave 3. If we apply our calculations technique the potential target is between $75 and $113. Price broke through the white line. In the upcoming month it's vital to find support above it and don't broke in the opposite direction.
Best regards,
Skyrexio Team
___________________________________________________________
Please, boost this article and subscribe our page if you like analysis!

ATOM | ALTCOINS to BUY | Good Coin, GREAT UPSIDE PotentialATOM is as of today NR 51 by market cap, meaning it's more likely to move independently from BTC. The higher coins by market cap, especially the top10, move more in correlation. I've done an extensive post on this HERE 👇:
Other Altcoins I have high hopes for in the NEAR term can be found here:
NOW is the ideal time to buy alts that are NOT trading in correlation with BTC, as they will be trading fairly low and can be bought at good entry prices. The worst thing is to try and catch a moving train , in other words trying to jump in at the top. Rather plan your trades and plan your entries - this way, you will minimize risk and maximize potential returns.
__________________
COINBASE:ATOMUSD BINANCE:ATOMUSDT


ATOMUSDT: Ready for a Major Falling wedge breakout?Yello, Paradisers ! Are we standing on the brink of a breakout for #ATOMUSDT, or is another fake-out looming just around the corner? Let's delve into the latest technical signals and pinpoint the crucial price action that could dictate our next move!
💎#ATOMUSDT is currently flashing strong bullish signals. If it can rebound from the critical support zone at $4.035 to $3.893, there's a substantial probability of a falling wedge breakout. This could set the stage for a sustained upward trajectory, with the first target being a key internal resistance. A successful breakout here would likely attract further buying interest and fuel a bullish trend continuation.
💎However, the immediate spotlight is on the internal resistance level at $9.101. A decisive move above this mark would act as a powerful bullish confirmation, potentially propelling #COSMOS towards higher resistance zones. This move could significantly elevate the price, reinforcing a bullish narrative for the days to come.
💎But caution remains essential. If the upward momentum weakens and the price fails to hold its ground above the current support, we may witness a retracement toward a stronger support zone between $3.340 and $2.858. A failure to maintain momentum at these lower levels would invalidate the bullish scenario, leading to a potentially sharp decline.
💎At this critical juncture, the market will decide its direction. Holding firm above $4.035 and breaking out of the wedge are vital for confirming a continued bullish trend. Keep a close eye on these levels and remain agile with your strategy as the market dynamics evolve.
Stay focused, patient, and disciplined, Paradisers🥂
MyCryptoParadise
iFeel the success🌴

ATOM/USDT Trading ScenarioAs a result of "Red Monday," the price chart of ATOM hit new lows since 2022. Notice how the price stabilizes in the range of $6.551 to $14.216. This range indicates heightened interest from market participants, confirmed by the volume profile. Amid widespread panic, the asset's price moved outside this range. From a long-term investment perspective, this situation appears promising. The current price may represent an opportune entry point into the asset.
