Perfect automated detection of Crab pattern - ShortA Bearish-type Crab pattern occurred within the resistance zone of 137.0-137.6.
(In this resistance zone, there was a rebound in 28 Jul, 19 Jul,..)
Also on the daily chart, Bearish-type Gartley pattern is occurring.
Short after seeing the rebound. At that time, be careful of re-inversion in the support zone of 135.2-135.80.
*Harmonic patterns and support/resistance zones are automatically detected using the indicators below.
- Harmonic auto-detect PRO
- Support/Resistance Zone Auto PRO
Crabpatterns

Harmonic PatternsHarmonic Patterns
we have so many kinds of “Harmonic Pattern”:
Black Swan
Bat
Crab
Butterfly
Gartly
White Swan
Shark
Zero_Five
Cypher
Double Top
Double Bottom
📚👌🏻 Each one of them has its unique Fibonacci levels.
⚡️ Do you want to know them?
😍 Happy to see what you find in the charts, please share yours with us
MEducation

A chance to short GBPUSD The USD has been weakening significantly and there is a chance now to buy it.
We are choosing GBPUSD to sell at 1.2175 with a 40 pip stop loss.
It is overbought on H1, M30, M15.
The H4 trend is up, so we will look to take money quickly with maybe a 40 - 70 pip profit.

Common features of all bullish harmonic patterns.www.tradingview.com
By combing all bullish harmonic patterns together, we can observe the following:
1. The Bat, Cypher , Gartley and Shark pattern point D is (0.786 - 0.886) XA without breaking the low.
2. The Butterfly, Nenstar , Crab and Deep Crab point D is (1.272 - 1.618) XA after breaking the low.
3. Point C band is common for all patterns (0.382 - 0.886) AB
4. Pint B band is common for three patterns ( 0.382 -0.618) : Bat (upto 0.5) , Gartley and Crab, with the Gartley pattern point B fixed at 0.618 XA
5. Patterns breaking out of Point A high have a band ( 1.13 - 1.61 )AB
U

EURUSD 2022 possible Harmonic pattern Not legal and financial advice;
Any information provided here is only the personal opinion of the author.

EURUSD-Weekly Market Analysis-Jun22,Wk2A Potential Bearish Shark Pattern may form up at 1.0823. What I will be focusing on will be the candlestick pattern formation at PRZ. If the candle touches 1.0823 but didn't break and closes above 1.0805, I will expect a stronger bearish move, and that is because it completes at the Bearish Crab Pattern HOP level.

Bearish Crab Pattern -Elliot Wave Analysis AB = 38.2% - 61,8% of XA
BC = 38,2% - 88,6% of AB
CD = 224% - 361,8% of BC
CD = 161,8% of XA

Bullish Crab Pattern - Elliott Wave AnalysisAB = 38.2% - 61,8% of XA
BC = 38,2% - 88,6% of AB
CD = 224% - 361,8% of BC
CD = 161,8% of XA

CADCHF - moving lower to complete a bullish CrabA bullish Crab will complete between 0.7489 and 0.7476. We have two bespoke support levels. With the 2nd support located @ 0.7489, this is the prime level for a reversal.

EURUSD moving higher to 1.0815 before the reversalUsing correlation betwen DXY and EURUSD, I see further upside pressure in the EURUSD before sellers return.

CADCHF Counter Trend Sell based on Harmonic PatternThe CADCHF is in an uptrend BUT
1) Daily OB
2) H4 OB
3) H1 OB and divergent
There is also a pattern in H1 to sell.
M15 divergence of 14 points just came up signaling it is willing to fall.
Aiming for 70 pips and then go long again.

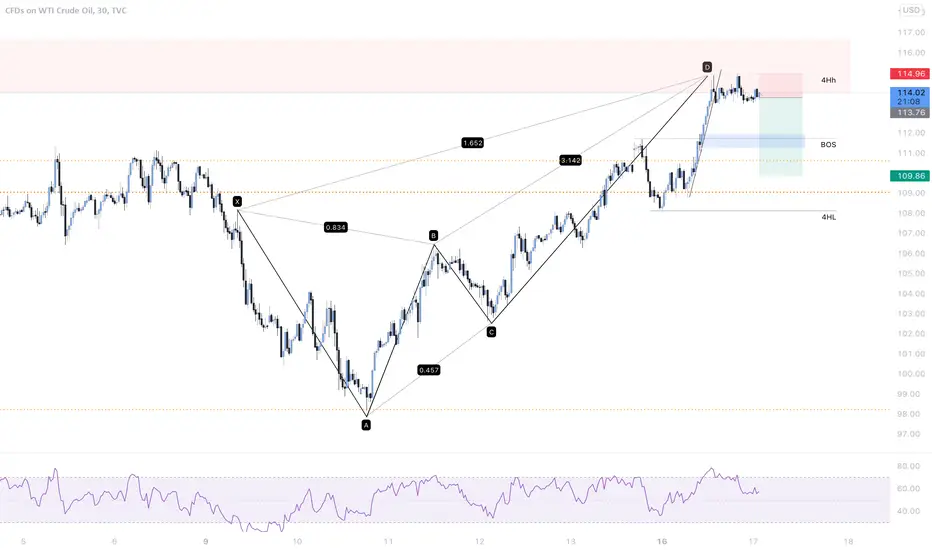
Crab Complete 🦀USOIL - Crab complete in strong HTF supply zone, break in momentum, have a confirmed entry on the LTF, SL is above the current daily high, i'm looking to trade the retracement after the BOS yesterday.
Let me know your thoughts!
* Disclaimer **
These ideas I never trade until the end target with my initial lots, I focused on high probable entries with higher lots and use a specific partial taking strategy giving me a very high win rate and take most of my profits very early, I only leave a small % of my capital to run the entire trade. On the flip side im constantly monitoring LTF momentum and will close early if things change, these analysis's are for research purposes only.
BTCUSDT November target nearMy Nov '21 target from the peak is near. The XA swing trendline from the Crab harmonic pattern has been broke down. BTCUSDT is collapsing and don't showing strenght for a retest of this trendline for now.

Bullisb Crab Pattern 15min BTCBullish crab coming up if breakdown on the 15 minute. For this harmonic pattern, the 1.618XD area should be expected to exceed that but no more than below the 2.0 for the stop zone area. As always, when the pattern completed it is still best to wait for a reversal signal before jumping in. You can try to find a great entry by going on the lower timeframe, in this case the 5 minute to see the trend change faster.

BTCUSDT micro double bottom AB=CDBTCUSDT micro double bottom - possible pullback. The price action has been made a wonderfull bear flag structure and the double bottom is in conjunction with an oversold condiction and increased interest in accumulation. My technical analysis is mainly based on Fibonacci ratios in a sequencial AB=CD pattern. Expecting a intraday swing upward in a potential micro bearish CRAB (updates incoming) pattern as a final leg up of this flag. Potential Reversal Zone predicted at 35K level - 14.6-0% Fibonacci Retracement.

BTCUSDT potential micro Crab patternThe price action seems to playng out a micro Bearish Crab pattern formation as a final leg to supply at the peak of the bear flag structure. The market is oversold in the intraday and a pullback is expected at the PRZ zone.


xvgusdt - BULLISH DEEP CRAB - HARMONIC PATTERNI am observing Harmonic Deep Crab for XVG USDT on a Daily chart.
Of course, this is not investment advice, it is my personal analysis.
Good luck.

AUDJPY ADVANCE HARMONICS PATTERN AUDJPY has formed an advance harmonics pattern on the daily chart.
The price is trading above the entry level EL 93.292 with a possible gartley bearish pattern on the hourly chart.
highly probably the price could reverse signaling a short entry at 94.369/94.776
TP1 88.278
TP2 86.255
TP3 83.669

BTCUSDT weekly overview updateIf price action stay below 37.2k, we can see a downtrend in the next week. Price above, we can expect a right shoulder formation. I'm thinking is most probably a pullback to 40k after breakdown. Oscillators: Ehler's Even Better Synewave and Ehler's Smoothed Stochastic.

AUDJPY ADVANCE HARMONICS PATTERN AUDJPY has formed an advance harmonics pattern Crab on its daily chart.
the price is trading below the entry level EL 93.292 with potential targets projections
TP1 88.278
TP2 86.255
TP3 83.669

NZDJPY ADVANCE HARMONICS PATTERN CRABNZDJPY has formed an advance harmonics pattern on its daily chart.
The price is trading below the entry level EL 85.435 with potential targets projection TP1 80.083/TP2 78.097
NZDJPY CRAB BEARISH PATTERN
PATTERNS ARE ONLY VALID, WHEN THE PRICE
BREAKS AND CLOSES ABOVE THE EL WITH A CONFIRMED TREND
💼EL 85.435
⚠️SL 85.719
🎯TP1 80.083
🎯TP2 78.097

EURJPY ADVANCE HARMONICS PATTERN EURJPY has formed an advance harmonics pattern on its hourly chart.
The price is trading below the entry level EL 138.981
EURJPY CRAB BEARISH PATTERN
PATTERNS ARE ONLY VALID WHEN
THE PRICE CLOSES ABOVE/BELOW THE ENTRY
LEVEL WITH A CONFIRMED TREND
💼EL 138.981
⚠️SL 140.135
🎯TP1 134.300 100% AD
🎯TP2 132.738 1272% AD
🎯TP3 130.780 1618% AD
