Criptocurrency


long eos idea bitmexnext operation of the day, closely following the btc
Bouncing at level 0.38 important level for one wave higher

BTCUSD - anticipated scenario of events.Colleagues, at this point in time on the chart we see two groups of investors trading in different directions of the trend. The area of intersection of their interests is marked in yellow. Depending on which group will have large volumes - will depend on the further trend. The signal to enter the position will be a breakdown of the opposite trend line with further consolidation on the current trend line. The entry points and the price movement scenario in both cases are indicated on the chart. I wish you great profit!

XRPUSD trading idea.After a surge up at the weekend - below the "triangle" - there was a zone of stop loss of participants. It is logical to assume that at a given time the price will fall down to the specified orders. I recommend to consider short positions up to these levels.

BTCUSD - predominance of interest in sales.Colleagues, at this point in time, the price entered the entry point, and I see a picture of a strong movement from the resistance level down and strengthen the price below the uptrend line. In this situation, I recommend looking for entry into short positions to profit-taking levels.

ETCUSD-continuation of the downtrend.At this point in time, the price has broken through the level of the upward trend channel "B" and is fixed below its level, continuing to move along the trend "A". There are no reversal signals. I recommend to consider only short positions to the target level.

LTCUSD - - consider long positions.At this point in time, we observe a picture of the end of a set of positions in the "triangle" and a false breakdown of a strong resistance level. It is logical to recommend considering only long positions.

XRPUSD - - the moment of entering the market is approaching.Colleagues, at this point in time, the price forms a "triangle" on the uptrend. But, earlier there was a breakdown of a strong resistance level. therefore - I recommend waiting for the price to enter the entry point. After this moment-open a position depending on the direction of the impulsive level on M15.

BTCUSD - weekend traffic analysis.Colleagues, at the moment we see a picture of the price movement between the strong resistance level and the upward trend level. I recommend waiting for the price to enter the entry point. Next-wait for the formation of an impulsive level on M15, and then open a deal. The deal should be opened towards the formation of an impulsive level! Partial profit-Taking is recommended to be set to the marked levels.


A little about my trade-11 (Bitcoin-"smart or beautiful"?:-))I continue to talk about my trading principles.

BTC IN TRIANGLE at the moment we think that BTC in triangle which reflects wave B in general correction.

Battle for 200 SMA rages on? Next stop 10200? Heya All,
Woke up this morning to see that "the FIB circles of Death and Capitulation guys" have been busy and actually have read what they wrote. Shocker! again solid artwork and conclusion that leads to the answer "42". (Kudos if you got the reference and tip of my hat if you actually know what 42 actually means).
Now let's put some meat on that bone and discuss what we are seeing.
1. 200 SMA just got violated, yet this means nothing so far. If we manage to open and close 4H outside of it then I would expect continuation to 377 EMA stationed at 10200 Level.
2. Meanwhile, the volume impact signal line accelerates deep into the bearish zone and we see downward price pressure on the momentum oscillator.
To summarize, if we open and close below 200 SMA bad, if we play in the range between 200 EMA- SMA Good.
There is about a 70% chance that we continue the movement towards brown 377 EMA.
Happy trading all! and have a great day!
Cheers
Archie

4H 50 EMA broken - Time to sell old bags to buy new bags!!!Hat 's going on my people? How is everyone holding up?
Disclaimer, I am macro bullish on BTC, yet price action takes precedent over whatever I feel. I think that the test of 200 EMA & SMA on 4H is an incredibly bullish sign and also offers us an opportunity to exchange our old bags for new bags.
This move has been a long time coming and I think that we will see the continuation and culmination of it within upcoming says.
Downwards price pressure accelerates ever so slightly and this is visible on Volume Impact oscillator and on momentum oscillator as well.
Thinks to keep in mind:
- 50 EMA on 4H has been breached and this opens up the possibility to revisit 200 EMA -SMA stationed at 10600-10700 levels. The chance of reaching this area is roughly 85 % so be ready.
- There is a chance that we might continue below. If we overshoot our price targets and manage to close 4H under 10400 this will open up whole other can of worms and mandate continuation to 10.1-10.2 price levels in the upcoming week. Have to be honest though, I don't think that this is a reasonable scenario and holds significant merit until we close 4h dildo under 10.4.
To summarize:
General Trend: Upwards, sentiment bullish.
Testing 200 EMA SMA after the golden cross is incredibly bullish and most likely will result in a swift reversal upwards and acceleration of the price action.
I don't think that reaching 10.6-10.7 levels breaks the market structure, in fact, it reinforces the previously established rule. The fact that this move does not fit in your carefully drawn descending wedge, triangle or pendant means that you should probably not give too much of a significance to whatever you draw. (This applies to you too Mr Fib Circles of death and capitulation- thank you for your hard work and beautiful artwork).
Stay safe my people. have a successful as well as lucrative trading week and stay awesome!
Cheers
Archie

For short , Bitcoin testing again the uptrend line at U$ 10800. Another short for bitcoin , at the up trend line in a Daily and 4h timeframe

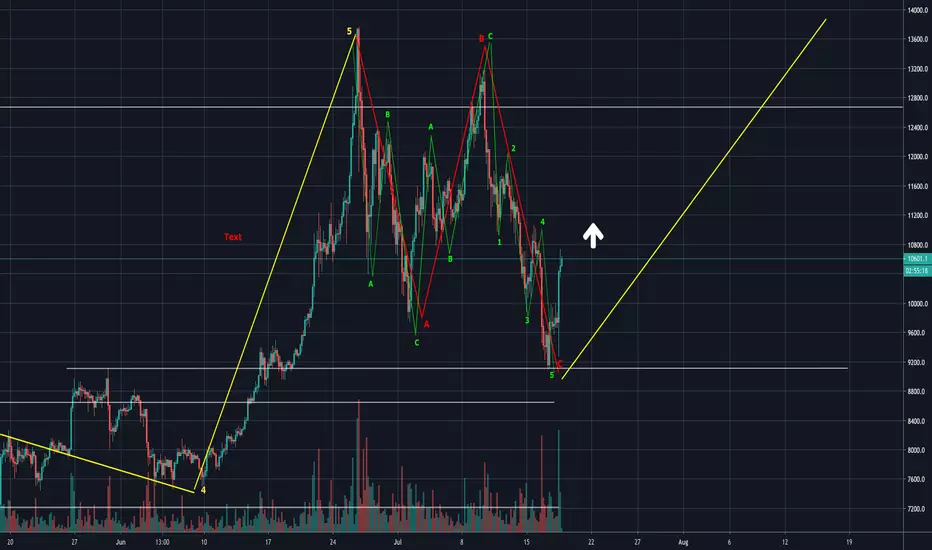
Bitcoin / Update of forecast / end of horizontal correction My last forecast was wrong. I think that BTC has just completed horizontal correction (3,3,5)
Bitcoin, probable LONG To tell the truth I didn't expect that bitcoin will begin form triangle , however all current facts point out that this is possible development of situation.


ETH will rise faster then BTC The Eliot analysis point out that the reverse of ETH relatively to BTC will be soon because at the moment we are in last 5 wave of wave C. That fact that fifth final wave is triangle might be explained through existing very strong price level which is mirror and confirmed by 4 false breakouts. Besides if there is a triangle at the end of trend it means that sharp reverse moving will be and I think that we will see this moving of ETH when it gonna to reach 400 or 500 USD.

ETH price forecast ETH have great chances to reach 500 USD and above if to believe in Elliot analysis ;)))

ETH Wave analysis All waves meet basic rules of Elliot analysis. As price chart display there is double stretching of third wave of the biggest order (green). In this green third wave there is yellow third wave which is also stretch. So on balance at the moment we are in fifth wave of stretch yellow wave.

