ETP / btc possible profit 300% of our capital ! ! ! ETP is highly overvalued, its price is in historical minima fulfilling a figure of euphoria perfect depression should be to start another cycle of bull market in a short time in that currency making us possibly win x2 x3 and even much more.
The figure where it is found is totally Bullish, a bullish reversal.
Criptocurrency

ETHEREUM - Where is our dip?Good evening traders,
Lets take a look on ETHUSD , which is bleeding a lot these days.
On our 4h chart we can see ETH is already below our 50 and 200ema, MACD is bearish and the sell pressure is too strong.
RSI is way oversold so we might see a little pullback on the next couple hours.
The 0.5 fibo level is gone and now we're going to 0.382 level.
On the daily chart, taking a look on our indicators, MACD is bearish, RSI still has room to decline and the sell pressure is too strong also.
Even if we look at the price action itself, it doesnt look good, no volume green bars without any progress and strong red bars with good volume and progress downwards.
What now?
Now we need to wait for a possible bounce on the circle area, the 0.382 fibo level and the 200 ema SHOULD provide support and ETH might bounce on this area.
IF ETH break down these levels we will reach lower levels, which will be good to do position trade since this coin will for most likely recover for medium and long term.
If we get a bounce from this area, a breakout on the downtrend (pink dotted) will be a confirmation of the end of this bear momentum for ETH.
This is NOT a trade signal and is here just for educational purposes.


Omise go - A bright future ahead. Good evening traders, lets quickly jump into our OMG analysis.
As we can see on our 4h chart, omg is making lower highs and lower lows, the price just broke the 50ema and now its testing it as resistance.
On the 12h chart, we have already a higher high and the price might wanna make a higher low, the 50 ema is working as support for now, we need look out for the price action on the 4h timeframe now.
A good reload zone is marked on the 12h chart channel.
OMG is a very nice token with good fundamentals, so there is no need to use stop loss here unless you are a day trader.
For short term targets , 20 usd is only fair.
Medium term, 30 usd .
And for long term, i dont think its any absurd if we see OMG above 50 usd this year.
A break and close above our downtrend (green) will give us confirmation that omg is ready to reach higher levels again.
The volume is decreasing so i guess there will be some action very, very soon.
Good trades everyone.

Critical cotizations areas for the price of BTCThe price of Bitcoin 1.30% has reached an important cotization area. This area act as resistance and monthly pivot point, if the pice exceeding $ 9500; there is a high probability that the price reaches or surpasses areas close to the maximum price of 2017.
The most sensible thing to do is to wait for the closing of this candle or perhaps the next two in graphs of days.

BTG - Where is the Gold?Good evening everyone, after a friend request, lets take a look on our btgusd ,
This coin is bleeding a lot since it all time high near 500 usd and now looks like it has found support on the 105 usd zone (red dotted line)
On the 4h chart we can see btg appears to be forming a descending triangle which is a bearish sign, we need to see how btg will react since we're reaching to the apex.
If btg turn bullish and break and close ABOVE our downtrend and the 50 ema, we can open long positions targeting 120, 128 and 140usd levels, for short term.
All our indicators are going sideways and the volume is decreasing, there is no movement for now, probably we will see some action very, very soon.
If btg break below the support zone, it'll most likely bleed out to deeper levels, like the 75 usd (check the right chart) and we will have to wait some reversal price action to reload this coin.
For now, all we can do about btgusd is wait for a breakout and close, above or below.
Good trades everyone.

NEO - Time for higher lows?Good evening traders, lets talk about our asian beloved token, NEO.
As you can see, NEO has been doing lower highs since his ATH above 190 USD.
Now the trend appears to be changing since NEO just made a higher high and is moving to make a higher low, however, the price action after a pin bar gave us a warning alert, we need to wait more confirmation.
We need to keep a closer look on the price action on the next few hours to see where NEO is willing to go, a break and close below the uptrend will tell us that NEO doesnt want to moon, not YET and we will have a good opportunity to add more NEO on dips.
On the other side, if NEO doesnt break the uptrend, it'll be the confirmation for a trend changing and NEO might reach older resistance levels.
The first resistance level will be around 138 USD, the previous swing high.
For medium and long term, NEO has all it need to reach his previous all time high and beyond.

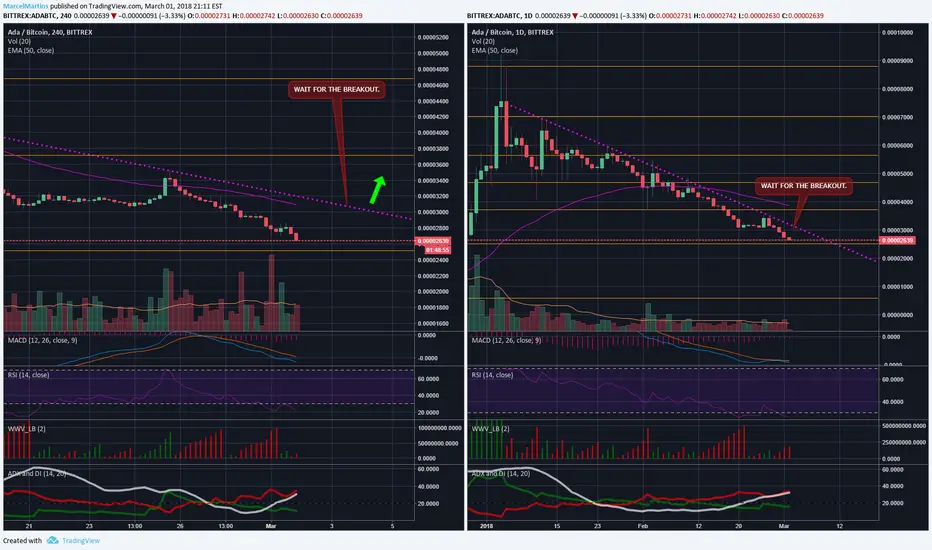
CARDANO - Wake up!Good evening everyone,
Lets talk about cardano, currently the 7th coin in terms of capitalization.
This token has good fundamentals behind it and it'll not be a surprise if we see CARDANO above 1usd a few months ahead. (for a conservative perspective i mean).
So i can say, its a good HOLD.
But lets talk about short term, as we can see, Cardano is bleeding a lot since its ATH around 9000 satoshis.
Now, we're reaching a strong support level and the current 0.236 fibo level, we need to keep an eye on this level, if cardano keeps bleeding, well, it'll be bad, very bad, but still a good hold for LONG TERM.
Now, if Cardano bounce from the current level and break the downtrend, we might see a good take off, the main targets for short term are 4600, 5600 and 9000 satoshis (current ATH).
For a long perspective, 14000 satoshis is where i plan to sell at least 50% of my holdings.
Anyway, we need to see some action before going long, a bounce from the currenct level and a strenght break out from the downtrend.
About the indicators,
RSI is HEAVILY oversold on both time frames.
MACD is bearish, on both timeframes, the daily one looks slighty better, its histogram show that we might be losing the down momentum.
We can see on our wave volume that the sellers are strong on this coin but they appear to be losing strengh on this last wave.
DMI however, still show a bearish sign, on both timeframes.
In summary, we need to wait to see how Cardano will react on the currenct level, entering long without any confirmation is risky besides this coin has good fundamentals.
Good trades for everyone.
This is NOT a trade signal and its just for educational purposes. Trade by your own rules.
OMISE GO - Go to where?Hello everyone, lets take a quick look at OMG USD.
As you can see OMG is going into a uptrend and just broke our daily pivot (not on chart).
Looks like we're heading to 0.382 fibo retracement, which is around 20.50 level, and if we manage to break it, 23.50 should be a good take profit.
Take a brief look on the volume of the last red bars, high volume but, almost no effect, tiny bars with low range, lack of sellers? no supply?
Anyway, OMG is a quite reliable token with good fundamentals behind it, i dont think its any absurd if we manage to see OMG above 50 usd this year, so yes, a good hold.
A quick look on the indicators,
-MACD is goind to have a bullish cross, above the 0 level.
-RSI show that the buyers have strenght.
-On our wave volume indicator we can see the buyers have strenght, again.
-ADX is starting to lose momentum but still, DI+ show a bullish momentum.
Its important to say, as we all know, the criptocurrency market will mostly follow btc, so if btc for some reason dump again, omg will most likely follow it, however as i've said, its a good hold.
And regardless btc, our uptrend and 50ema should provide a good support level, if OMG break it, we might reach lower levels again, which will be very good for reload this token.
Good trades everyone.
This is NOT a trade signal and is just here for educational purposes.

BTC-USD -Good news, brothers and sisters!Bulls to come back soonAs I wrote yesterday we have a very good signal for Bitcoin .We went out of the area of the bears. This is one great news for Bitcoin and we need to stay above it to seal the broken downtrend. On the graphics 1 hour we see there are several attempts to return in the area of bears, but the red line proves to be a strong resistance. This is our support area, if we remain above this line, and we can move on to a new phase in this market cycle.
What next ?
If the price is kept above the red line and the 4 our graphics it is possible to test the black line. It is important to note that we need a correction.
However, this correction will be a little late, it will be the moment when "smart money" come.
It takes a little patience.
I will update the analysis.
I expect your opinions and comments <3

BTC - Some levels to keep an eye. So, finally BTC appears to broke our downtred from its ATH, which its already a bull signal.
We can see we might be forming an inversed head and shoulders pattern (its NOT finished yet and may not finish) and IF we get a breakout from it , above the 11000 level, it might be a good entry signal.
Another and a safer way to trade is to wait BTC to retest either the uptrend or the 50 ema and reject it as a support, however there is the risk of btc just go moon without retesting it.
So IF we complete our H&S pattern the HIPOTETICAL target should be around 16500 level but it might take some time to reach it since we have 2 strong resistance levels before.
On the other hand IF we break our uptrend and the 10000 psicological level we might go deep again.
About the indicators,
we can see MACD is just about to cross to the upside and above the 0 value
RSI is going bullish as well
ADX is below 25, so we might be in a decisive moment, time to get our momentum back.
And we can see as well how the volume is increasing on our bullish waves.
So there are a few options here.
-Wait the H&S to complete to enter long.
-Wait for a retest of either 50 ema or uptrend and the rejection of it.
Both options have his own risks, and its not because we broke the downtrend that btc will just go moon again, however its a REALLY good sign.
If i go long i might put a stop loss just below the uptrend.
This is not a trading signal or a buy sign either. This analysis is made only for educational purposes.

ETH BIG PICTURE We are in a long-term bearish channel, where a price recovery force and continuation of an upward trend was evidenced in the price level of 569 $, explained by the high volume and the exhaustion of the selling force. While this is happening and the price continues to recover, we will see a correction of at least 61% ($ 715) before following the bullish path. We must remember that the analysis is still tied to the movement of the BTC, which drags the other currencies of the market, our recommendation is to enter long at the time of a break above the channel.
TP1: 1106 $ (WE WILL EXPERIENCE ALSO VOLATILITY)
TP2: 1370$

BTC - Its time to moveGood evening everyone,
So btc have failed to breakout the daily trendline from his ATH on december and now we're experimenting some correction.
Looking at the 1h chart we can see btc going down inside a channel, and a failed attempt to break the 10400 price, which currently the 50 AND 200 4h EMA which are acting now as a resistance.
After the failed attempt BTC moved with some strenght down, a supply bar with volume, followed up by green bars with low volume, which MIGHT mean we are in lack of demand and therefore, we might retest some lowers values.
ADX indicator shows that we are losing momentum and MACD is about to cross to the downside.
ON THE OTHER HAND (less likely on my opinion, but we need to keep a closer look dont we?), Btc might try to break the channel upsides again and if it manages to do it, BTC should break the 10460 level resistance and then retest the daily trendline (pink one) around 11100 usd.
For now i'll just wait in FIAT, in a conservative way we should only reopen long positions if we manages to break up the 11100 level on the daily chart, if btc remains bearish we should open long positions on dips based on reversal signs.
For a scalper point of view, if we break the 10460 level, we can enter long positions targeting the pink trendline.
This is just an educational point of view and not a trading signal at all.
Everyone is welcome to share thoughts.

XRP - 2018 - Great opportunity!!Simple and straightforward. Great opportunity and risk return to 2018 on xrp.
After a long period of accumulation of more than 200 days in the symmetrical triangle, the xrp fired starting its high cycle. We are at the end of a correction, with a break in the downtrend line announced by the volume on the daily chart and a clear upturn of the buying power by the RSI. What forces the theory of waves of this active.
Despite the great influence of btc we must remember that xrp has different technologies and partnerships and can easily follow its path in 2018 despite btc variations. It is clear from the great potential for growth that still exists in that currency.
I do not much like the centralization it brings as a proposal, but I can not deny the great trade opportunity we are seeing. Aside from the fact that xrp's partnerships bring an immense contribution of capitalization to it (banks, and many), which clearly makes this scenario possible, which can bring more investors to this asset and exponentially increase its price.
"xrp to the moon" has just begun! I do not even need to say I'm already inside.
1st target = 300%
2nd target = 936% (that's right, 936%.)
Good trades to all!

LINK/BTC analysis prior BitcoinSuperConference
The 4h chart of ChainLink is forming a cup and handle .On breaching the handle upwards an upward movement may be expected to the major resistance marked by the pink line .
A divergence is observed within the vertical dotted lines denoting the slowing momentum .
The CCI pullback rebounded from the -100 level which may be considered as an evidence of continuing of short term current momentum.
The MACD is converging to form a buy signal.
What are your views?
For tips and analysis follow :
YouTube : www.youtube.com (FOR HINDI/URDU)
Telegram : t.me
Twitter : Check out Coin Authority (@CoinAuthorityOG): twitter.com
STEEMIT : steemit.com
Good luck! :)

FLAG PATTERN // GO TO 35K !?This will be my strategy for the next few days.
Points of entry and exit are highlighted in the chart.

BTC long Inverted H&S possibilityI hope this is how is going to playout, an inverted head & shoulders pattern.

LTCUSDT, growth based on previous purchases.Growth based on previous purchases under resistance 240.4. A small distribution on sales indicates a continuing growth potential. Objectives: 251.45, 256.5. Used indicators (scripts): x-lines (9) & x-volume.

XRP: almost ready to move upIn the next few hours let's see if the price will confirm the bullish symmetrical triangle pattern. MACD and RSI, both indicate a reversal.
In this case XRP could be almost ready for the next move up.
2.70 - 3.00 USD in the short term
4.50 USD mid term target

ETC: a lot of potential after the correctionETC correction will take a while. But after that we can expect a new ATH.
Minimum target could be 61 USD
