This is my look at Bitcoin VS USD on 05.28.2020I'm not a financial advisor, Don't buy or sell bass on what I'm saying... I do own some Bitcoin and I think it has a great future, this future may or may not be that great so PLEASE DO YOUR OWN HOMEWORK. THIS POST IS JUST FOR INFO ONLY...
This is my look at Bitcoin Vs USD on 05.28.2020
This is an experimental indicator that I have made and testing it out... It is using the EMAs the white line is 13 EMA, the green line is 55 EMA and the yellow line is 89 EMA ...
The points going pass is a future guess by the experimental indicator and the way it works is if it's pointing down like the white one is on this chart, to me, it's suggesting that Bitcoin is going to head higher in the next couple of days and using the RSI and the MACD that should be happening sometime over the weekend or early next week has helped to confirm that for me...
The points going pass is a future guess by the experimental indicator and the way it works is if it's pointing up like the white one is on this chart, to me, it's suggesting that Bitcoin is going to head down in the next couple of hours and using the RSI did have a couple of death crosses over the last day or so and the MACD looks like it will have a death crosses any time now!
What do you think about this, a good idea or a bad idea?
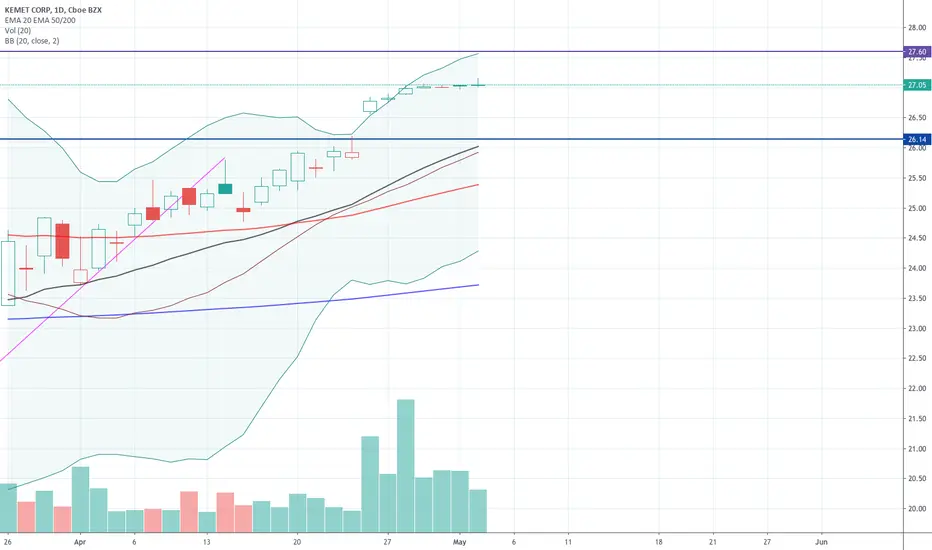
Cross

HMMM..here is something for a few cents up to 50 EMA it might break but don't think it hold to form new support but these crazy time who knows volume looked descent today but ended in a tug of war Cross... worth a look in the am
HLong


KLong
RSI "DEATH CROSS" & "GOLDEN CROSS" during Pandemic VolatilityJust a quick idea that shows how, as the Covid-19 crisis worsened, the RSI "Death Cross" clearly indicated the huge drop off in price that was about to occur.
Conversely, despite record unemployment claims in the US, when the RSI "Golden Cross" recently occurred, the price was able to break through previous resistance.


Another ExerciseThis is the same idea as my previous post to combine the Cross Strategy with the Standard one I keep seeing...

Another Exercise/PracticeDoes this make sense? I tried to marry the idea of a cross strategy with the idea of the boxes that I see everyone do. Two yellow lines would be my entry threshold. Solid red line would be my SL. The 3 aqua lines would be my TP1, TP2, TP3. So placing each sell simultaneously as such - TP1 (+1.00) TP2 (+1.00) (TP3) (+.50). TP1 & TP2 are more "plausible" if the down trend continues, so put more in for a greater reward. Once TP1 hits, move SL up to that previous line.
Again, does this make sense? I realize they arent large PIPS, I'm still new, I'm just trying to see if I understand what's happening. I'm still in demo mode, so this is all hypothetical.
Does anyone see these? Haha.
FX:USDJPY

Cross Strategy - Idea/PracticeThis is just used as a practice exercise utilizing a strategy I learned earlier.

Sequential Bottom. Death cross-50,200 day MA. Retest Imminent What most people are overlooking is the 2011 market decline. I think we're going to see a sequential bottom with an undercut of the prior low. It happened in 1974 in which there was an Oct. low with a subsequent Dec. low. It happened in 1980 with the bunker hunt decline, in 2001, in 2008-9. Point is we historically have had secondary tests.
This death cross of the short term MA crossing through the 200 is signaling an imminent retest. So, it would make sense for the sell-off to occur this week because I think we're yet to see major equity selling during this Quarter-end pension fund rebalancing.

ALAM Crossing clear enter signalsI created this new version of EMA crossing by replacing it with ALMA, Please take into consideration that the cross signal may occur during the candle. I advise waiting until the candle is close.
I used EMA crossing signals to adapt this code and turn it into an (Arnaud Legoux Moving Average) ALMA Cross.
I expect it to bring a better signal that an EMA cross, let me know your comments and use under your own risk. this is just and experinental idea.
Long: Get into a long trade when the short moving average crosses up the long moving average.
Short: Get into a short trade when the short moving average crosses down the long moving average.
I recommend using it alongside a volume indicator to avoid sideways trends.
Exit at your own convenience or when the trend direction changes. I recommend using it in 4H and 1D charts.

BTC Death Cross Taunts 4 Hr Chart - Pivotal Moment Since last post Bitcoin has failed to find any support & price dumped to now test the 0.5 Fib level and 200 day moving average. We are currently attempting to Find support at the 0.5 Fibonacci level. Intra-day timeframes looking bloody and beaten. Bit of bearish divergence on 1hr chart. If we continue to fall next target would be around $8300.
ON A POSITIVE NOTE
We are heavily Oversold on the Daily & 4 Hr Stochastic RSI. The Stochastic blue line has just dropped out of overbought territory on the Weekly chart. In previous posts I shared these possibilities & the potential they had in playing out. Unfortunately they did. And now we all know Bitcoin is a scam ;)
Its bad day for short minded person. Thats not me.
Cheers
Not Financial Advice

BTC Golden and Death Cross - Explanation, DemonstrationFirst of all, do not use MA, use EMA. Second of all People and Traders forget for Golden or Death Cross to work properly, before trend starting, price should be pooled into the cross itself and test some major EMA, like 21 or 50. Then and only then you know its legit (sometimes you get continuation fast on 9 EMA - rarely).
So, let's see did it do well on BTC daily. We have a one-off, and a great % of winnings. So from the traders' perspective, you have an edge here, just have to know how to properly use it. Its not just Golden Cross, long it now! No!!!!!
You need to understand rules and Price Action to get an edge on your side + Risk Menadmet, or no Golden Cross will help you. Yeah it work, but respect all the rules. I hope this is enough to put an end to "Golden Shower meme". If I lie, the chart is telling a story it self, have a nice day and wish you all great profits, enjoy!

XRP DAILY HUNGRY FOR GAIN$ COOKING UP A GOLDEN CROSS XRP Daily Chart
Looking full of steam and ready to rise. Bullish crossover on Stochatic RSI from oversold conditions. 50 day moving average approaching 200 day, it has already crossed the 100 day. Breakout above 1.0 Fib. If we can establish support here we should attempt to test the 1.618 Fib around 0.365. Timeframe could potentially be about same time DTCC goes live (Feb 24th). This would also align with the top of the pitchfork offering the possibility of a breakout.
If You Enjoy My Content Please Comment & Like I Appreciate Your Insight & Interest.
My Personal Speculation & Opinion Not Financial Advice.
Link To Same Chart On 1 HR Timeframe

#BitCoin Update for 02.17.2020We have seen a little pullback in the chart of Bitcoin on Coinbase, It has started to test the 9 EMA in yellow and the 18 EMA in blue... On the hourly chart, it should cross soon that is going to give us the 1st golden cross since Friday... But the BB is quite tight, so that is telling me there is a bigger move that will come soon, lets all hope it's to the upside...
Going to the 4h chart, and looking at the MACD it's going to have a golden cross soon, with the hourly chart going to have a golden cross... I can see it soon re-testing the yellow line in the $10100 zone and I hope it brakes it and go up from there...
Out on the daily, the MACD is still looking like it wants to head down even more, but that's ok with the hodlers and like me the miners... It's just a better place to get that BTC... With the 9 EMA in yellow and the 18 EMA in blue... It doesn't look so good, it may go and give us a death cross...
I have seen a video from "Benjamin Cowen "He gives a different view on the crypto markets"" on youtube, that golden crossing may give a big red day... But the market should continue going up like it was before the crossing... Have we seen that big red day?
On this chart, the blue line is the VWAP-Anch it did start on 01.01.2020 at 00:00:01 AM UTC... So far this year has been good to us, but I can see it re-test it again this year... Because we are so far above it, I can see it coming back down to it and maybe have a day or two under it just like it did in early January...
In this chart, I am using the blue VWAP-Anch like last time, but the white line is the VWAP-Anch from all-time high on Coinbase and the yellow line is from about the bottom of the market from the top of it... I'm loving this chart so far this year, look at the price and the 2020 VWAP-Anch it's over the other two... I can't say how high this market will go, but I can see Bitcoin making some big moves soon... I'm looking to the upside...
Going out on the monthly chart and using the Ichimoku cloud the price of Bitcoin is trying to get above the clouds... Will it get there and will it stay?
But I think this pullback is a good thing, it would be nice to see a mooning Bitcoin price...
But the aftermath would not be so good, look back since the top two years ago, I don't want to see a falling price in Bitcoin for the next 2-3 years and don't forget all the people saying Bitcoin is dead... We want time for people to see the charts and get acquainted with the technology and what it can do for all of us...

GoDaddy Support LevelsGoDaddy - We have seen the Golden Cross on the Daily, the MA 50 moves over the MA 100, a sign of a bullish market again. This happened early January, so we expect a bullish return. This can be tested soon, as Crosses tend to have a second interaction after first crossover. Overall since 2017, we have a Bullish Symmetrical Pennant, which will be a continuation pattern of the Bullish Market we have seen. This may not come into play for a long time, for now, we see consolidation.
Current SHORT TERM upward channel has reversed and the first Fib Retracement line of 50% is being tested. If this breaks, the next level down will be short term level of 61.8% (around $65-$66), and last chance for short term bullish continuation.
If this line breaks, we have a long term 38.2% still in play, this bullish pattern reversed and bounced off the 50% line. This remains a bullish channel, and can be seen as the very first consolidation for a much larger pattern.
When you look at Earnings, this company has started to outperform several quarters a year. Analysts prices remain around $88 for a 12 month period. We could easily see a drop down to $65.50 or even down as low as $63. However, if bounces off this 50% or 61.8% line with LOTS of volume, be ready for a rally up to $70-$74 - even up to $77.

#ENJ#ENJ/BTC
Buy now at 1300
Target 1 : 1450
Target 2 : 1600
Target 3 : 1750
Retest Done
Good Luck :)
E

$xbt boutta get some blowoff topLaddering asks in the 9.35k-9.55k range, stop above the upper range and historic PA, targeting median of this larger range from 8.1k to 9.6k.
4.98R/R, equal sizing on all asks.
Here we go!

What to expect from a Golden Cross?The last time the 55 and 100 EMA's crossed up was on 7 April 2019.
Recently they have crossed up again, and we'll see what kind of effect this has on the bitcoin price over the next few months - of what could be a sustained bull run.

Moving Averages Golden/Death cross tradingA simple trading strategy everyone can understand.
Take the average of 200 days worth of stock prices of a stock, compare that to 50 days average.
If the two crosses and are going up, you buy. If the two crosses and are going down, you sell.

20/20 Market Clarity | $xbtLonging a very tight level cluster below range, leveling 8123-8150.
Bidding 8136.5, playing a capitulation spring into that level and jumping back above, before trending up higher to clean 9.5K in the new decade.
Stop surgically selected at 7978, using HTF OHLC magic.
9.03R/R, this will be the first serious bitcoin trade of the year, and beginning of my work on this fresh ROE account.

More down-time to come but big things aheadshort insight here. As you can see, our previous bottom before dropping to 3k at the end of 2018 has become our triple bottom and the uptrend has now carried through. We have moved equal volume as the run up in July 2019 and our 50MA is is looking to get with that 200MA to make sweet love.
I believe we will fall to 8.2 - 8.3 k to find our support levels from Sept/Oct 2019, and that may be when we see a golden cross form, which will carry us to 10K. Anything after that is not worth speculation, I dont believe we have much game in 10K yet, and anything moving back up that high will just for a 3rd top on a very large time frame.
Remember, look at the bigger picture. (Get off the minute charts, ya clowns.)
Cheers,
-Money

VERTCOIN MACD CROSS AND BULLISH MOMENTUMVertcoin is looking to make some moves up. A nice lil' 40% trade.
Who knows?
Good luck.
VLong
