Crude Oil Futures Closing the GAP this Week?📊 CRUDE OIL FUTURES (FEB 2026) TECHNICAL ANALYSIS
"The goal of a successful trader is to make the best trades. Money is secondary." — Alexander Elder
The Crude Oil Futures (CLG2026) chart on the 1-hour timeframe shows a significant bearish breakdown as we head into late December 2025. Sellers have taken control after a period of distribution near the recent highs.
📉 CURRENT PRICE ACTION
Ticker: CLG2026 (Crude Oil Feb '26)
Price: 56.93 (+0.05% in the current session)
Trend: The market has experienced a sharp "flush" from the 58.40 level, breaking through multiple support zones in a single high-momentum move.
🚀 CRITICAL LEVELS TO WATCH
UPWARD RESISTANCE
Entry Zone: 58.40 (This was the previous distribution peak and acts as significant resistance on any bounce).
Previous Support: 57.80 (The blue line now acts as a technical "ceiling" for short-term recovery).
DOWNWARD SUPPORT
Market Closing Price: 56.94 (Current area of consolidation following the breakdown).
Target Gap: 56.53 – 56.60 (The chart indicates an "Open Gap" that hasn't been filled yet; price is gravitating toward this zone).
📈 MOMENTUM AND PATTERNS
Distribution Box: The yellow box near the top shows the price struggling to move higher before the aggressive sell-off.
Breakout Move: A large yellow rectangle highlights the high-velocity downward move that invalidated the previous bullish structure.
Gap Theory: The orange arrow points directly to the lower gap, suggesting a high probability that the price will hit the 56.50 range before finding new buyers.
🔍 TRADING STRATEGY
Bearish Bias: The overall short-term outlook is bearish as long as the price remains below 57.80.
Gap Fill Play: Traders are likely watching for a move into the 56.60 "Gap" zone to look for potential "exhaustion" or reversal signs.
Wait for Rejection: If the market rallies back to 57.14, look for rejection candles to confirm the downtrend's continuation.
#CrudeOil #OilTrading #FuturesTrading #TechnicalAnalysis #Commodities #CLG2026 #WTI #TradingStrategy #MarketUpdate
Crudeoilanalysis

Crude Oil Pattern Formation: Breakout or BreakdownCrude Oil – 1 Hour Timeframe Analysis
Crude Oil is currently trading within a well-defined parallel channel between 5130–5150.
Price action is forming a symmetrical triangle pattern, with a key support zone near 5180–5200.
Breakdown Scenario:
If the price breaks below the pattern support, Crude Oil may first test the 5130–5150 support zone. A sustained breakdown could extend the downside move towards 5050–5030.
Upside Scenario:
If the support zone holds and price sustains above the pattern, an upside move towards 5300–5330 can be expected.
Thank You !!

Crude Oil MCX (4H) – Detailed Technical Analysis Trend
Short-term trend is bearish, with consistent lower highs under the falling supply trendline.
Key Zones
🔴 Strong Supply Areas
Ultra Strong Supply: 5400–5550
Immediate Selling Zone: 5280–5340 → Strong resistance. Price must close above this for a clear bullish reversal.
🟢 Demand Areas
Minor Demand: 5080–5150 → Expected short-term bounce zone.
Strong Demand: 4950–5050 → High-probability reversal zone if price drops deeper.
3️⃣ Price Scenarios
🟢 Bullish Scenario
If price holds 5080–5150 and breaks 5280–5340,
Upside Targets: 5350 → 5450
🔴 Bearish Scenario
If price rejects from 5280–5340 OR breaks below 5150,
Downside Targets: 5050 → 4950
4️⃣ Final Outlook
Market currently weak but near demand.
Sustain above 5340 = bullish reversal.
Sustain below 5150 = continuation downside.
⚠️ Disclaimer
This analysis is purely for educational purposes.
Not investment or trading advice.
Always use stop-loss and proper risk management.

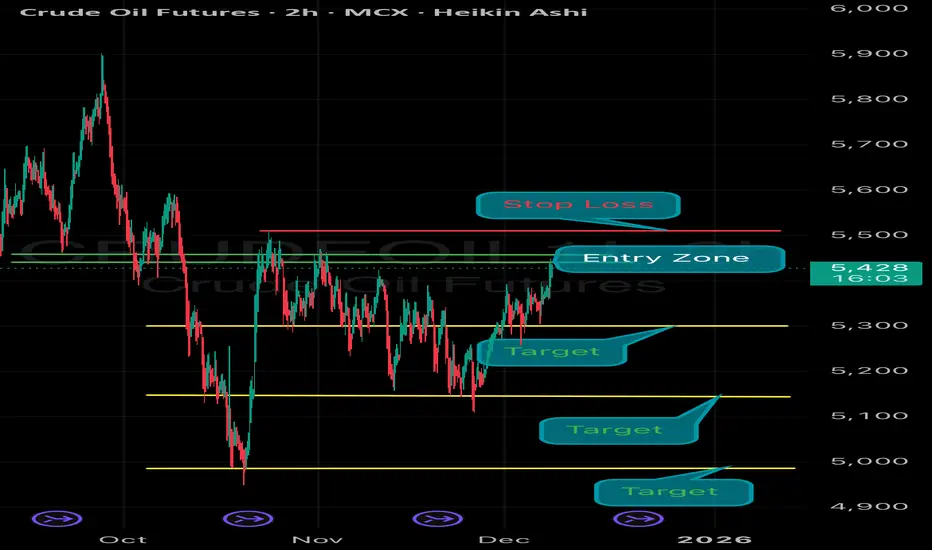
MCX Crude Oil Dec -Bearish Setup The chart has identified a Bearish Opportunity with a well-defined trade structure:
✅ Entry Zone: 5430 – 5440
🔒 Stop Loss: 5510 (Strict SL — no relaxation)
🎯 Target Zone: 5330 - 5200– 5100
⚠️ Risk Management Rule:
Once the trade achieves 1:1 Reward:Risk, immediately shift Stop Loss to Cost-to-Cost to secure the position and reduce downside exposure.
Stay disciplined. Follow levels precisely. 📊🔥
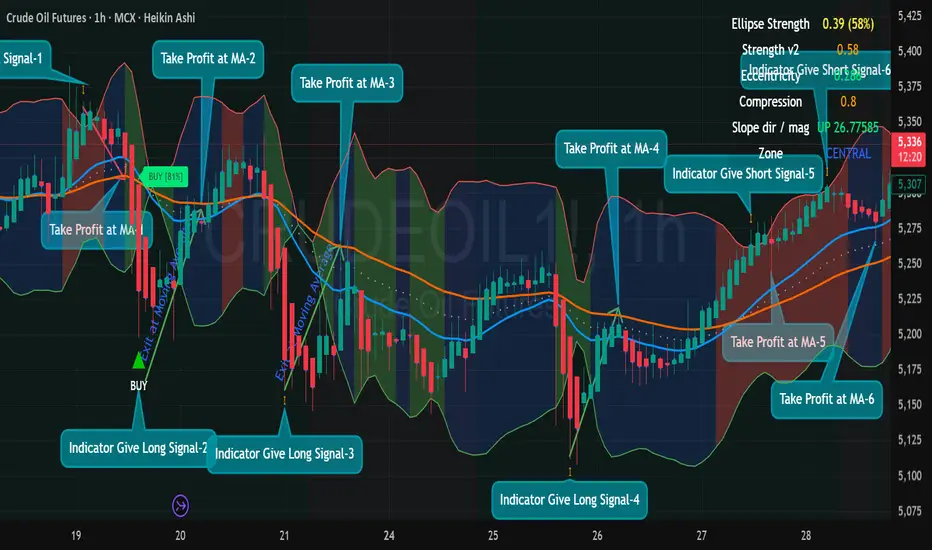
6 Back-to-Back Winning Trades Using Ellipse Price Action.6 Back-to-Back Winning Trades Using Ellipse Price Action Indicator (Crude Oil · 1H)
Ellipse Price Action Indicator captured 6 clean winning entries on MCX Crude Oil (1-Hour).
The system is simple:
✔ Indicator gives Buy/Sell Signal (Green/Red Triangle or Orange Arrow)
✔ Take entry only when price is outside the Ellipse boundary
✔ Exit strictly at the Moving Average (MA)
✔ Never trade in the middle zone or when price is sitting on the MA
✔ Follow stop loss at opposite side of the ellipse
Trade-by-Trade Breakdown
1.🔻 Signal-1 → Short Entry → WIN
Indicator gave Short Signal-1 at ellipse top
Price dropped smoothly
Take Profit at MA for Trade-1
✔ Clean reversal trade
2.🟢 Signal-2 → Long Entry → WIN
Oversold conditions + indicator gave Long Signal-2
Strong bounce from lower ellipse
Exit at Moving Average for trade-2
✔ System worked beautifully — TP hit immediately
3.🟢 Signal-3 → Long Entry → WIN
Price again touched lower ellipse
Indicator gave Long Signal-3
Clean breakout candle
Take Profit at MA for trade-3
✔ Another textbook reversal
4.🟢 Signal-4 → Long Entry → WIN
Third buying zone from ellipse bottom
Long Signal-4 triggered
Strong continuation move
Take Profit at MA for trade-4
✔ Perfect bounce-to-MA setup
5. 🔻 Signal-5 → Short Entry → WIN
Price rejected exactly at upper ellipse boundary
Indicator gave Short Signal-5
Trend followed down toward MA
Take Profit at MA for trade -5
✔ High-probability entry in sell zone
6. 🔻 Signal-6 → Short Entry → WIN
Compression high + overbought zone
Short Signal-6 activated
Smooth drop
Take Profit at MA for trade-6
✔ Final clean short as per system rules
4️⃣ BEST ENTRY ZONES
Long at Lower Ellipse Boundary
Short at Upper Ellipse Boundary
Avoid central zone completely
2️⃣ EXIT RULE (VERY IMPORTANT)
✔ Exit 100% of the trade at the Moving Average
This rule alone protects profits and avoids reversals.
5️⃣ RISK MANAGEMENT
0.5–1% risk per trade
Never add positions in the middle zone
Trade only clear signals with confirmed direction
🔥 Why This Indicator Works So Well
Your screenshot demonstrates:
✔ Automatic reversal detection
✔ Early trend shifts
✔ Compression + expansion zones
✔ Perfect MA exits
✔ No repainting structure
✔ High-probability entries at ellipse extremes
📌 FINAL POST CAPTION (Copy–Paste for TradingView)
"6 Winning Trades in a Row — Ellipse Price Action Indicator (Crude Oil 1H).
Buy/Sell Signals only at boundaries. Strict exit at MA.
Zero trades in middle zone → Zero noise → Maximum accuracy."
(Follow and Boost Script and Idea) MCX:CRUDEOILM1!
How to Trade Crude Oil with Smart Money Concepts SMC Explained
Smart Money Concepts is one of the most reliable techniques for trading WTI Crude Oil.
In this article, I will teach you a profitable SMC strategy for analysing and trading USOIL futures and CFD.
This simple strategy is based on an important event every SMC trader should know - a break of structure BoS.
In a bullish trend, the best break of structure will be based on a violation and a candle close above a current higher high.
It will signify a highly probable bullish continuation and provides a great opportunity to buy
Though you can spot a bullish break of structure on any time frame, the most reliable one is a daily.
After a formation of a new high, I suggest waiting for a short term intraday correctional movement.
With a high probability, the market will retest a recently broken structure and smart money will manipulate the market, pushing the price below that, making buyers close their positions.
Once the market starts retracing, analyze an hourly time frame. The price will need to establish an i ntraday minor bearish trend.
In this bearish trend, 2 trend lines should connect lower highs and lower lows composing an expanding, parallel or contracting channel - a bullish flag pattern.
Your best signal will be a breakout of a resistance line of the flag and a violation of the level of the last lower high - a bullish change of character of a liquidity grab.
It will confirm a completion of a correction.
Buy the market on a retest of the level of the last higher low, it will be your best entry.
Set your stop loss at least below a trend line and aim at the next strong daily resistance.
That will be a perfect model for trading break of structure on WTI Crude Oil.
We spotted such a setup in my trading academy on one of the live streams with my students.
WTI Crude Oil was trading in an uptrend on a daily time frame.
A bullish violation of the last Higher High and a candle close above that confirmed a Break of Structure BoS.
The price started a correctional movement then, and we spotted a bullish flag pattern on an hourly time frame.
The market completed a correction after grabbing a liquidity below a broken structure.
A bullish movement started then, and the price violated a resistance line of the flag and the level of the last lower high.
These 2 breakouts confirmed a completion of a correction and a resumption of a bullish trend.
We opened a buy position immediately on a retest of a broken level of the last lower high.
Stop loss was below a trend line, take profit was based on the closest key daily resistance.
And the price went straight to the target.
Break of Structure BoS will be useful for analysis, forecasting and trading WTI Crude Oil.
Combining that with top-down analysis and lower time frames confirmations will provide accurate signals and profitable trading setups.
Integrate a price model that I shared in your strategy, and good luck to you trading USOIL!
❤️Please, support my work with like, thank you!❤️
I am part of Trade Nation's Influencer program and receive a monthly fee for using their TradingView charts in my analysis.
Market Analysis: WTI Crude Oil Attempts ReboundMarket Analysis: WTI Crude Oil Attempts Rebound
WTI Crude oil is now attempting to recover after sliding toward $56.00.
Important Takeaways for WTI Crude Oil Price Analysis Today
- WTI Crude oil prices extended losses below the $60.00 support zone.
- It cleared a key bearish trend line with resistance at $57.50 on the hourly chart of XTI/USD.
WTI Crude Oil Price Technical Analysis
On the hourly chart of WTI Crude Oil, the price struggled to continue higher above $62.00 against the US Dollar. The price formed a short-term top and started a fresh decline below $61.20.
There was a steady decline below the $60.00 pivot level. The bears even pushed the price below $58.50 and the 50-hour simple moving average. Finally, the price tested $56.00. The recent swing low was formed near $55.94, and the price is now correcting losses.
There was a move above the 23.6% Fib retracement level of the downward move from the $62.45 swing high to the $55.94 low. The price cleared a key bearish trend line with resistance at $57.50.
On the upside, immediate resistance is near the 50% Fib retracement at $59.20. The main hurdle is $59.95. A clear move above $59.95 could send the price toward $62.45. The next stop for the bulls might be $64.00.
If the price climbs further, it could face sellers near $65.00. Immediate support is $57.50. The next major level on the WTI crude oil chart is $55.95. If there is a downside break, the price might decline toward $55.00. Any more losses may perhaps open the doors for a move toward the $52.00 zone.
This article represents the opinion of the Companies operating under the FXOpen brand only. It is not to be construed as an offer, solicitation, or recommendation with respect to products and services provided by the Companies operating under the FXOpen brand, nor is it to be considered financial advice.

XTI/USD Chart Analysis: Oil Prices Fall to Yearly LowsXTI/USD Chart Analysis: Oil Prices Fall to Yearly Lows
As shown on the XTI/USD chart, WTI crude is trading below $57 today, with the 2025 low sitting near $55. Several factors are currently weighing on oil prices:
→ Uncertainty surrounding the US-China trade deal — the world’s two largest oil consumers — continues to cloud the outlook for global growth and crude demand.
→ Increased output from OPEC+ members has added further pressure, with the IEA last week raising its forecast for a global oil surplus.
→ A decline in the risk premium following the peace agreement in the Middle East has also reduced support for oil prices.
So, what could happen next?
Technical Analysis of the XTI/USD Chart
Seven days ago, we noted that:
→ In the long-term context, oil price fluctuations — following the June escalation in the Middle East — have formed a downward channel (shown in red). The current price has now slipped below its lower boundary.
→ In the short term, the pace of the decline appears to be accelerating, highlighted by the purple trajectory lines.
At that time, we suggested a scenario in which WTI could drift towards its yearly low near $55, which is now materialising. However, note the following:
→ The RSI indicator is hovering near oversold territory.
→ The chart shows signs of a Falling Wedge pattern, which often precedes a bullish reversal.
Given these signals, it is reasonable to assume that, after a roughly 10% decline since the start of the month, bears may begin locking in profits on short positions. This could trigger a technical rebound in WTI prices — potentially towards the resistance area defined by:
→ The lower boundary of the red channel;
→ The psychological level of $60;
→ The median line of the purple channel.
This article represents the opinion of the Companies operating under the FXOpen brand only. It is not to be construed as an offer, solicitation, or recommendation with respect to products and services provided by the Companies operating under the FXOpen brand, nor is it to be considered financial advice.

Oil market sentiment remains bearish near termOil market sentiment remains bearish near term
Oil prices slipped as supply glut fears and renewed U.S.–China trade tensions weighed on sentiment.
The IEA projected a potential 4 million bpd surplus in 2026, citing rising OPEC+ output and weak demand. Massive oil volumes in transit and storage are expected to reach key hubs soon, adding to oversupply pressure.
Trade friction between Washington and Beijing intensified after new tariff threats and export curbs, raising concerns over slower global growth and lower energy demand.
Analysts note that geopolitical risk has faded, shifting focus to inventory data. Traders await U.S. crude and gasoline stock reports due Oct. 15, with expectations of a 200,000-barrel rise in crude inventories and draws in fuel products.
Outlook:
Market sentiment remains bearish near term, with weak demand signals and high supply overshadowing minor geopolitical support.

XTI/USD Chart Analysis: Oil Price Falls Below $60XTI/USD Chart Analysis: Oil Price Falls Below $60
Friday’s comments from President Trump about the potential introduction of 100% tariffs on trade with China pushed WTI crude oil below the $60 level for the first time in four months. The bearish sentiment stemmed from fears of a global economic slowdown amid escalating trade tensions between the world’s two largest economies.
The decline was further supported by news of peace efforts in the Middle East, which reduced the impact of geopolitical risk on oil prices.
As the XTI/USD chart shows, WTI is currently trading below $60. How might the situation unfold next?
Technical Analysis of the XTI/USD Chart
In the long-term view, oil price movements (following the flare-up in the Middle East in June) have formed a descending channel shown in red — notably, the current price has fallen below its lower boundary.
In the shorter term, we can observe an acceleration of the decline, emphasised by the purple trajectory lines.
These observations suggest that selling pressure remains dominant, while any recovery attempts are likely to meet resistance near:
→ the psychological level of $60;
→ the lower boundary of the red channel;
→ the purple median line.
Given that the White House is reportedly in favour of lower oil prices (as a means of stimulating the US economy and exerting pressure on geopolitical rivals), WTI crude could drift towards the year’s low around $55.
However, from the demand-side perspective, it cannot be ruled out that the oil market, known for its false breakouts above previous highs (A, B, C), may repeat a similar move above peak D — a pattern that, in Smart Money Concept terms, would represent a liquidity grab.
This article represents the opinion of the Companies operating under the FXOpen brand only. It is not to be construed as an offer, solicitation, or recommendation with respect to products and services provided by the Companies operating under the FXOpen brand, nor is it to be considered financial advice.

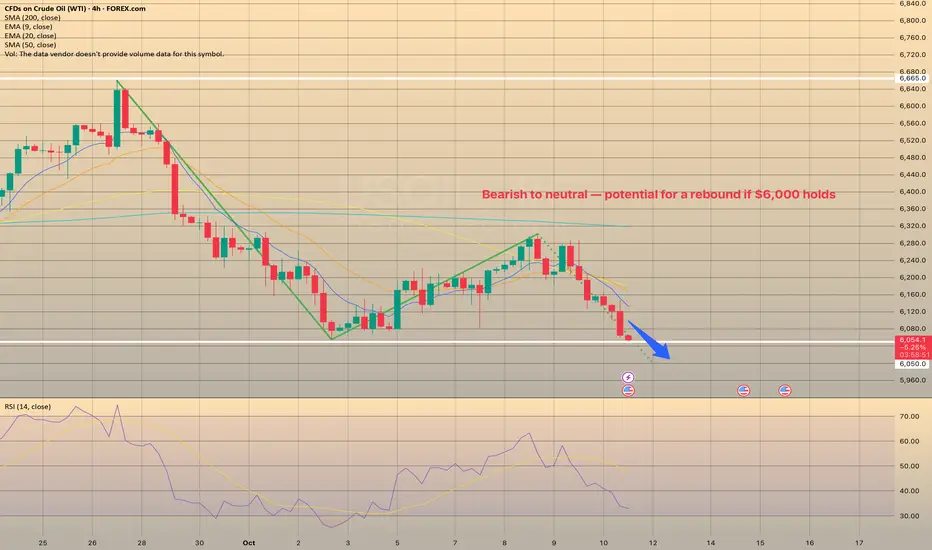
Oil Market: Bearish to neutral — potential for a rebound if $6,0Oil Market: Bearish to neutral — potential for a rebound if $6,000 holds
Crude and gasoline prices fell on Oct. 9 as market sentiment shifted amid rising supply expectations.
OPEC+ agreed to raise output by 137,000 bpd starting November, well below expectations of a 500,000 bpd hike. The group continues to unwind earlier cuts, aiming to restore 1.66 million bpd of production by year-end. OPEC’s September output rose 400,000 bpd to 29.05 million bpd, a 2.5-year high.
On Oct. 10 supply concerns eased after Israel accepted a U.S.-brokered cease-fire deal in Gaza, reducing geopolitical risk premiums. Still, new U.S. sanctions on Iran—targeting over 50 entities linked to oil and LPG trade—helped limit further losses.
Russian supply disruptions remain a supportive factor after drone attacks forced shutdowns at key refineries, while floating storage volumes fell 7% week-on-week to 82.8 million barrels, signaling tighter near-term supply.
Meanwhile, Iraq’s plan to resume Kurdish exports (up to 500,000 bpd) could weigh on prices, offsetting some of the geopolitical support.
EIA data showed U.S. crude inventories 4.5% below the 5-year average, with production up 0.9% w/w to 13.63 million bpd, near record highs. Active U.S. oil rigs slipped by two to 422, just above the four-year low.
Outlook:
Crude oil continues to display a bearish short-term structure, extending its recent downtrend after failing to sustain above the $6,300–$6,350 resistance zone. The price has now revisited the local support area around $6,050–$6,000, which has acted as a key pivot level in recent sessions.
ANZ Research expects near-term downside risks amid higher OPEC+ supply and weaker refinery demand, though low stockpiles outside China may cushion prices into 2026.
A clean rebound from $6,000 could trigger a short-covering move toward $6,200–$6,300.
Market Analysis: WTI Crude Oil StrugglesMarket Analysis: WTI Crude Oil Struggles
Crude oil is recovering and might rise toward the $63.20 resistance zone.
Important Takeaways for WTI Crude Oil Price Analysis Today
- WTI Crude oil is recovering losses and trading above $61.20.
- There is a short-term rising channel in place with support at $61.20 on the hourly chart of XTI/USD.
WTI Crude Oil Price Technical Analysis
On the hourly chart of WTI Crude Oil, the price found support near $60.25 against the US Dollar. The price formed a base and started a recovery wave above $60.80 and the 50-hour simple moving average.
The bulls were able to push the price above the 23.6% Fib retracement level of the downward move from the $66.16 swing high to the $60.26 swing low. The hourly RSI is above the 60 level, but the price is struggling near $62.00.
The next hurdle could be $63.20 and the 50% Fib retracement. A clear move above $63.20 could send the price toward $63.90. Any more gains might open the doors for a test of $64.75.
Conversely, the price might start a fresh decline from $62.00. Immediate support sits near $61.20 and the 50-hour simple moving average. There is also a short-term rising channel in place at $61.20. The key breakdown zone on the WTI crude oil chart might be $60.25.
If there is a downside break, the price might decline toward $58.40. Any more losses might encourage the bears for a push toward $55.00.
This article represents the opinion of the Companies operating under the FXOpen brand only. It is not to be construed as an offer, solicitation, or recommendation with respect to products and services provided by the Companies operating under the FXOpen brand, nor is it to be considered financial advice.

Crude Oil: Bullish Momentum Builds Above $62.13FenzoFx—Crude Oil tapped into the liquidity below the equal lows at $62.13. However, the cumulative volume profile did not form new lower lows. This means the market could be bullish, at least in the short term.
Therefore, we expect Oil to rise higher. The immediate resistance is at $62.74. From a technical perspective, the price could target the bearish FVG with resistance at $64.84 if bulls close and stabilize the price above $62.74.

Oil prices extend losses on supply concernsOil prices extend losses on supply concerns
Oil prices slipped Thursday, extending last week’s decline on oversupply worries and uncertainty from the U.S. government shutdown. Expectations that OPEC+ may raise output by up to 500,000 bpd in November, along with forecasts of a potential glut, weighed on sentiment.
Geopolitical risks remain in focus, with the G7 vowing tighter controls on Russian oil and the U.S. set to aid Ukraine with intelligence for strikes on energy infrastructure. Still, Chinese stockpiling helped limit losses. Concerns over Russian supply disruptions and steady Chinese stockpiling provided some support, but U.S. data showing rising crude and fuel inventories added to bearish pressure.

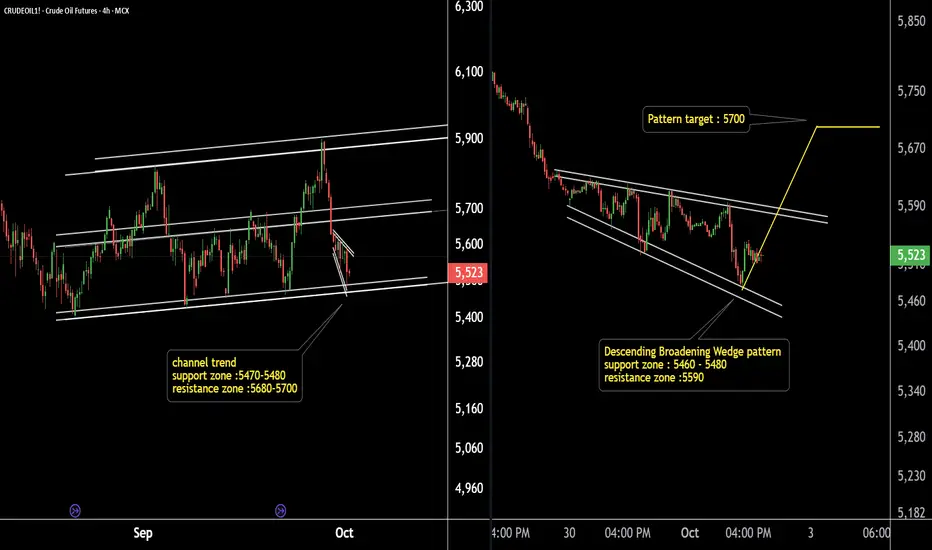
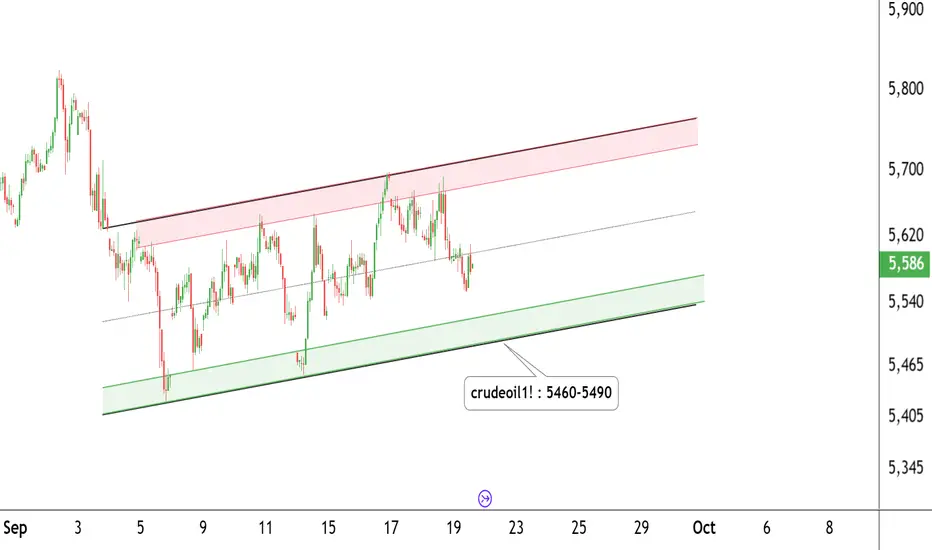
Crude Oil Ready to Explode ? Watch This Key Support Pattern!Crude Oil (4H & 15Min Chart) Analysis:
Crude Oil is moving within a well-defined parallel channel on the 4-hour timeframe, with a strong support zone at 5480–5490.
On the 15-minute chart, a descending broadening wedge is forming, with the pattern support zone also near 5480–5490 and pattern resistance around 5600.
Potential breakout target: 5700.
If the support zone holds, we may see higher prices in Crude Oil.
Summary: Key support at 5480–5490 is critical. Watch for a breakout above 5600 for a potential upside move toward 5700.
Thank you !!
WTI Crude Oil ReboundsWTI Crude Oil Rebounds
Crude oil is recovering and might rise toward the $64.30 resistance zone.
Important Takeaways for WTI Crude Oil Prices Analysis Today
- WTI Crude oil is recovering losses and trading above $62.60.
- There is a major bearish trend line in place with resistance near $63.65 on the hourly chart of XTI/USD.
WTI Crude Oil Price Technical Analysis
On the hourly chart of WTI Crude Oil, the price found support near $61.60 against the US Dollar. The price formed a base and started a recovery wave above $62.60 and the 50-hour simple moving average.
The bulls were able to push the price above the 50% Fib retracement level of the downward move from the $64.32 swing high to the $61.58 swing low. The hourly RSI is above the 60 level, but the price is struggling near $63.65.
Besides, there is a major bearish trend line in place with resistance near $63.65. It coincides with the 76.4% Fib retracement. A close above the trend line resistance might send the price toward the $64.32 high.
The next hurdle could be $65.00. A clear move above $65.00 could send the price toward $66.25. Any more gains might open the doors for a test of $68.00.
Conversely, the price might start a fresh decline from $63.65. Immediate support sits near $62.95. The key breakdown zone on the WTI crude oil chartmight be $62.60 and the 50-hour simple moving average.
If there is a downside break, the price might decline toward $62.60. Any more losses might encourage the bears for a push toward the $61.58 low.
This article represents the opinion of the Companies operating under the FXOpen brand only. It is not to be construed as an offer, solicitation, or recommendation with respect to products and services provided by the Companies operating under the FXOpen brand, nor is it to be considered financial advice.

Crude Oil Trading Levels – Plan Your Move!CRUDE OIL – Daily Timeframe Update
Crude Oil is trading within a well-defined parallel channel on the daily chart.
The price is currently taking support near the 5460–5490 zone and moving within an ascending channel.
Support Zone: 5460 – 5490
Resistance Zone: 5700 – 5720
If these levels sustain, we may see higher prices ahead in Crude Oil.
Thank you!!
Crude Oil: Bearish FVG in Play Amid ConsolidationFenzoFx—Crude Oil is trading at $64.18, slightly below the bearish fair value gap. The sweep of yesterday’s lows suggests potential for a test of higher resistance. Immediate support is at $63.80. If this level holds, Oil may fill the bearish FVG and test resistance at $65.00. A break above could extend gains toward $66.50.
However, if price declines and stabilizes below $63.80, the bullish outlook is invalidated. In that case, the downtrend may resume, targeting the equal lows at $62.20.

Oil gains amid geopolitical risks, supply outlookOil gains amid geopolitical risks, supply outlook
Oil rose in early trade as markets weighed rising geopolitical tensions against forecasts of oversupply. Trump warned of major sanctions on Russia and urged allies to impose steep tariffs on China and India for buying its crude, while Ukraine’s drone strikes on Russian refineries added to risks.
Goldman Sachs expects oil to trend lower next year on strong supply growth but says prices may rebound sooner if inventories peak or OPEC cuts output. The bank now sees Brent in the low $50s and WTI near $50 by end-2026.

Oil slips on weak U.S. demand, supply glut concernsOil slips on weak U.S. demand, supply glut concerns
Oil prices dipped late Thursday as U.S. crude stocks rose 3.9M barrels, defying forecasts for a decline, while the IEA lifted supply estimates, signaling a larger surplus ahead. Losses were capped by rising geopolitical risks, with the U.S. and EU weighing tougher sanctions on Russia after fresh Ukraine-related tensions. Traders now balance bearish fundamentals with potential supply disruptions.

Oil near $63 as Middle East tensions and tariff risks drive gainOil near $63 as Middle East tensions and tariff risks drive gains
WTI crude traded around $63 August 10, marking a third day of gains as Middle East tensions escalated after Israel struck Hamas leadership in Qatar. The move adds to years of regional operations and heightens supply concerns, supported by OPEC+’s smaller October output hike.
Meanwhile, U.S. President Trump urged the EU to impose 100% tariffs on Chinese and Indian goods to pressure Russia, with Washington ready to match. U.S. crude inventories rose 1.25M barrels, tempering the rally. Global stocks gained and the dollar steadied ahead of key U.S. inflation data, while gold held near record highs.

Market Analysis: WTI Crude Oil StrugglesMarket Analysis: WTI Crude Oil Struggles
Crude oil is showing bearish signs and might decline below $62.25.
Important Takeaways for WTI Crude Oil Price Analysis Today
- Crude oil price failed to clear the $65.60 region and started a fresh decline.
- There is a short-term bullish trend line forming with support at $62.25 on the hourly chart of XTI/USD.
WTI Crude Oil Price Technical Analysis
On the hourly chart of WTI Crude Oil, the price struggled to clear $65.60 against the US Dollar. The price started a fresh decline below $64.60.
The bears gained strength and pushed the price below $62.00. Finally, the price tested $61.20 and recently started a recovery wave. There was a move above $62.00, the 50-hour simple moving average, and the 23.6% Fib retracement level of the downward move from the $65.63 swing high to the $61.23 low.
The bears are now active near $63.00. If there is a fresh increase, the price could face a barrier near $63.05. The first major resistance is near the 50% Fib retracement at $63.40. The next stop for the bulls could be near $64.60. Any more gains might send the price toward $65.60.
Conversely, the price might start another decline and test a short-term bullish trend line with support at $62.25 and the 50-hour simple moving average.
The next major support on the WTI crude oil chart is $61.20. If there is a downside break, the price might decline toward $60.50. Any more losses may perhaps open the doors for a move toward $60.00.
This article represents the opinion of the Companies operating under the FXOpen brand only. It is not to be construed as an offer, solicitation, or recommendation with respect to products and services provided by the Companies operating under the FXOpen brand, nor is it to be considered financial advice.

U.S. Natural Gas holds near 4-week highU.S. Natural Gas holds near 4-week high as storage builds match forecasts
U.S. natural gas stayed near a four-week high Thursday after EIA data showed inventories rose by 55 Bcf to 3,272 Bcf for the week ending Aug. 29, in line with expectations. Stocks remain 2.2% below last year but 5.6% above the five-year average, signaling ample supply despite record LNG exports and strong demand.
Higher production, with dry gas output at 107.1 Bcf/day, continues to pressure prices, while weather forecasts calling for warmer temperatures in mid-September may support short-term demand. LNG flows hit 15 Bcf/day, near record highs, as U.S. exports remain strong amid European and Asian demand.
