CRV is now in a bearish structure (4H)CRV has lost a key mid-term trendline and is currently trading below this important dynamic support. Earlier, it also formed a bearish CH (change of character) and established bearish market structure, confirming that sellers are in control.
For a short entry, we must avoid FOMO and wait for a pullback to a strong supply zone before taking any position.
This is not a rush situation; the market often retraces to the supply areas before continuing its bearish momentum.
✅ Entry Strategy (DCA)
We have two entry zones, and we should enter the short position using DCA (Dollar Cost Averaging) to reduce risk and improve the average entry price.
🎯 Targets & Risk Management
Targets are clearly marked on the chart.
At the first target, it is recommended to take partial profit and then move the stop loss to break-even.
If you are risk-averse, exiting at the first target is a valid option.
⚠️ Invalidating Condition
If a daily candle closes above the invalidation level, this bearish analysis will be invalidated, and the trade setup will no longer be valid.
If you would like us to analyze a coin or altcoin for you, first like this post, then comment the name of your altcoin below.
CRV

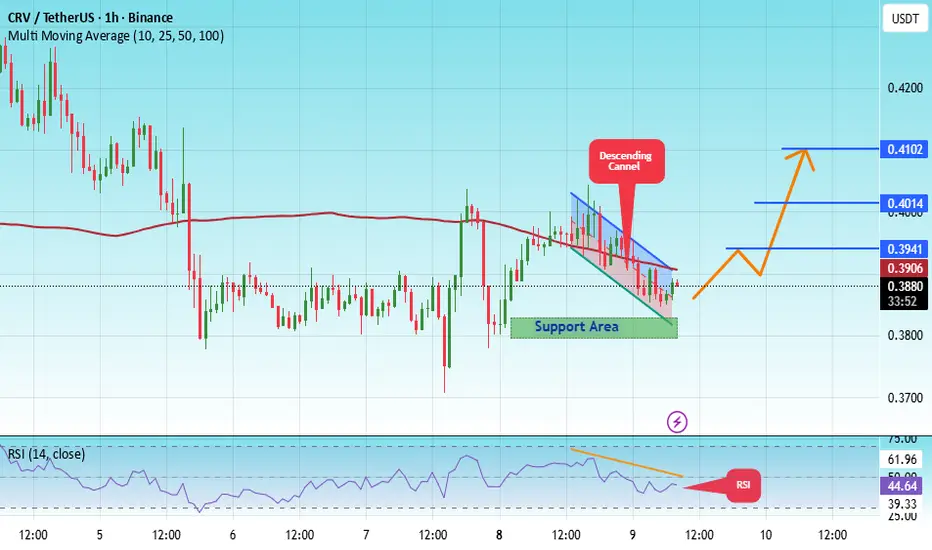
#CRV/USDT breakout alert!#CRV
The price is moving in a descending channel on the 1-hour timeframe. It has reached the lower boundary and is heading towards breaking above it, with a retest of the upper boundary expected.
We have a downtrend on the RSI indicator, which has reached near the lower boundary, and an upward rebound is expected.
There is a key support zone in green at 0.3800. The price has bounced from this level multiple times and is expected to bounce again.
We have a trend towards consolidation above the 100-period moving average, as we are moving close to it, which supports the upward movement.
Entry price: 0.3880
First target: 0.3941
Second target: 0.4014
Third target: 0.4100
Don't forget a simple principle: money management.
Place your stop-loss below the support zone in green.
For any questions, please leave a comment.
Thank you.
crv breaking falling wedge finally breaking long falling wedge consolidation, upon successful breakout expecting recovery, expecting move towards major descending trendline
My cvx playFor my crypto port, instead of crv im gonna make a play on cvx. This is 100% allocation. At this point I'm picking 1 alt and just keeping simple. CRV has massive upside but CVX has 4x the voting power and is below its intrinsic value by a lot while CRV is not. Lastly CVX supply is 100% diluted while CRV still has release of tokens until 3 billion supply. The $55 all time high would require a market cap extremely less probable than CVX hitting my goals. Ty

Curve DAO - CRV price analysisCRYPTOCAP:CRV is approaching an interesting accumulation zone
From a technical perspective, OKX:CRVUSDT shows signs of controlled downside pressure, often seen before impulsive upside moves driven by market makers.
🔑 Key confirmation level: $0.42–0.43
A successful breakout and consolidation above this zone would signal a trend shift.
📊 Mid-term target: $1.10
At this level, #Curve market cap grows from ~$0.5B to ~$1.5B — still relatively undervalued for a long-standing project
🚀 Holding above $1.10 opens the path toward ATH levels near $6.8.
❓Do you expect CRYPTOCAP:CRV to confirm the breakout, or is more accumulation ahead?
______________
◆ Follow us ❤️ for daily crypto insights & updates!
🚀 Don’t miss out on important market moves
🧠 DYOR | This is not financial advice, just thinking out loud

CRV Holding Descending Channel Support, Relief Move PossibleCRV has been trading inside a well-defined descending channel for an extended period, reflecting sustained bearish control. Price recently reached the lower boundary of this channel and is now showing signs of stabilization, suggesting selling pressure is slowing near key support.
The current structure shows price attempting to form higher lows after reacting from the channel base. If CRV continues to hold above this lower boundary and builds acceptance, a relief move toward the upper channel resistance becomes possible. The first major upside area sits near the previous rejection zone around zero point four three, followed by higher resistance near zero point five five if momentum strengthens.
On the bearish side, a clean breakdown below the channel support would invalidate the relief scenario and reopen downside continuation toward lower demand zones.
This setup is driven by descending channel dynamics, support reaction behavior, and short-term structure stabilization. Confirmation through sustained holding above support is essential before expecting upside continuation.

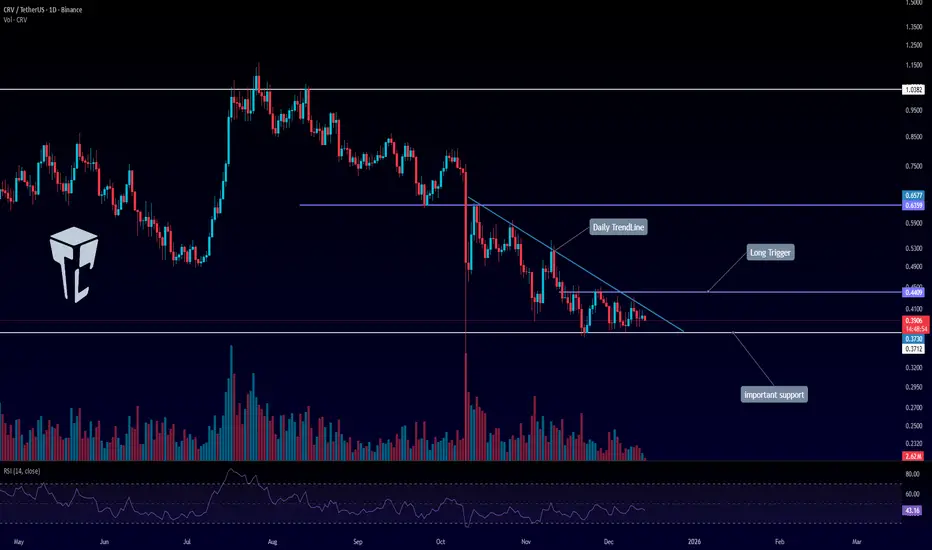
TradeCityPro | CRVUSDT Altcoin Ready to Move!👋 Welcome to TradeCityPro!
Let’s move on to today’s whale-favored coin, CRV, which is widely used by Ethereum whales for governance voting and participation in key decision-making processes.
🌐 Bitcoin Overview
Before we begin, let me remind you once again that at your request, we’ve moved the Bitcoin analysis section to a dedicated daily report — allowing us to analyze Bitcoin’s trend, dominance, and overall market sentiment in greater depth each day.
On the daily timeframe, after getting rejected from $1.03, we saw a corrective move and price settled calmly on the $0.6359 support.
After breaking this support, price moved down toward the $0.3712 support, and we are currently forming lower highs, which has resulted in the formation of a reversal-type trendline.
For long positions, if the daily trendline is broken and the $0.4409 trigger is activated, we can look to open a long position on the breakout of this level.
For short positions, our entry triggers are clearly defined on the chart.
With a break below $0.3730, we can open a short position, and a rejection from the trendline can also provide an early short trigger.
📝 Final Thoughts
Stay calm, trade wisely, and let's capture the market's best opportunities!
This analysis reflects our opinions and is not financial advice.
Share your thoughts in the comments, and don’t forget to share this analysis with your friends! ❤️
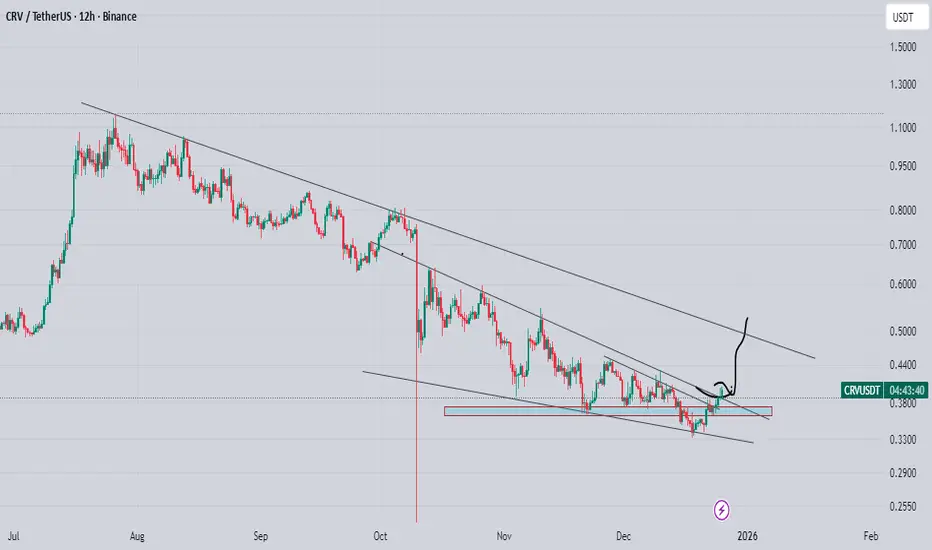
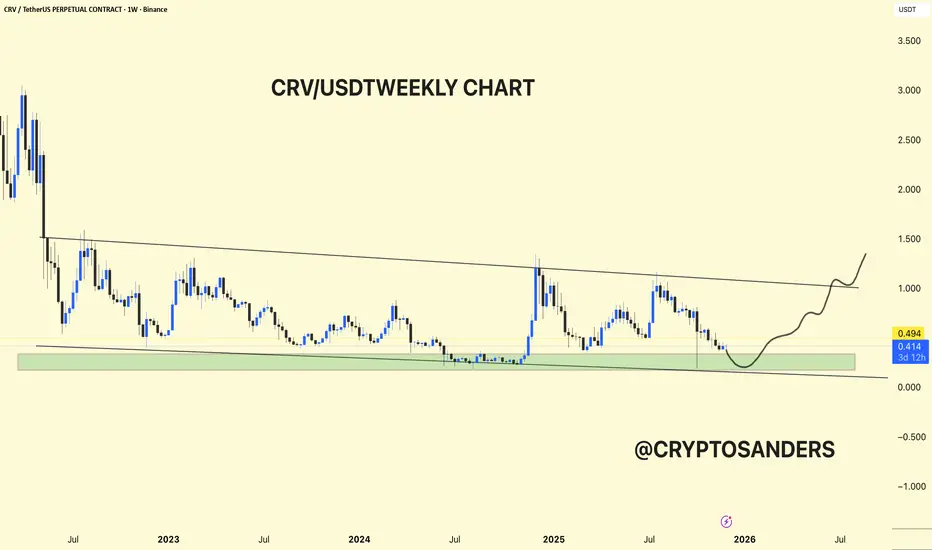
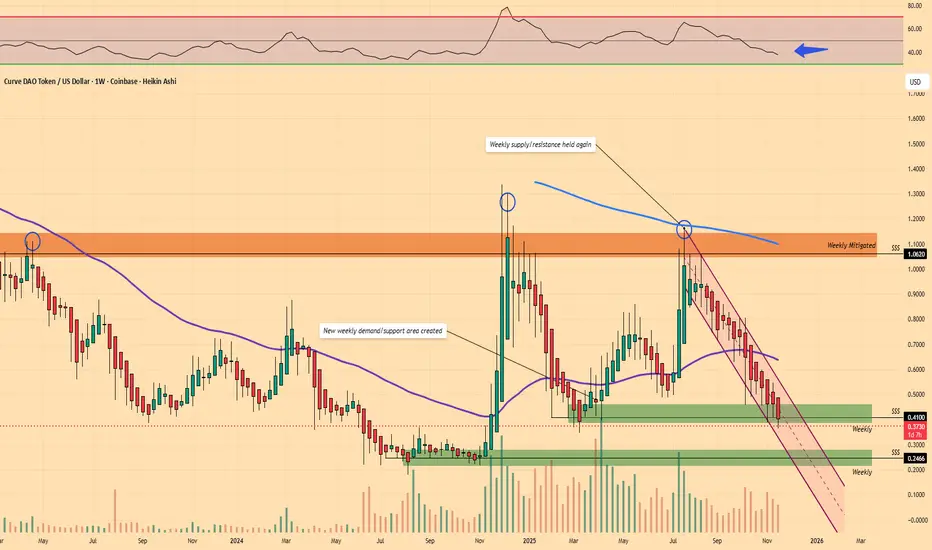
CRV/USDT WEEKLY CHART UPDATE !! The weekly chart, CRV/USDT, is still in a long-term downtrend, but within a large accumulation support zone, where strong surges have previously occurred.
The price has been following a large downward trendline since 2022, with each rally being rejected near that line and then retracing back towards the same horizontal green demand band around 0.35–0.45 USDT.
The current weekly candles are again parked in this green zone, which has repeatedly acted as a floor over the past few years, suggesting a higher-timeframe accumulation or base rather than a new breakdown so far.
The bullish view on the chart shows a rounded bottom forming at this support, followed by a potential move towards the downward trendline and then a breakout towards the 1.00–1.50 region if buyers can maintain momentum.
The bearish risk is that a clean weekly close below the green zone will invalidate the base and make room for a new lower low, so this support acts as a key invalidation zone for any medium to long-term bias.
DYOR | NFA
$CRV / Curve Finance - DeFi Play?Called the move back in May and we are back (due to the weekly resistance/supply holding) retesting a fresh weekly demand/support zone trading below the 50MA.
Hello old friend.
..still a good place to accumulate spot here (once I see buyers) for a quality project.
TradeCityPro | CRV in a Key Zone: Watch for Breakouts or Drops👋 Welcome to TradeCity Pro!
Let’s dive into the CRV coin analysis. It's one of the popular DeFi projects, with a market cap of $608 million, currently ranked 89th on CoinMarketCap.
⏳ 4-Hour Timeframe
On the 4-hour timeframe, this coin is currently sitting on a very important support level and has just bounced up from it.
✔️ In this recent bearish leg, as Bitcoin’s dominance dropped, most altcoins declined less than Bitcoin.
One of these altcoins is CRV, which, as you can see, hasn’t yet lost its support zone.
🔽 For a short position, we can enter if the support level breaks. For an early entry, considering the bearish trend of this coin, we can use momentum triggers like candlestick setups.
🧩 On the other hand, if the price can stabilize above 0.4496, it will be the first sign of a trend reversal to the upside, and we can use this trigger to open a long position.
💡 Personally, I prefer to wait until the price forms a higher high and higher low above 0.4496 before entering. The main confirmation of the trend change will come after breaking 0.5240.
📝 Final Thoughts
Stay calm, trade wisely, and let's capture the market's best opportunities!
This analysis reflects our opinions and is not financial advice.
Share your thoughts in the comments, and don’t forget to share this analysis with your friends! ❤️

#CRV/USDT breakout alert!#CRV
The price is moving within an ascending channel on the 1-hour timeframe and is adhering to it well. It is poised to break out strongly and retest the channel.
We have a downtrend line on the RSI indicator that is about to break and retest, which supports the upward move.
There is a key support zone in green at 0.4100, representing a strong support point.
We have a trend of consolidation above the 100-period moving average.
Entry price: 0.4290
First target: 0.4400
Second target: 0.4515
Third target: 0.4674
Don't forget a simple money management rule:
Place your stop-loss order below the green support zone.
Once you reach the first target, save some money and then change your stop-loss order to an entry order.
For any questions, please leave a comment.
Thank you.

#CRV/USDT#CRV
The price is moving within a descending channel on the 1-hour frame, adhering well to it, and is heading for a strong breakout and retest.
We are experiencing a rebound from the lower boundary of the descending channel, which is support at 0.6600.
We are experiencing a downtrend on the RSI indicator, which is about to break and retest, supporting the upward trend.
We are looking for stability above the 100 moving average.
Entry price: 0.6614
First target: 0.6840
Second target: 0.7120
Third target: 0.7420

CRV/USDT — Major Reversal Incoming or the Next Breakdown?CRV is now sitting at one of its most critical price levels of the entire year.
Price has returned to the 0.42–0.37 support zone, an area that has acted as a last major defense for buyers throughout multiple months.
At the same time, the chart shows a clear downward trendline pressing the price from above — creating a powerful structure:
👉 Consistent lower highs (seller pressure)
👉 Strong, repeated support at the same zone (buyer defense)
This combination forms a large Descending Triangle, a classic pattern that often precedes a large volatility burst — either a strong reversal or a deep continuation breakdown.
The market is quiet, but tense. Volume is thinning.
Everyone is waiting for the next explosive move.
---
Bullish Scenario — A Potential Reversal Born from the Golden Support Zone
For a strong bullish shift, CRV must:
✔️ Hold above the 0.42–0.37 support zone
✔️ Break above the descending trendline with a confirmed 2D/weekly close
✔️ Show clear volume expansion
If these conditions align, this zone transforms into:
🔥 A mid-term launchpad for a larger trend reversal
Bullish targets:
0.56 → first key resistance
0.63 → psychological mid-level
0.82 → broader range resistance
1.04 – 1.165 → mid-term targets on strong bullish continuation
> A successful breakout would officially neutralize the downtrend and shift momentum toward the buyers.
---
Bearish Scenario — If 0.37 Fails, Structure Breaks Down Hard
If CRV loses the 0.37 support:
❌ Historical support collapses
❌ Descending Triangle confirms as a bearish continuation pattern
❌ The existing downtrend accelerates
Bearish targets:
0.30 → first liquidity pocket
0.22–0.20 → full breakdown target
0.12 → extreme scenario if crypto enters a risk-off phase
> Breakdown + failed retest is the strongest bearish confirmation.
---
Pattern Breakdown
1. Major Descending Triangle
Lower highs + horizontal support = compression of energy.
The longer this structure holds, the more powerful the eventual breakout or breakdown.
2. The Golden Demand Zone (0.42–0.37)
Not just any support.
This is a battlefield zone — where smart money often accumulates positions.
3. Lower-High Structure Still Intact
No real bullish trend reversal unless the trendline breaks decisively.
---
Message for Traders
CRV is in a perfect “calm before the storm” setup.
The next major move out of this structure is likely to define CRV’s direction for the coming weeks.
For swing traders and trend-followers, this is one of the most interesting zones on the chart.
---
#CRV #CRVUSDT #Crypto #CryptoAnalysis #TechnicalAnalysis #PriceAction #AltcoinAnalysis #DescendingTriangle #Breakout #Breakdown #CryptoReversal #SupportZone


CRV/USDTBINANCE:CRVUSDT completed its breakout and retest.
All that’s left now for CRV is to hold above the upper channel boundary at $0.7544 and see some volume coming in — it’s looking good.

CurveCrv usdt daily analysis
Time frame daily
Risk rewards ratio >3.2 👈👈
Target 1.12$
Crv is dropping smoothly after it's powefull pump
You can see that crv is in the two downtrend yellow lines
If crv can break this famous pattern, with a good news in crypto market my analysis will happen

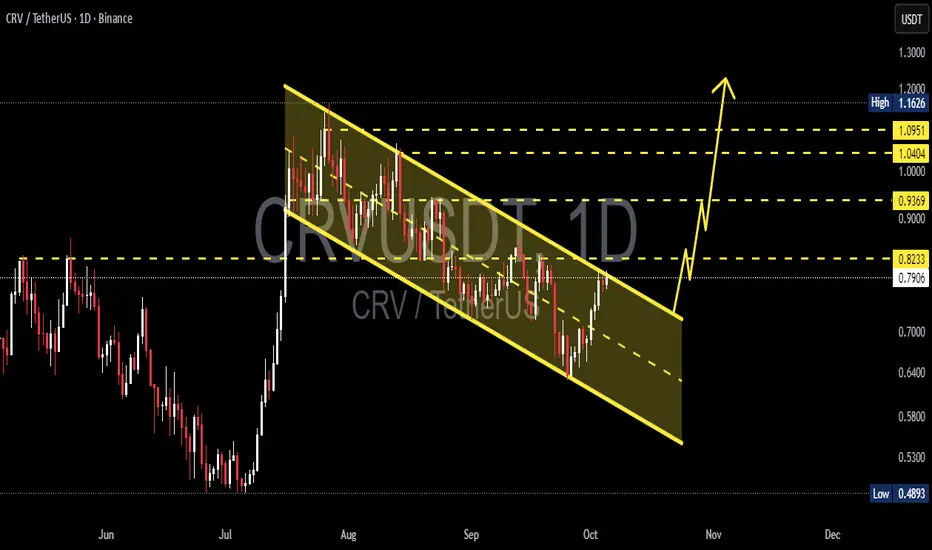
CRV/USDT — Descending Channel: Reversal or Another Rejection?📊 Market Overview
Curve DAO Token (CRV) is currently standing at a critical juncture after spending several months moving inside a well-defined descending channel since early August.
This channel has consistently reflected sustained selling pressure — yet recent momentum shows buyers pushing back, testing the upper boundary of the channel, and signaling a potential shift in short-term trend dynamics.
At the moment, CRV is retesting the key resistance zone between 0.79 and 0.82 USDT, aligning with the upper boundary of the descending channel — a classic decision zone that will likely define whether the next move is a breakout or another rejection.
📈 Technical Structure & Pattern Explanation
Main pattern: Descending Channel
The structure reflects a sequence of lower highs and lower lows, contained within parallel boundaries, forming a clear bearish trend channel.
Technical validation:
Multiple touches on both upper and lower boundaries confirm strong technical respect for the pattern — making it a reliable setup.
Key horizontal levels (based on the chart):
Immediate support: 0.7970
Major resistance zones: 0.8233 → 0.9369 → 1.0000 → 1.0404 → 1.0951
High level: 1.1626
Mid-channel support: 0.64–0.70
Lower boundary: 0.55–0.60
Major structural low: 0.4893
🔥 Bullish Scenario – Breakout and Early Reversal Setup
Bullish narrative:
If CRV successfully breaks and closes a daily candle above 0.8233, it would signal a clear breakout from the descending channel — potentially marking the early stage of a trend reversal after months of downside pressure.
Confirmation checklist:
Rising volume during breakout.
RSI breaking above 50 and trending toward 60–70.
MACD showing a bullish crossover with positive histogram growth.
Upside targets after breakout:
First target: 0.9369 – minor resistance & initial breakout confirmation zone.
Second target: 1.0404 – key psychological and historical resistance.
Extended target: 1.0951 → 1.1626 – if momentum remains strong.
Trading plan & risk management:
Aggressive entry: on daily close above 0.82.
Conservative entry: wait for a retest of the upper channel as support (~0.80).
Stop loss: below 0.74–0.75 (failed breakout zone).
Take profit gradually at the levels mentioned above.
Bullish conclusion:
A confirmed breakout with strong volume could signal the transition from a medium-term downtrend to a neutral or bullish recovery phase.
⚠️ Bearish Scenario – Rejection and Continuation of the Downtrend
Bearish narrative:
If CRV fails to close above the upper trendline and faces rejection near 0.80–0.82, the descending channel remains intact — confirming that sellers still dominate the market structure.
Confirmation checklist:
Bearish candlestick formations (e.g., bearish engulfing, shooting star) near upper trendline.
Weak volume on approach to resistance.
RSI fails to cross 50 and turns downward again.
Downside targets:
First target: mid-channel area ~0.66–0.70.
Second target: lower boundary 0.55–0.60.
Final support: 0.4893 – major structural low.
Trading plan & risk management:
Entry short after confirmed rejection candle.
Stop loss above 0.85–0.90 (outside the channel).
Take profit at mid- and lower-channel zones.
Bearish conclusion:
As long as CRV remains below 0.82 and continues to respect the descending channel, the bearish structure of lower highs and lower lows remains valid.
🔍 Overall Technical Summary
The descending channel defines CRV’s structure clearly — it’s now testing the most crucial point of that formation.
A daily close above 0.8233 could trigger a trend reversal, while a rejection would extend the downtrend.
Momentum and volume confirmation will be key in determining which path unfolds next.
#CRV #CRVUSDT #CurveDAO #TechnicalAnalysis #CryptoAnalysis #DescendingChannel #BreakoutTrading #ChartPattern #CryptoTrading #PriceAction #CryptoMarket
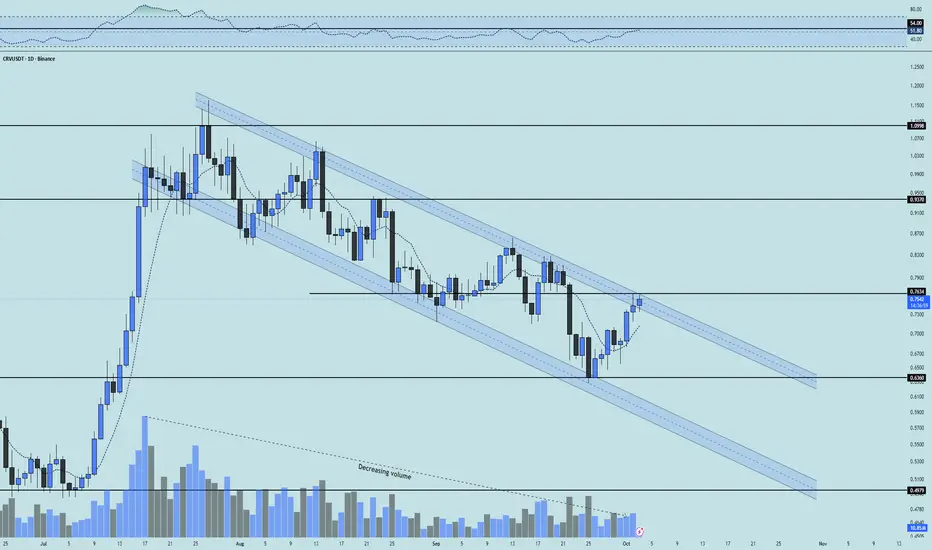
CRV 1D Analysis - Key Triggers Ahead☃️ Welcome to the cryptos winter , I hope you’ve started your day well.
⏰ We’re analyzing CRV on the 1-Day timeframe .
👀 On the daily timeframe for CRV, we can see that after a strong rally, the coin entered a corrective descending channel. Now there are signs of a potential breakout from this channel on this timeframe. If the channel’s upper boundary is broken — which overlaps with the key resistance at 0.7634 — we can say a new bullish trend is starting for this coin. That would mean it’s leaving this compression and correction phase and forming a new upward structure. On the USDT pair, CRV has already managed to build a higher low, and on the BTC pair, it is also gaining momentum for a move. This coin can be added to your watchlist for trading opportunities.
🧮 Looking at the RSI oscillator, after a long period fluctuating below the 50 zone, it is now heading toward its resistance near 54. If RSI pushes through this level, it could break that oscillation resistance and continue higher.
🕯 Since the start of the correction, trading volume has declined, but some long-term holders are still keeping this coin and adding more. These informed buyers may resume accumulation once the descending channel is broken. Pay attention: with an increase in volume, this coin could experience a sharp rally. Recent candles also show stronger buying pressure compared to earlier ones.
💸 On the BINANCE:CRVBTC trading pair, we see a similar descending channel as the USDT pair. If the descending channel breaks on the USDT chart, a similar breakout could occur here, drawing whale attention and fueling a pump with strong growth potential for CRV. A major resistance lies at 629 on this pair; breaking that level would significantly increase the chance of a channel breakout and a strong upward move.
🧠 For trading this coin, a long scenario exists: if the CRV/BTC pair breaks resistance, strong buying volume could flow into CRV. On the USDT pair, if the channel top is broken, with a daily candle close above the prior day’s wick and RSI confirming above 54, a new bullish structure could form for this coin.
❤️ Disclaimer : This analysis is purely based on my personal opinion and I only trade if the stated triggers are activated .


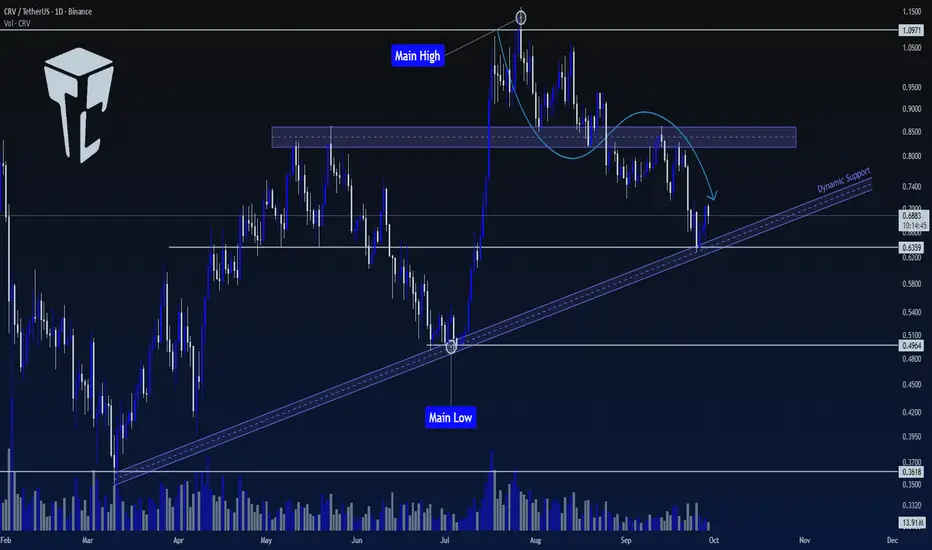
TradeCity Pro | CRV Testing Key Support Zone for Trend Reversal👋 Welcome to TradeCity Pro!
In this analysis, I will be reviewing the CRV coin, one of the popular DEXs, with a market cap of $954 million, currently ranked 81 on CoinMarketCap.
📅 Daily Timeframe
In the daily timeframe, this coin is in an uptrend with a trendline, and the price has currently reached it.
🔍 In higher cycles, the trend of this coin is bullish. However, in lower cycles, after being rejected from 1.0971, a downward movement has started, and it has corrected to the 0.6359 level.
✔️ This level is currently overlapping with the trendline and forms an important support zone.
✨ If this PRZ zone breaks, we can confirm the bearish reversal for CRV, and a short position can be opened. This trigger is one of the first signals for a trend change, and the main trend change will be confirmed after breaking 0.4964.
📈 For a long position, we will have to wait until a proper bullish structure is formed. If the price moves sharply, we will confirm the bullish trend after stabilization above the zone.
❌ Disclaimer ❌
Trading futures is highly risky and dangerous. If you're not an expert, these triggers may not be suitable for you. You should first learn risk and capital management. You can also use the educational content from this channel.
Finally, these triggers reflect my personal opinions on price action, and the market may move completely against this analysis. So, do your own research before opening any position.
CRV Bullish FlagCRV is forming a bullish Wedge.
If the price broke the resistance level at 0.86 and Established above, We can expect a bullish move up to 1.11 area.
Stops at 0.71.

Curve DAO is still working on a bullish strucureCRV still has room to dip while building a CHoCH and getting follow-through. If the price falls into short-term liquidity laddering in is a safe way to prepare for the reversal and expansion.
