CRV potential Long- Price took out the all time low again
- No moving up and offering a potential Long Trade.
- If price does break structure to the upside, we have the confirmation to enter a long position as shown with the squiggle line.

Can CRV make 10x move?BINANCE:CRVUSDT kept making lower lows but doesn't mean it is not gonna go down more. In my opinion BINANCE:CRVUSDT trading in bullflag pattern which is a sign of reversal and checked bottom line 3 times which we can consider as triple bottom. 0.48-0.52 area is crucial which can decide either go

CRVUSDT: Trend in daily time framePlease pay special attention to the accurate trend, channels, and very accurate colored levels
Be careful
BEST
MT

CRV longBreak trendline (dotted red) and reclaim midrange (dotted grey) and I think we see range high


CRV NEW INCREASE VOLUMECRV's low time frame shows a high possibility for a new trend increase which could be confirmed in the coming time frames.
We will follow up on this coin to see if it's able to be confirmed.

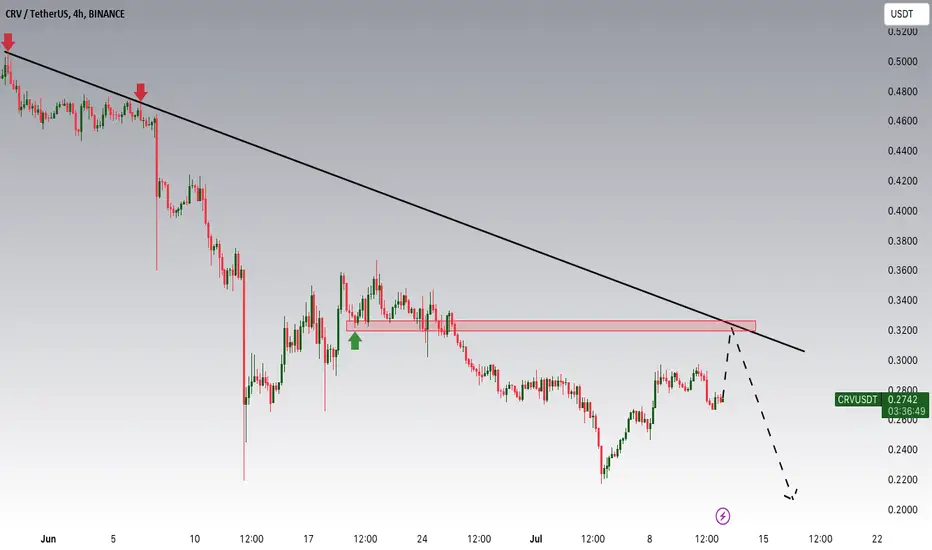
CRVUSDT Is Approaching The TrendHey Traders, in today's trading session we are monitoring CRVUSDT for a selling opportunity around 0.31 zone, CRVUSDT is trading in a downtrend and currently is in a correction phase in which it is approaching the trend at 0.31 support and resistance area.
Trade safe, Joe.
CRVUSDT Potential Long Term Accumulation-DistributionIn this analysis, we focus on a long-term accumulation strategy for CRVUSDT.
Accumulation Zones:
$0.4720: Identified as an accumulation entry point for 10-20% of your position. Potential price movement of approximately 10-15%.
$0.4300: Stronger accumulation zone for an additional 5-10%. Potential p

CRVUSDT Is Approaching The Down TrendHey Traders, in today's trading session we are monitoring CRVUSFT for a selling opportunity around 0.2970 zone, CRVUST is trading in a downtrend and currently is in a correction phase in which it is approaching the trend at 0.2970 support and resistance area.
Trade safe, Joe.

CrvCurve dao
One of the most useful altcoin projects on eth and its a mystery to me that it could become this undervalued
I guess the luna fiasco with stablecoin depegging still hasnt returned faith in this products use if other stable coins were also to fail, nonetheless its one of the most simple use

See all ideas