CRV is now in a bearish structure (4H)CRV has lost a key mid-term trendline and is currently trading below this important dynamic support. Earlier, it also formed a bearish CH (change of character) and established bearish market structure, confirming that sellers are in control.
For a short entry, we must avoid FOMO and wait for a pullback to a strong supply zone before taking any position.
This is not a rush situation; the market often retraces to the supply areas before continuing its bearish momentum.
✅ Entry Strategy (DCA)
We have two entry zones, and we should enter the short position using DCA (Dollar Cost Averaging) to reduce risk and improve the average entry price.
🎯 Targets & Risk Management
Targets are clearly marked on the chart.
At the first target, it is recommended to take partial profit and then move the stop loss to break-even.
If you are risk-averse, exiting at the first target is a valid option.
⚠️ Invalidating Condition
If a daily candle closes above the invalidation level, this bearish analysis will be invalidated, and the trade setup will no longer be valid.
If you would like us to analyze a coin or altcoin for you, first like this post, then comment the name of your altcoin below.
Crvbtc

#CRV/USDT breakout alert!#CRV
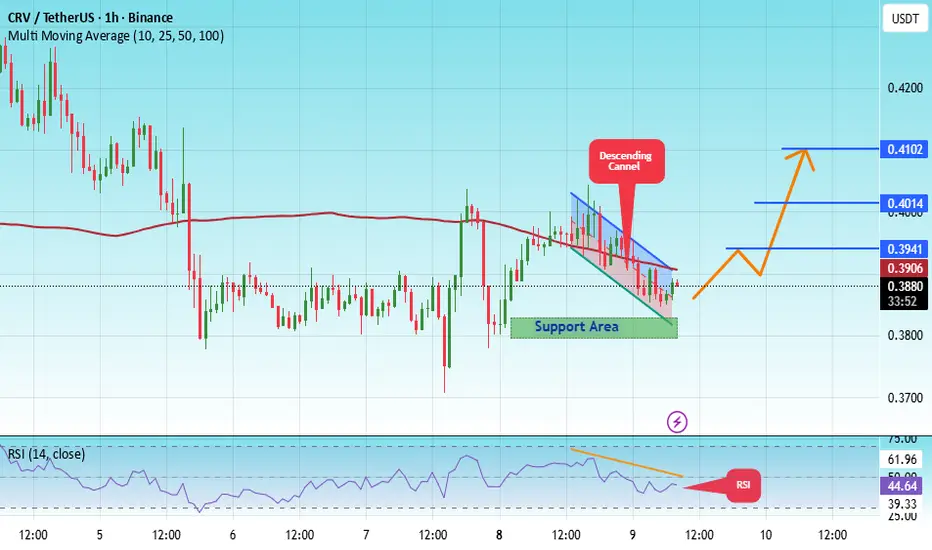
The price is moving in a descending channel on the 1-hour timeframe. It has reached the lower boundary and is heading towards breaking above it, with a retest of the upper boundary expected.
We have a downtrend on the RSI indicator, which has reached near the lower boundary, and an upward rebound is expected.
There is a key support zone in green at 0.3800. The price has bounced from this level multiple times and is expected to bounce again.
We have a trend towards consolidation above the 100-period moving average, as we are moving close to it, which supports the upward movement.
Entry price: 0.3880
First target: 0.3941
Second target: 0.4014
Third target: 0.4100
Don't forget a simple principle: money management.
Place your stop-loss below the support zone in green.
For any questions, please leave a comment.
Thank you.
#CRV/USDT breakout alert!#CRV
The price is moving within an ascending channel on the 1-hour timeframe and is adhering to it well. It is poised to break out strongly and retest the channel.
We have a downtrend line on the RSI indicator that is about to break and retest, which supports the upward move.
There is a key support zone in green at 0.4100, representing a strong support point.
We have a trend of consolidation above the 100-period moving average.
Entry price: 0.4290
First target: 0.4400
Second target: 0.4515
Third target: 0.4674
Don't forget a simple money management rule:
Place your stop-loss order below the green support zone.
Once you reach the first target, save some money and then change your stop-loss order to an entry order.
For any questions, please leave a comment.
Thank you.

#CRV/USDT#CRV
The price is moving within a descending channel on the 1-hour frame, adhering well to it, and is heading for a strong breakout and retest.
We are experiencing a rebound from the lower boundary of the descending channel, which is support at 0.6600.
We are experiencing a downtrend on the RSI indicator, which is about to break and retest, supporting the upward trend.
We are looking for stability above the 100 moving average.
Entry price: 0.6614
First target: 0.6840
Second target: 0.7120
Third target: 0.7420

CRVUSDT UPDATE#CRV
UPDATE
CRV Technical Setup
Pattern: Bullish falling wedge breakout
Current Price: $0.7729
Target Price: $1.07
Target % Gain: 40.20%
CRYPTOCAP:CRV is breaking out of a falling wedge pattern on the 1D timeframe. The breakout signals renewed bullish strength with potential upside toward $1.07, offering around 40% gains. The structure supports a continuation move higher. Always use proper risk management.
Time Frame: 1D
Risk Management Tip: Always use proper risk management.

CRV 1D Analysis - Key Triggers Ahead☃️ Welcome to the cryptos winter , I hope you’ve started your day well.
⏰ We’re analyzing CRV on the 1-Day timeframe .
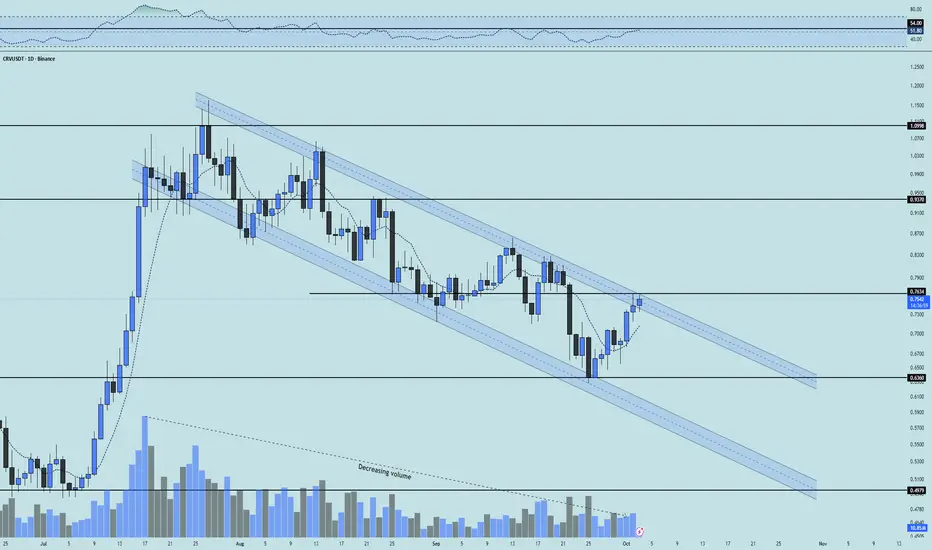
👀 On the daily timeframe for CRV, we can see that after a strong rally, the coin entered a corrective descending channel. Now there are signs of a potential breakout from this channel on this timeframe. If the channel’s upper boundary is broken — which overlaps with the key resistance at 0.7634 — we can say a new bullish trend is starting for this coin. That would mean it’s leaving this compression and correction phase and forming a new upward structure. On the USDT pair, CRV has already managed to build a higher low, and on the BTC pair, it is also gaining momentum for a move. This coin can be added to your watchlist for trading opportunities.
🧮 Looking at the RSI oscillator, after a long period fluctuating below the 50 zone, it is now heading toward its resistance near 54. If RSI pushes through this level, it could break that oscillation resistance and continue higher.
🕯 Since the start of the correction, trading volume has declined, but some long-term holders are still keeping this coin and adding more. These informed buyers may resume accumulation once the descending channel is broken. Pay attention: with an increase in volume, this coin could experience a sharp rally. Recent candles also show stronger buying pressure compared to earlier ones.
💸 On the BINANCE:CRVBTC trading pair, we see a similar descending channel as the USDT pair. If the descending channel breaks on the USDT chart, a similar breakout could occur here, drawing whale attention and fueling a pump with strong growth potential for CRV. A major resistance lies at 629 on this pair; breaking that level would significantly increase the chance of a channel breakout and a strong upward move.
🧠 For trading this coin, a long scenario exists: if the CRV/BTC pair breaks resistance, strong buying volume could flow into CRV. On the USDT pair, if the channel top is broken, with a daily candle close above the prior day’s wick and RSI confirming above 54, a new bullish structure could form for this coin.
❤️ Disclaimer : This analysis is purely based on my personal opinion and I only trade if the stated triggers are activated .
CRV : Will suffering be broken?Hello friends
Well, after reaching a resistance and hitting a higher ceiling, the price has fallen in the two movement logs that we have specified for you.
Now the price has been compressed in a support area and we have to wait for it to move to the specified targets if this range is broken.
*Trade safely with us*

CRVUSDT Forming Bullish ReversalCRVUSDT is currently exhibiting a strong bullish reversal pattern on the daily chart, signaling the potential beginning of a new uptrend. After a prolonged downtrend, the price action has begun to stabilize and show signs of accumulation, with a noticeable uptick in volume accompanying the recent bullish candles. This confluence of technical factors suggests that buyers are beginning to step in with confidence, possibly positioning for a breakout that could yield significant returns.
The chart structure points to a clear bottoming pattern, which often precedes sustained upside movement. CRVUSDT has shown resilience by holding above key support zones and now appears to be reversing with higher lows and increased buying pressure. With overall market sentiment slowly improving, CRV is well-positioned to capitalize on a broader altcoin recovery. A confirmed breakout from this formation could realistically set the stage for a 50%–60% price increase in the coming weeks.
Volume is a key confirmation here—its steady growth reinforces the bullish thesis and indicates strong participation from investors. As more market participants recognize the reversal structure, CRVUSDT could quickly gain momentum. The coin is also historically known for volatile upside swings, and once trend confirmation occurs, it tends to rally with strength and speed. This makes it a compelling asset for swing traders and medium-term investors looking for asymmetric setups.
With growing interest and a strong technical base forming, CRVUSDT could soon enter a high-momentum phase. Keep an eye on breakout levels and monitor volume for continuation signals as this bullish reversal plays out.
✅ Show your support by hitting the like button and
✅ Leaving a comment below! (What is You opinion about this Coin)
Your feedback and engagement keep me inspired to share more insightful market analysis with you!

CRV ANALYSIS (1D)The smaller structure of CRV is bearish. It is expected to reject downward from the red zone, with our rebuy zone being the green area.
Given that the internal structure is bearish, it is ultimately expected to reach the green zone.
Closing a daily candle below the invalidation level will invalidate this analysis.
For risk management, please don't forget stop loss and capital management
When we reach the first target, save some profit and then change the stop to entry
Comment if you have any questions
Thank You
Crypto Signal TodayHello friends🙌
Given the buyers' support for the price and their entry, you can buy in steps in the specified areas with capital and risk management and move to the specified targets📈
Follow us for more signals😉
*Trade safely with us*
Fiery support was revealed...Hello friends
According to our technical analysis and research on this currency, we were able to find important supports for you so that you can buy on those supports in stages and with capital management.
The targets are also specified...
*Trade safely with us*

CRV/USDT : BUY...Hello friends
Due to the good price growth, you can now buy in the specified areas in stages and with capital management and move to the specified goals.
*Trade safely with us*

CRV/USDTHello friends
Due to the heavy price drop, buyers have been supporting the price well on the indicated support, which has caused a good price growth.
Now in the indicated support areas, you can buy in steps with capital management.
If you want to be with us in the Alt Season, send us a message.
*Trade safely with us*

CRVUSDT - keep an eye on itCRV one on the most bullish coins in every bullish wave.
Daily chart shows a consolidation of symmetrical triangle pattern.
It gives positive sign as it breaks 0.5 fib , 50ema ... But still need more confirmation for being bullish
Valid to buy now
Ur target is 2$ at least in case of breakout the symmetrical triangle pattern
Best regards Ceciliones 🎯

TradeCityPro | CRVUSDT Favorite Among Ethereum Whales👋 Welcome to TradeCityPro Channel!
Let’s analyze CRV, one of the older and more popular coins in the DeFi space, previously a staple in many crypto whales' wallets.
🌟 Bitcoin Overview
Before diving into CRV, let’s take a quick look at Bitcoin. It recently hit a new ATH but faced a heavy rejection on the 1-hour timeframe, triggering significant selling pressure in the market.
Remember, these kinds of candles are typical during bull runs. They may appear bearish on higher timeframes, but they often induce FOMO and panic selling, leading to potential buying opportunities.
📅 Weekly Timeframe Analysis
After losing its critical support at 0.4107, CRV dropped to 0.2219. Following a decrease in selling pressure, the coin consolidated for several weeks in a box range.
With renewed whale interest, significant buying volume pushed the price up by 350%, breaking the box and daily resistance. The rally was capped at 1.2060, where CRV has been trading below for the past two weeks.
If you entered the market after the box breakout, you should already have a reasonable profit. You can either take partial profits or withdraw your initial investment, holding the remaining position as "free tokens."
If you missed the rally, it’s currently not an ideal entry point due to the large stop loss required. Wait for either a time-based correction (range-bound movement) or a price correction to 0.8065, which serves as the next major support level.
🌞 Daily Timeframe
On the daily chart, CRV moved upward after breaking out of the 0.2219 – 0.3169 range and is now trading below the 1.251 resistance.
Support: 1.0522 (lower timeframe), 0.7985, and 0.6217 for potential price corrections.
Resistance: A break above 1.251 could lead to higher price targets, with the first at 1.9109.
breakout above 1.2510 may provide a momentum-based entry, but it’s riskier than the earlier entry at 0.3169. Wait for confirmation, such as volume increase and RSI movement, before entering.
⏰ 4-Hour Timeframe
On the 4-hour chart, CRV has tested the 1.2693 resistance twice. This level could act as a key trigger for future positions.
📈 Long Position Trigger
Open a long position after breaking 1.2693, with confirmation through increased volume and RSI entering the overbought zone. This is a weekly resistance, so a fake breakout is likely if volume is low.
📉 Short Position Trigger
No short positions are being considered for now, as they go against the current trend. Instead, focus on finding setups in other coins or monitoring CRV for better opportunities.
💡 BTC Pair Insight
Against Bitcoin, CRV has been in a prolonged downtrend but recently started to recover after breaking 0.00000528. However, the real bullish movement will begin only after breaking 0.00001223, forming higher lows, and continuing its upward trend.
Avoid FOMO. If you miss CRV, there are plenty of other opportunities in the market.
📝 Final Thoughts
Stay calm, trade wisely, and let's capture the market's best opportunities!
This analysis reflects our opinions and is not financial advice.
Share your thoughts in the comments, and don’t forget to share this analysis with your friends! ❤️


CRV deviation before major breakout ?CRV / USDT
Price broke down its historical major support to reach new all time low after bad news recently
At this point its either accumulation or distribution …I think more its accumulation… the buying here could be an opportunity but also has a potential risk for continuation of downtrend
However, if the price can reclaim the major support again it will become less risky with more confirmation for uptrend
Best of wishes

#CRV/USDT#CRV
The price is moving in a descending channel on the 12-hour frame and is sticking to it very well and is expected to break it upwards
We have a bounce from a major support area in green at 0.5250
We have an uptrend on the RSI indicator that was broken upwards which supports the rise
We have a trend to stabilize above the 100 moving average which supports the rise
Entry price 0.3000
First target 0.4000
Second target 0.5071
Third target 0.5071

CRV long term bagCRV is at all time lows. Even under the POC (POC level can be first target). Great oportunity to load the bag. Target 5x in few months. If you have any question or comment, please do. Thanks
MANAGE YOUR RISK
NOT A FINANCIAL ADVICE

CRV/USDT ENTERING NEW HIGH VOLUME TRENDThe last data shows that CRV/USDT has a good chance to create a new volume in the coming time frames, we will follow up to see if this coin is able to have confirmation in the coming time frames.
CRV/USDT has a history of breakdown trends, we will follow the coin to see if this is the reversal trend. The last data shows a high chance of volume building for this coin.

CRV UndervaluedCurve has over 2 billion dollars worth of stablecoins locked inside of its pools while the BINANCE:CRVUSDT marketcap is only 400 million dollars.

CRVUSDTPair : CRVUSDT ( CRV / Tether )
Description :
Consolidation Phase in Short Time Frame
Break of Structure
RSI - Divergence
Completed " 12345 " Impulsive Waves
Demand Zone

CRVUSDT 600% PotentialCRVUSDT Technical analysis update
CRV price is consolidating at its major support. We can expect a good bounce from the current level. In the current bull run, CRV could potentially move up by at least 600%.
Buy zone : Below $0.45
Stop loss : $0.30
Regards
hexa
