FET / USDTAs you can see in the 4H Time frame this is the pattern that we are in
Just wait for the confirmation to make it long or short
I do day trading based on patterns and breaks out SO just use my analysis for the short term, not long term or holding
The targets for both long and short are in the chart
THIS IS NOT FINANCIAL ADVICE IT'S JUST MY PERSONAL OPINION
DO NOT FORGET TO USE STOP LOSS
Cryoptocurrency

Sand/usdt trading idea and why you can hodl for long term$Sand Launched in 2011 by Pixowl,
The Sandbox is a blockchain-based virtual world allowing users to create, build, buy and sell digital assets in the form of a game. By combining the powers of decentralized autonomous organizations (DAO) and non-fungible tokens (NFTs), the Sandbox creates a decentralized platform for a thriving gaming community.
According to the official whitepaper, the Sandbox platform’s main mission is to introduce blockchain technology in mainstream gaming successfully.
Following The Trend : for years now the crypto ecosystem always follow some trend after a correction, (eg) Before 2019 was POws coins 2021 was meme and I believe 2022 would be the year for metaverse and NFts.
NFT and Metaverse being talk of the town now and sandbox is one of the front tire in the industry with years of experience.
I believe they have a lot in stock for 2022 considering the fact they raised 93 million In earlier 2021 with backing from companies Making it an area of interest.
Technically
Sand/Usdt has been on my watchlist from the time of all time high at $8.5, The chart is very interesting as you can see a strong break out from the falling wage bouncing off from the channel trendline with a flag pattern after the bulls charged.
Indeed Altseason is kicking
At the time of writing this article, Sand/usdt is trading at $3.3. which I believe with the strong team behind Sandbox we can see an all-time higher.
With this in mind, I believe it would be a great bet😃
Your encouragement is highly needed so I could continue researching on profitable ideas.
Like and upvote if you find this content interesting
Thanks and stay safe.

WHY You should not be Bullish #BitcoinWHY I BELIEVE ITS TOO EARLY TO BE BULLISH ON BITCOIN AND WHY YOU SHOULD TOO.
Since 26th December 2021 we can see that Bitcoin has been trapped in what I call the falling wage pattern which is between 52k higher high and 32k lower low.
According to babypis, falling wedge can either be a reversal or continuation signal.
As a reversal signal, it is formed at a bottom of a downtrend, indicating that an uptrend would come next.
As a continuation signal, it is formed during an uptrend, implying that the upward price action would resume.
The wage trend line has flagged off several times and now is the 2nd time for the bulls to retaliate by driving the bears to the resistance side.
Now price action trapped the market in the middle. the bulls currently drive the trend to resistance line making it the 3rd time the resistance line would be tested which if the bears charges back, we would see the market much lower at the support at 36k
I won't be surprised if that Happens as we can see the H4 RSI showing over bought.
Moreso Horizontally zooming out, you can see the red rectangular shape showing that 51k and 39k has been an area of interest between the bulls and bears since July 30th even before the last 68k bull run. (After the first broke out in 2021 we saw an all time high and currently it's below the resistance line and the question is would we see another dipper market?.)
💡 IDEA : Bitcoin is yet to close above the wage pattern trend line therefore I don't believe the Bitcoin bull run has commenced until H4 candle close above 46,700 and retest the the trend line while holding the bull motion.
Conclusion : if you believe that Bitcoin bull run has commenced, you can long it until another all time high is attained
But if you are a rational trader. You can wait until the trend line is broken, Then can ride from any side of the breakout.
How ever bear traders can open a position now at $42,940 and keep your sl at $43,670 which is 1.73% risk
Tp at $36,360 which is 15.27% Profit.
This is for educational purpose and not an investment advice.
If you find this content helpful you can follow and upvote
If you have a contrary opinion or another point of view I would be glad to hear it on the comment side.
Thanks

ETHETH must flip that top TL into support at $2,950 or the bearish abcde triangle analysis will play out. The compression is building so a break is coming coming. One way or the other. With DXY gaining strength I lean towards $2,000 being tested as a spring.


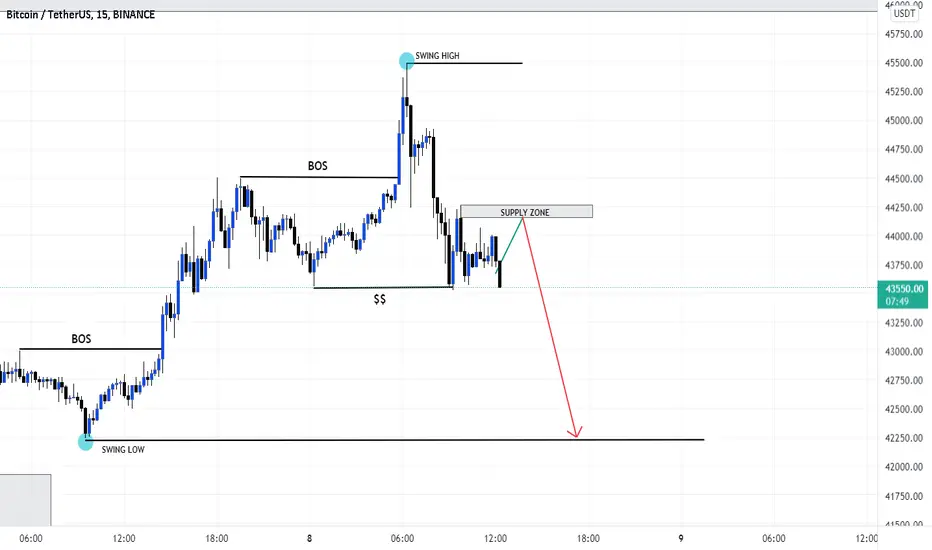
Solana short position ideaSolana is in the downtrend. After break of structure we are going to the POI zone and LQ. Once the price rich this zone we'll see reversal with high propability to go short.
But if the price sweep liquidity this trade hit SL but we can re-entre one more afret engulfing.

BTC will move upTrend line is our friend line
2,4 trend line break is the confirmation of reversal.
BTC managed to pass this line in both major and minor .
Asset class diversion can fuel BTC to start its 5 th wave rally soon.
targets indicated in fibanocci log scale

I LOVE FIBONACCI CIRCLES I love this analysis. It is created by drawing a trend line between two extreme points.
See how well it shows the support and resistance points.
Good examples of returning from support yesterday and today.
I'll be following the circles.
* Not an investment advice.

A Possible Bullish CypherIn the bullish cypher, the points A and C should make successively higher highs.
And point D must be above X.
If it gets to point D and calms down there i might try buying.
What do you think about this drawing?
*These are my personal opinions and not an investment advice.

BTCUSDT Down Trend.!#BTCUSDT Looking for Sell trade setup as I mentioned in the Chart.!
Keep Supporting LIKE, COMMENT And FOLLOW.!
Thank You.!
BTC LongsCOINBASE:BTCUSD
Lovely strong close on bitcoin on Friday, looking like on the pullback down we could be seeing BTCUSD come back to retest around 55K!

Understanding when to buy Ethereum using the S&P500 !!! Guys,
Many people are unaware of the correlation between the S&P500 and Ethereum's prices movements in the markets.
This trend has been strong since March 2020.
In this video, I will show you how you can use monthly volatility swings in the S&P500 as your buying opportunity for Ethereum as the percentage gains in Ethereum are 24 times greater than the S&P500.
Enjoy this video :)

BTC/USDTHello everyone, if you like the idea, do not forget to support with a like and follow.
13x 😉
OPEN : 36481
SHORT :
T1 : 33389 %110
T2 : 32708 %134
T3 : 32268 %150
LONG :
T2 : 39659 %113
T2 : 40341 %137

BULLISH PATTERN BREAK DOWN SHORT TERMBTC price action is ranging between 35500-34500 and making lower lows. As we can see it's forming bullish divergence but I am still bearish on BTC.

DASH USDT 4H : Under Support Zone, down to $120Hello my friends,
Let's talk about DASH.
Nice to meet everyone who is looking for These Ideas. I will be glad to hear your opinion about this.
Let's try one SHORT deal. Dash has been dropped under support zone $134 and it's clear that it will continue to fall down. Soon we will see it at $120, or even $115. After that it will bounce up again.
So let's open some short future position with 5X leverage.
Sell at $128
TP $124 35%
TP $120.1 35%
TP $116 30%
SL $132.2
This is an article, not financial advice, always do your own research.
If you have any questions, you can write it in comments' section below. I will be happy to discuss with you about your point of view about this topic.
And please don't forget to support this idea with your like and comment.
Thank you.

DeGRAM| BTCUSD level test 40534.80Support level 40534.80 keeps the coin from falling further, and while the price is in the range of 40534.80 - 43402.23, the probability of breaking this level down is growing every day. Therefore, we should expect a downward rollback to test this level.
-------------------
Share your opinion in the comments and support the idea with Like.
Thanks for your support!

BTC USD RESTRACEMENT BTC / USDT
BTC still has high chance to repeat similar movements like previous mid may to mid July
if that scenario played out correctly.. Price may retest 42k-38k region again in another minor bearish wave before any strong bullish rally
For this scenario to work the price shouldn’t close weekly below 38k or further correction will take place
Don’t forget to like this idea for more … thanks

THETAUSDT UPDATEQuick multi timeframe update on THETAUSDT potential intraday trade lining up for tomorrow, remember to wait for rules to be met before we can enter.


LRC just bouncing ATM waiting for GME newsLRC is just waiting so just keep dollar cost averaging ur way up to the news

VRA/USDT Uptrend signal 🚥🚦VRAUSDT is ready for the long awaited uptrend,
The area or zone where the White arrow was pointing at Was where the market finished it's next direction confirmation and it did print out a double bottom which signifies a strong uptrend between the period of Dec. 6Th - Dec. 15Th 2021 And the Short term bearish is almost over.
As regards to this, Buy order should be placed
@0.038581
Whilst the sl should be placed somewhere below The down zone.

ENSUSDTWe are getting ready for the next bullish leg after the second expanding triangle formation. Watch price action and enter the market.

BLOK/USDT BULLISH STRUCTURE Bullish Structure from monthly all the way down to daily time frame
Situation in Monthly time frame
We have an impulse and correction in monthly time frame. If you take the fibonacci from low to high we have a price action approaching the .618 fibonacci level. As we know the most tested level in fibonacci is the .618. We can definitely expect the price to respect the .618 before the continuation to the up-side.
Weekly
In weekly time frame we have the same situation that we have in Monthly.
Daily
In daily time frame If we take the fibonacci from low to high we can see that the price is respecting the .786 fibonacci level.
Also we have a M formation where we can definitely expect the completion to the Neckline.
Conclusion
In conclusion we can see that the structure in all the higher time frames is in confluence. In short term we can definitely expect the continuation to the upside at least to the neckline of the M formation. Also in long term we can expect a new higher high.
