BTC ContextNo clear setup right now.
Waiting for structure and confirmation.
Not every day is a trading day.
Right now, conditions don’t justify risk.
I’ll stay patient and wait for clarity.
Cryprocurrency

CHAINLINK – LONG - A WHISPER BEFORE THE BREAKOUTTraders,
I believe BINANCE:LINKUSDT is quietly setting up for another leg up. Let me walk you through the logic.
HTF structure - wedge breakout and retest
Price has broken out of a HTF falling wedge that has been guiding price action for weeks. A falling wedge is a compression pattern where:
Highs and lows are both trending lower
The upper trendline is steeper than the lower one
So sellers are still in control on the surface, but every push down is getting less effective. Once price breaks above the upper wedge line with an impulsive move, it usually means:
Most of the aggressive sell pressure inside the pattern has been absorbed
New buyers are willing to chase higher outside of that structure
That is exactly what I see on $LINKUSDT.
After the breakout, price rotated back down and is currently testing an imbalance zone around 13.75. This area:
Is the origin of the last impulsive leg up
Lines up with a clean Fib potential reversal zone on the LTF
So from a pure structure point of view this is a classic breakout → retest → potential continuation setup.
Order flow - hidden bull divergence and absorption
To see if the idea is backed by real flows, I zoomed into the CVDs and open interest.
On the pullback into 13.7 to 13.8:
Aggregated CVD Spot makes lower lows
Aggregated CVD Futures (stablecoin margined and coin margined) also print lower lows
While price holds a higher low compared to the previous swing
That is a hidden bullish divergence between price and CVD. In simple language: more market selling is hitting the books, but price refuses to break down. This usually means:
Sell pressure is being absorbed by passive buyers
Strong hands are using the dip to accumulate rather than distribute
Open interest supports that idea:
Stablecoin margined OI bled lower during the pullback, which suggests late longs getting flushed and some short covering
Coin margined OI is starting to curl up from the lows, which often signals new directional positioning right where CVD is making new lows and price is holding
That combination looks more like reloading than topping.
Targets and TPO weak highs
Now to the upside magnets. On the HTF and weekly TPO I am watching a series of weak highs that have not been properly tested:
1. 19.03 area - weekly TPO weak high
Formed with very little excess on the profile
Built mostly outside RTH, so it carries less conviction
These kinds of highs often get swept for liquidity before any real reversal happens
2. 20.20 area - second weekly TPO weak high
Similar story, clean horizontal high, thin rejection
Again, not much time spent there, so it looks more like an unfinished auction than a completed top
In my view, both of these levels are liquidity pools rather than solid resistance. If the current wedge breakout plays out, I expect price to at least probe and likely run these highs. From there, my HTF roadmap looks roughly like this:
Major Target 1: sweep the 19.0 weak high and push into the 20.0 to 20.2 block
Major Target 2: extension toward the 10 October liquidation event local high, which I have marked on the chart, and beyond that into the 22.7 to 23.6 region if momentum really kicks in
I also believe that altcoins as a group are eyeing that 10 October liquidation event local high. Many charts show similar untested spikes there, so a broad alt sweep of that zone would fit nicely with this BINANCE:LINKUSDT structure.
Invalidation
No setup is complete without an invalidation. For me the idea loses its edge if:
Price accepts back inside the broken wedge, not just a wick, but clear trade and structure back under the upper wedge line
Especially if that happens with CVD rolling over and OI expanding to the downside
If we get that, it would tell me that the breakout was a trap and that the current demand at 13.7 to 13.8 was not strong enough to hold.
Until that happens, as long as price is holding above the wedge and above the imbalance, I treat this as a constructive continuation setup with unfinished business at those weekly weak highs and the October local high.
As always, the market speaks softly before it moves loudly . Listen well, Nomads.
---------------------------------------------------------------------
If this helped, feel free to like, comment, or share your thoughts below.
---------------------------------------------------------------------
Abbreviation List
HTF – Higher Time Frame
LTF – Lower Time Frame
CVD – Cumulative Volume Delta
OI – Open Interest
TPO – Time Price Opportunity
PRZ – Potential Reversal Zone
RTH – Regular Trading Hours


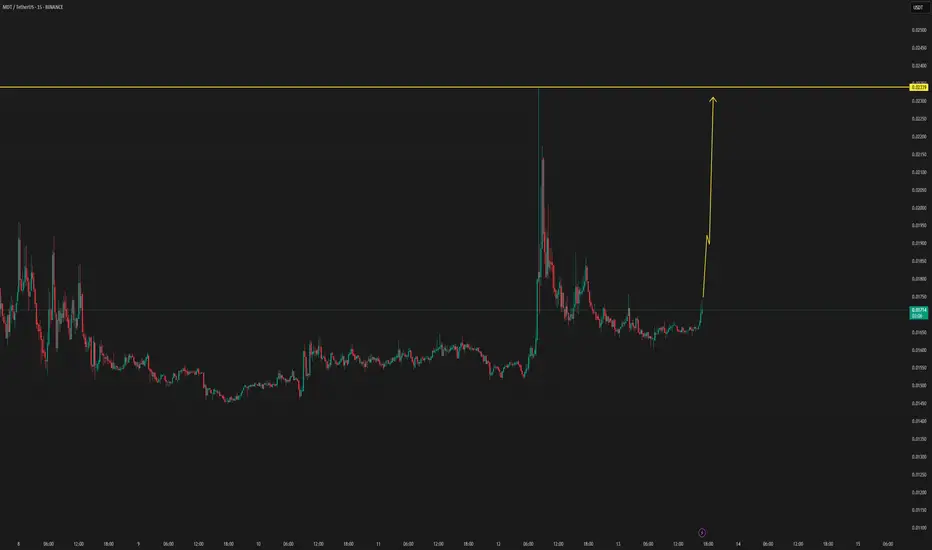
MDT NEW INCREASE VOLUMEMDT/USDT has new volume upcoming, which can be confirmed in the coming time frames. by new confirmations, the update will be followed below.
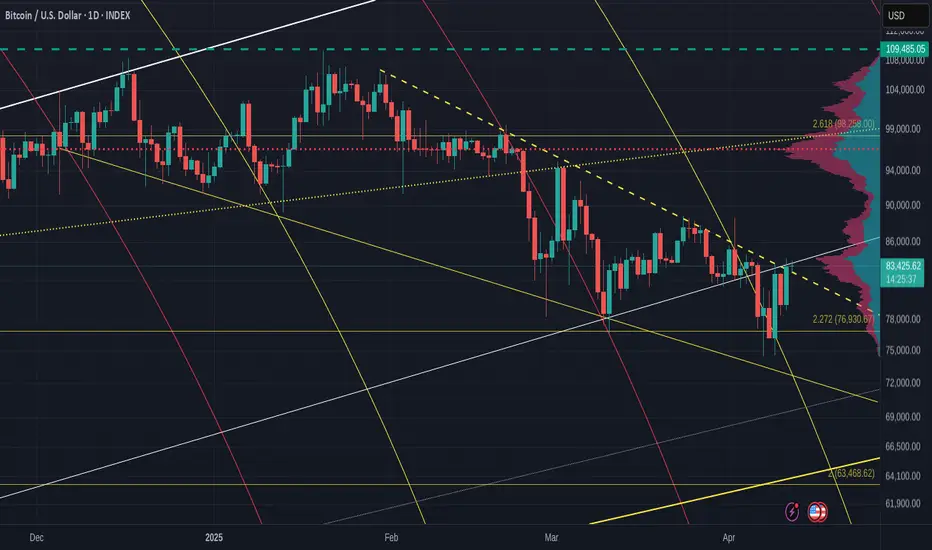
Bitcoin Daily, Something for the weekend Sir / Madame ?This will be the main chart and 3 indicators that could be telling us something.
Main chart is the Heiken Ashi. Each candle starts in the centre of the previous one and so we get rid of noise and get a good understanding of possible Trends.
And Right now, CALM is not the word ! Candles are getting smaller and smaller.
However, we do seem to be forming a bullish pennant with an Apex at the end of the month.
PA always reacts before the Apex.
Other things to note here is that we are now using the previous line of resistance as support. Look back to Dec 2024 to Feb 2025. It was this line that put as back down to 75K
We have tested this 4 times in a small way But not in a real Meaningful Way yet.
Do remain Cautious.......but that 2.518 Fib extension should hold us in place if we drop but there could be a much deeper drop.
But lets take this step by step as there are some Very Bullish signs to.
The ADX chart below shows us that Change is near.
Remember, ADX ( yellow ) NEVER shows trend direction, just trend strength. As you can see, it rarely drops much further below this point and does not spend to long here.
SO, current trend is Weak and a new trend is likely in the near future ( this could be tomorrow or in 3 weeks..near future is a wide window..but it is not 2 months or more)
The DI + ( orange ), positive Directional price Index, and the DI - ( red) , negative Directional price Index, are also low, showing no real price action.
This can happen for longer periods of time and it is impossible to say which will rise, However, as we can see, the price movements have not been huge and so to expect a sudden Massive Dive, as some are suggesting, is not really backed by anything.
But we should never say never. Be cautious
Accumulation / Distribution chart below
What is nice about this, is simply that Accumulation is still the MAJOR movement. The majority are still accumulating and so the idea that we maybe in a Bear market is almost Dismissed. People would not accumulate an asset that is about to Dive for a long eriod of time....Normally.
There has been distribution, as marked by the RED zones. This is heavier distribution and as you can see, this Stopped at the beginning of this month, having begun when we reached the high towards end of 2024.
So many thought that was cycle ATH
They have seen the error of their ways BUT, Again, remain Cautious till we see a bigger move higher.
And now my favorite, MACD
And for me, this is where we will see the decision being made. We are approaching the Neutral zone
Last time we bounced off this area was in October 2024 and we went from 70K to 109K
BUT remain cautious, we have every possibility that we may fall through the neutral zone for a while too....But we are in an area that could show us a time to move.
This is a LINEAR Bitcoin Daily chart
And those descending lines are FIB Circles and you can see how PA often runs along them.
You can also see how we are in a Pinch, a tight Squeeze right now ( arrow) with Horizontal line of support and the rejecting red 236 Fib circle.
That Apex is, again, at the end of the month.
So, to conclude, we are certainly heading towards a Move and possibly a new trend.
I like to think this will be Bullish but there are plenty f reasons for Caution.
I will remain with my Monthly charts that suggest June may be RED and that after than we will see more Green.
A Dip is possible and I have New Buy orders around 98K incase PA wicks down to them but there is NO guarantee this will happen...OR if it does, that it will stop there....
We just have to be prepared.
Stay safe

BITCOIN - We've done it, We Broke over resistance and tested
WE ARE FREE
The dashed line is that line of resistance we been stuck under since ATH
Last week, we broke away from the Fib circle that has also held us down recently and we Shot up to theline of resistance and we broke over it.
~The 4 hour shows us more detail
You can see how we have broken over previously and Lost the line as support.
This time, we seem to be holding and the 1 hour chart shows this in more detail
However, we should take note of the MACD, that on lower time frames is now falling bearish on 1 hour and about to on the 4 hour.
We are Almost vertainly going to come back down and test that dashed line as support again.
I expect a possible range of PA 79K -80K lowest and then hopefully a stronger bouce to take us over that line os resistance we are surrently under.
Time will tell.....BUT I FEEL GOOD ;-)
The Great Exit Liquidity Trap: Double Top + Low Volume DumpTL;DR:
This isn't just any dump—this is a textbook exit liquidity trap dressed up with a strategic crypto reserve announcement and a conveniently timed crypto summit sell-the-news event. The setup? An inevitable double top, weaker and weaker volume, and a sell-news-event trapping retail.
Breakdown:
1️⃣ The Double Top Trap → Price fakes a breakout, luring in breakout traders while whales were already offloading bags onto retail.
2️⃣ The "Strategic Crypto Reserve" Announcement → Big words, vague details, and just enough hopium to keep liquidity in the market. But let’s be real—this was just fuel for smart money to distribute.
3️⃣ Low Volume Exit Scam → Volume failed to confirm the pump, and the second peak barely had any buying pressure. That’s your first clue—when volume dies, so does the trend.
4️⃣ Crypto Summit = Sell-the-News Event → Market makers front-ran retail, using the summit hype to sell at a premium before nuking price.
Target Zone:
$80K-$79K is where liquidity pools sit, making it the next logical stop.
If liquidity sweeps don’t trigger new buyers, sub $78K isn’t off the table.
Additional Confluence :
S1 Pivot Rejection → A failed reclaim of key levels.
EMA Pressure → Bearish rejection off moving averages.
Weak Low on the Chart → A magnet for liquidity.
Final Take:
Retail is the exit liquidity in this setup, as always. The market will pump just enough to distribute before dumping into the real target zone. If you aren’t paying attention, you will get played.
The question is: who will be left holding cheaper bags?

TOKEN/USDT NEW BREAK POSSIBILITY TOKEN/USDT NEW BREAK POSSIBILITY
We will follow this coin for the break possibility.

Pi Nework Is going to the mainet publishing. The creator of Pi Coin/ Pi Network has establish the coding system for more than 5 years now, without publishing the token system in the mainet system so far. And today more than 60 Million whole world has been using this Pi network system in their barter sell and buy. The Pi network community has agree the value 1pi is worth USD 314,159 yet not in the mainet system.
Lots of the Pi network pioneer are waiting for the mainet lunching date is 1 January 2025. Here I try my best to predict the Pi Coin after the mainet date.
Thanks.

SOL - a week in the Sun ? or is Rain on the way SOL is starting off the week 20% lower, we've had a price retraction and profits have been taken, liquidity has been swallowed up, the weekend is over and its time for the market to resume "Marketing" .
Sol is already breaking out and we will have to watch , but we area long as of Sunday at 141-143
We were looking for our target of the 150 level to take profit, and as the week continues I plan to trade SOL daily with some positions So I will be watching It and trying to keep the Days action organized.

YOU NEED ONLY THIS SETUP TO MAKE MONEY..Check out my previous public ideas and see hot it works and how you can start making money.
Thanks for feedback! Let's get it!


THE GOLDEN RETURN OF SHIBADepending on the low time frame the first activation for SHIB/USDT
We expect that there is a good chance of an increase in volume.
in the coming time, we will follow SHIBAUSDT
The top NO 1 USDT whale holds the most SHIBA.
90% of the unexpected volume is around 30%, there is a good chance it can do with time 60% and up.
Shiba is a value coin that is doing an unexpected increase over time.

Long GCAKE/usdt SPOTlow risk high reward. manage risk correclty do ur own research
currently at support.

DXY DXY Weekly TF Forming Head and Shoulder Pattern It's Bearish pattern
DXY Dump then all others Market will pump increase

BTCUSDT U See a triangle pattern that say to us that we are accumulate to have force for good move out
my idea for BTC is going upper than this

BITCOIN ANALYSIS I'm still bullish #bitcoin but I'm not as certain as I was before! The 2 green highlighted levels are still holding up. I'm my view, either bank's & institutions are filling orders before the next leg up which will be a new all time high again! However, if this is a battle between buyers & sellers, I'm not too confident these levels will hold. If they don't, expect it to fall to the highlighted demand zone/support level below @ GETTEX:52K level/zone!

⚡ PBX (Trust Wallet Token) Trade Setup ⚡📊 Analysis:
Support Level: PBX has reached a support level, presenting an opportunity for a long trade.
Risk Warning: It's essential to note that PBX is a low-cap coin, making the trade highly risky.
Trade Percentage: Due to the high risk, consider using only a small percentage of your capital for this trade.
Buy Zone: Plan to ladder into a spot long trade between $0.00165 - $0.00174.
Take Profit: Consider taking profits at the next areas of resistance around $0.002 - $0.0021 or $0.002325 - $0.0024.
Stop Loss: Set the stop loss just under $0.0016 to manage potential losses.
🌐 Note: Exercise caution when trading low-cap coins, and be aware of the associated risks.

Bitcoin impulse waveWhy it is so hard to believe that Bitcoin next upward phase has started. The bearish advocators don't want to, those who have missed the 15K bottom don't want to, and many others too don't want to believe; I myself wanted Bitcoin to have another downtrend wave. It is most likely a mental trap. Anyway, Bitcoin (market) don't care how we feel, it proceeds as it should be.
If you have followed my analysis on Bitcoin correction, link below, updates were posted regularly. I will do the same for this idea post and update Bitcoin impulse waves analysis as they unfold.
Currently, it seems Bitcoin is in the 3rd impulse wave. Have to wait and see where this wave finishes.

AVAX trying to break the resistance ! BINANCE:AVAXUSDT trying to break the weekly resistance. After a successful breakout, it will easily pump to 20.
note: Do your own analysis before investing

WAVES Daily In Daily TF WAVES has broken resistance with high volume
Last days the retest was made and not there is no resistance for bulls
Send it!

#XRP Long The slope of the upward movement in wave 3 in one-hour time is inside a contraction triangle, which can be the end of the wave in the range of 56 cents. The loss limit is 43 cents.

Dont be rush in Market !In my opinion, the market is trying to exit from long-term correction. Even though it has to go through a difficult path. Therefore it is soon to decide correction is over!
At the first step, it should pass the 26-28k resistance zone. secondly, it should remain on the top of the monthly RSI trend that I will show you in the analysis picture below and also break the weekly bearish trend line. However, it has broken the daily bearish trend line.
In short-term analysis, it has created a falling wedge (reversal) so it is expected to witness an increase of about 27-26k . But before that consider the bearish divergence in the daily chart. As a result, we can be patient in buying our coin when BTC is correcting until around the 21-20k zone and set your stop loss below the SL line
Good luck and be profitable ❤️
