Bitcoin FuturesSubscribe and get a free trading strategy for Bitcoin and other instruments every day!
Hello, my friends!
I wanna show you price GAPs today.
As you know it usually should be closed by the price.
There are no such GAPs on the usual chart but you can see them on BTC Futures chart by CME
P.S
I do not adhere to a time frame in my analysis of the instrument, a reaction in the instrument may occur earlier or later. It is important to understand the price movement when reacting to the level, as well as the buyer and seller reactions. Well, and a few more secrets, this material is not a trading recommendation )))
Crypto-analysis

ETH - What nobody sees
Ethereum currently attempting at breaking its long term bear market resistance.
No FOMO yet, we need to wait the daily close to be sure.
Another bullish indicator is the RSI who broke its triangle contraction cone to the upside. It should reach the upper value of the triangle which is 70.
Next key level is at 1350$ for ETH.
Here is a MTF view which indicates the breakout and that price is looking to make support.

Bitcoin Scalping Signal for Day Trading🖥️ We have determined there is a 70% chance Bitcoin will RISE from our current entry point.
📉 LONG - BTC : $16,855 📉
💵 Length of trade: we are expecting BTC to hit a $200 scalp, with a high end of $300 - minimum expectation $125.
🕰️ Duration of trade: we are expecting BTC to try and retouch today's top, and then possibly continue its way up still till Friday.
📊🖥️ INDICATOR SHOWN ON CHART : Scot Signal Indicator

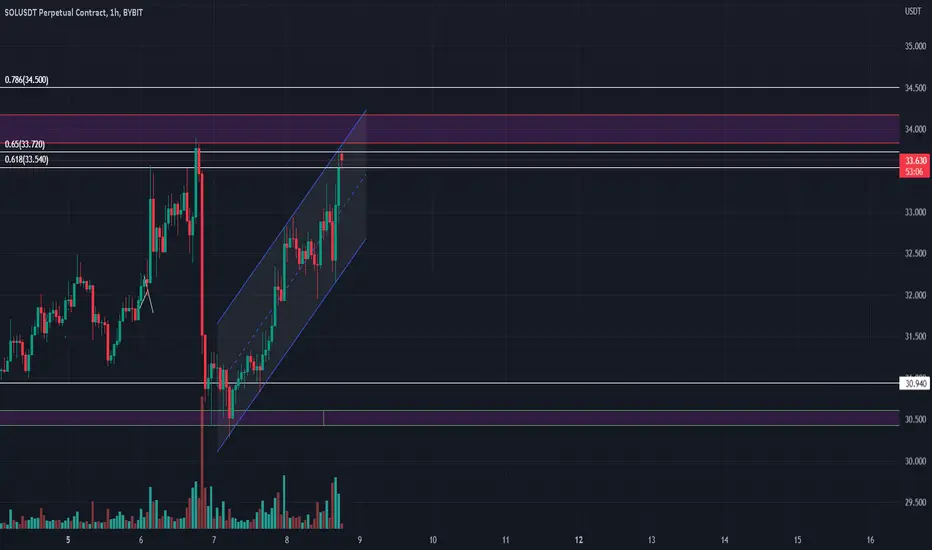
SOLUSDTSubscribe and get a free trading strategy for Bitcoin and other instruments every day!
Happy New Year and Merry Christmas my dear friends!🤑
Take a look at the chart, please! Solana is approaching the supply/demand zone, where we possibly will see a reaction. Maybe earlier because the RSI indicator is overbought already.
But if we will see the price break that zone without any reaction, then the next target is $15.00.
Be careful and smarter than you were yesterday!🧐
P.S
I do not adhere to a time frame in my analysis of the instrument, a reaction in the instrument may occur earlier or later. It is important to understand the price movement when reacting to the level, as well as the buyer and seller reactions. Well, and a few more secrets, this material is not a trading recommendation )))

Bitcoin Scalp Signal for Day Trading🖥️ We have determined there is a 60% chance Bitcoin will RISE from our current entry point.
📉 LONG - BTC : $16,965 📉
💵 Length of trade: we are expecting BTC to hit a 200 scalp, with a high end of $350 - minimum expectation $200.
🕰️ Duration of trade: we are expecting this to occur within 5 hours of this signal for the Min. Profit Target. Then we see this trade playing out till U.S. markets open Wednesday.
📊🖥️ INDICATOR SHOWN ON CHART : Scot Signal Indicator

BTC Next Halving ?Hello everyone, today I would like to share an idea about bitcoin next halving.
Can we predict the next halving of bitcoin with the help of previous cycles?
A bitcoin halving is scheduled to take place every 210,000 blocks. Three bitcoin halvings have already taken place, one in 2012, 2016, and the last halving in 2020.
The bitcoin halving prediction shown above is for the next halving set to occur in 2024.
The next bitcoin halving is scheduled to take place at block 840,000 which is predicted to be on Jun 30, 2024.
At the bitcoin halving 2024, the bitcoin block reward is scheduled to drop from 6.25 bitcoin per block to 3.125 bitcoin per block.
From a technical analysis point of view we could roughly estimate the next halving in August 2024. It is still a bit early to have a precise estimate, at the time of writing this idea we are on November 27, 2022, date at which the market has not yet reached its lowest point.
We can see from past data that over the last twelve years August has been more often in the negative than in the positive. In the ten months preceding it, especially April 2024 and May 2024 could be conducive to a potential halving of 2024.
The financial markets are cyclical, so there is a good chance that bitcoin will go up at some point, but since it is highly correlated to the S&P500 it could be in 1 month or 10 years.
To guarantee that bitcoin could exceed its high would be completely absurd, given the short history we have of bitcoin, the very notion of halving is to be taken with a pinch of salt. Indeed it has only happened three times. The market is very young (less than 20 years) so it is very complicated to predict these cycles.
In my opinion, in order to predict the next halving (and although according to me this notion of halving should be taken with a pinch of salt), we should wait to see where our next low will be. Depending on this, we could then observe whether the macroeconomic environment is evolving in a direction favourable to a next bull run. If the low point seems logical (around $12,000), that the environment is favourable to a new bull run and finally that a range break occurs from above $34,000 then it could seem interesting to invest in BTC to aim for $65,000 or even why not a new ATH.
I would like to remind you that crypto-currencies are very risky and highly volatile investments. Therefore, for the majority of investors, they should represent less than 5% of their capital.
THIS IS NOT INVESTMENT ADVICE.
Written by @maxencechachuat on 27 November 2022.

Ethereum MTF TAHello, here is a multi time frame technical analysis chart for Ethereum.
We are at the very end of a descending wedge (some people will also see a triangle) on the higher time frames.
Price is testing 5-month support area at 1050$ and could be printing a double bottom on the daily chart.
We are starting to see some bullish signs on lower time frames but nothing serious yet. I'd be patient right now.
I like to compare ETH to BTC, and we can see that ETH has been performing better than BTC (or at least, not as worse), however we fail to make new highs so the day ETH overtakes BTC isn't coming yet.

BTC NEXT EXPECTED MOVES Hello everyone ..
first of all, this is not a financial advice
it's just a view how i see the market depending on few studies that we have been passed through specially in bitcoin
Fundamentally:
BREAKING: The FTX hacker is selling thousands of ETH and buying wrapped #Bitcoin
Technically:
as we spoke before that we already spotted a symmetrical triangle.
Bitcoin started a fresh decline from the $17,000 and $16,800 resistance levels.
The price is trading below $16,350 area which is the resistance now for the broken symmetrical triangle and a great support line.
There is a key bearish trend line forming with resistance near $16,350 on the 4-hours chart of the BTC/USD pair
The pair could resume its decline below the $15,500 support zone in the near term and might reach the target for the triangle at 1.618 fib levels @ 13800-14000$ areas
The pair also could retest the broken support again in near future @ 15800-16,000 ish areas and decline later to hit the bear flag targets which i expect to 10500-11800 ish areas, and why i expect that >> due to market history specially while people calling the bottom .
Good luck everyone and be careful how to trade it .
and most important thing don't be greedy and fomo about the bottom is there, don't worry you will get your chance when its time ..

Impulse level breakdown. Gathering of liquidityA strong local resistance level has formed on the instrument, behind which there are many stops of participants, as well as the formation has the form of an ascending triangle, which indicates the interest of buyers.
I will wait for the formation of consolidation and impulse breakdown of several percent with volumes in the tape.

Solana solana broke the structure of the downtrend 'on the demand zone' if btc go up solona will go higher wait for btc breaking last resistance then enter your long positions

$SOL #SOLANA next chart movement As previous predicted with 100% Successfully - this is basically update.

Bitcoin exhausting FLATSubscribe and get free trading strategy for Bitcoin and Etherium every day!
Good afternoon, today is a closed unscheduled Fed meeting, it means something is not going according to plan, EUR also in relation to the dollar is falling faster and stronger than my assumptions, the whole picture of geopolitics background, looks even more restrained. Bitcoin has not yet become inflation-proof so let's keep an eye on the spx500 and the dollar index. Bitcoin is stuck in a low volatility environment, so I expect an exit to stronger levels, for now you can try to work in the narrow 18900-19250 range, but very carefully, as today might be a very volatile day that you can sit out in the cache.
Long
I think the long scenario is risky here, at least a hold above 19400 will give us a chance to slide to 19780.
Short
Trading bitcoin below 19050 would take us to 18500, with an intermediate target of 19670.
Take care of your deposits, good luck)))
P.S
In the analysis of the instrument I do not adhere to the time frame, the reaction in the instrument may occur earlier or later. It is important to understand the price movement when reacting to the level, as well as the reaction of the buyer and seller. Well and a few more secrets, this material is not a trading recommendation )))
Translated with www.DeepL.com (free version)

BTC (Current Update)$BTC (Current Update)
Bitcoin Is Trading In A Loop Of Support & Resistance ($18300 - $19800)📊....
There's A Chance Of Testing The Support Level Again (Triple Bottom),
Then Again The Resistance....
Any Time BreakOut📈 Or BreakDown📉 Can Happen....
It Will Change The Whole Secenerios....
Stay Alert For More Upcoming Updates....

Bitcoin Scalp Signal for Day Trading🖥️ We have determined there is a 60% chance Bitcoin will Rise from our current entry point.
📉 LONG - BTC : $18,990📉
💵 Length of trade: we are expecting BTC to hit a $300 scalp, with a high end of $600, and a minimum expectation of $225.
🕰️ Duration of trade: we are expecting the Min. Profit Target to occur within 4.5 hours of this signal. Then we see a maximum duration of 12 hours .
🏛️ Be Mindful The Federal Reserve will announce its rate hike decision at 2pm EST. This is almost certainly going to cause big swings, both Up & Down. If they announce </= .75 BTC will likely have a bullish outcome. A 1.0% hike or great will send BTC to probably below 17k.

Is Bitcoin holding up? Waiting for U.S. unemployment data at 3:30 p.m.!
Subscribe and get a free trading strategy for Bitcoin and Etherium every day!
Good afternoon, yesterday bitcoin failed to break through the 20500 level and started a local downward flat to the 19500 extra zone from where the buyer reaction came immediately. Ether's move to PoS was successful. We are waiting for the unemployment data, which could have a negative impact on the world's major indices and bitcoin.
In simple words, if the number of jobless claims decreases, it means a lot of workers, it means more paychecks, people will spend more, inflation will increase and this will negatively affect the Fed's rate increase, and the rate increase, in turn, will negatively affect the Bitcoin rate. And so let's look at the LONG/SHORT scenarios
LONG
To continue the local upward movement on Bitcoin, we need to follow the SPX500 index and the unemployment data today at 15:30, to go to the zone of 24,000, you must first consolidate above the level of 20,500 dollars (local resistance), and so impulsively pass the zone of 21,200 dollars and consolidate above it.
Short
The short scenario for bitcoin will be consolidation and trading below the level of 19500, then to me, it will look like a Short on the break.
P.S.
I don't stick to time frames in my analysis of the instrument, a reaction in the instrument can happen earlier or later. It is important to understand the price movement when reacting to the level as well as the buyer and seller reactions. Well, a couple more secrets, but you already have the material ready)))

Bitcoin for the "W"Whats Up guys?
I Posted an $ETH analysis a few days ago showing you why the charts are telling us that another move to $2000+ is in the cards, before the reality of a recession hits, and new lows under 1k are put in
I posted it below if you want to check it out.
Though its in a different Pattern than $ETH, I will show you why Bitcoin is also screaming that another pump is around the corner.
During the crypto rally in July/August, Bitcoin made a choppy move up Vs. Eth's more "straight up" impulsive move.
After a few weeks of downside, Bitcoin is once again sitting on that July Bottom.
If you look closely, Almost every bottom pattern in financial markets resemble (variation on the theme) one of two Patterns.
1. Inverse Head and shoulders.
2. "W" Pattern.
I believe we're looking at an almost complete W pattern on the 4H and Daily Time frames, in which the next move up would complete the second "leg" of the W.
Seeing what you believe is A strong corrective pattern on the higher time frames is one thing, but I personally don't have conviction in a trade unless there is also confluence on the lower time frames as well.
Well, Bitcoin is showing us exactly that.
Since August 28th, Bitcoin has presented choppy behavior (also a strong sign of a potential bottom) while holding a 6 day low. Again, on top of the strong bottom structure (support) from July.
On top of that, we re even seeing it chop down over the last 48 hours into those 6 day lows, for even more confluence.
Its hard to call how high or low a particular move will go, but I think $25,000 is a conservative target for this next leg up.
A few daily closes below $17,000 would invalidate the pattern and therefore the trade for me
In conclusion, BTC is showing us that the downside in august was just a correction in a bear market rally, and that one more move up to $25,000 is likely before a final collapse.
Ultimately, I think this bear market lasts well into next year. But there will always be Bear market Rallies.
Cheers!

Bitcoin Day Trading Setups, Scalping Entries🖥️ We have determined there is a --% chance Bitcoin will Rise (please read prior idea for uncertainty on today's trades ) from our current entry point.
📈 LONG BTC - Entry Price : $21,350📉
💵 Length of trade: we are expecting BTC to hit a $200 scalp, with a high end of $--- (Refer to "idea" BTC Important Levels + Fed "idea" for targets) and a minimum expectation of $---.
🕰️ Duration of trade: Our indicator gave a 70% chance for BTC to rise. Though with the Jackson Hole speech coming at 10am EST, fundamentals and timing are not normal today.

Bitcoin , Important LevelsA Breakdown of Important Levels for Bitcoin.
Moving Average, Fibonacci, and Exponential Moving Average Levels

Bitcoin Day Trade Setups, Scalping EntriesBitcoin Scalp Entry, with a Swing Trade Option for a bigger time-line
🖥️ We have determined there is a 70% chance Bitcoin will rise from our current entry point, for a scalp. 60% the Swing Option
📈 LONG BTC - Entry Price : $23,450 📉
💵 Length of trade: we are expecting BTC to hit a $400 scalp, with a high end of $600 and a minimum expectation of $250.
- ⤴️ With a possible Swing Trade forming with a high end profit of $1000
🕰️ Duration of trade: we are expecting this to no occur within 5 hours of this signal, with a maximum duration of 10.5 hours .
- ⤴️ With a possible Swing Trade duration of 27 hours.
🏛️🗞️ With the U.S. Federal Reserve news coming out today, it created a dip in the market.
Generally this year BTC has dropped, then rose above its initial fall point after Fed news was announced. That is why we are still holding our Long from yesterday while Entering a second position.

Crypto Market Update BTCUSDTMARKET ANALYSIS:
Market Cap.: $1,035,399,793,513
24h Volume: $86,171,585,363
BTC Dominance: 39.8%
ETH Dominance: 20.1%
🔸BK® Health Standard: 3.81 (1 to 10)
🔸BK® Sentiment: -31.28% (-100% to 100%)
➖➖➖➖➖➖➖
BINANCE ANALYSIS (BTC pairs):
Top Gainers
1. STG: +105%
2. SANTOS: +21%
3. RAD: +17%
Top Losers
1. QLC: -12%
2. YFII: -11%
3. GTC: -11%
BINANCE FUTURES:
Top Gainers
1. TRBUSDT: +5.57%
2. KNCUSDT: +4.14%
Top Losers
1. GTCUSDT: -18,73%
2. FILUSDT: -18.10%
LARGEST VOLUME (24h)
1. ETH/BTC (10,277 BTC)
2. ETC/BTC (1,110 BTC)
DAILY OUTLOOK
Both BTC and ETH market dominance have dropped slightly, with the latest high volume drop in price action for most alts in the market. BTC and ETH have reached new higher time frame lows, and could be about to head lower if we don’t see bullish volume starting to kick in.

$BTC analysis - Time to buy | heading to big resistanceBTC have big resistance at $28800. as you can see on weekly chart ,we have witnessed huge volume on upper side after so much time. last week sellers failed to force down the price of Bitcoin. which can make bulls more strong.
Even in shorter time frames like 1D or 12 hour its showing good sign of huge rally toward 28k.
My advice to you will be you can long it till 28k with small SL at 22500 or anything which u think right.

Avalanche - AVAX/USD Chart Analysis - Elliot Wave and Price ActiPrediction:
Buy AVAX/USD @ 27
Target 1 - 70
Target 2 - 140
Stop Loss - 19
