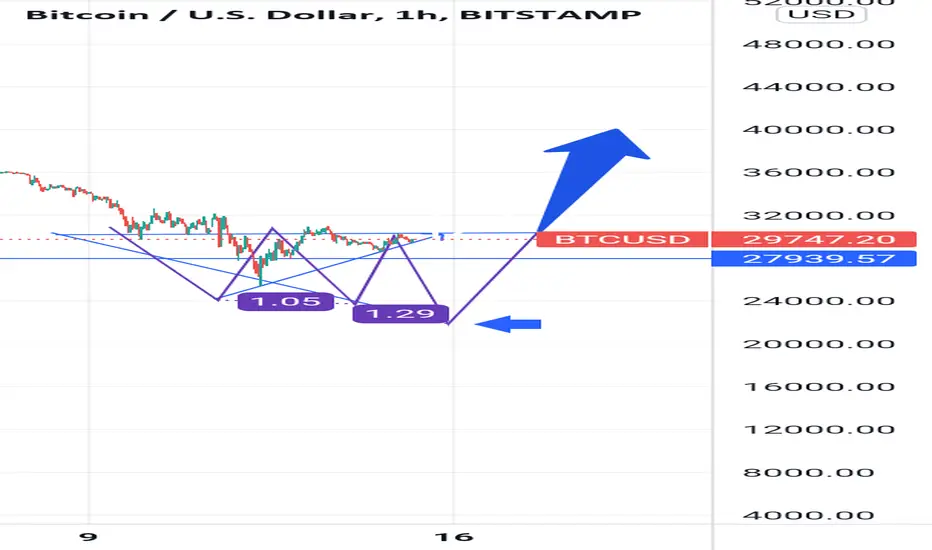
WE ARE GONNA PUMP BTC SOON :)Bitcoin is ready for a nice pump imo :)
My target is 34k this week, let's see what happen.
It could drop if stock market dumps hard!
Crypto-analysis

Cosmos a.k.a. ATOM - 1 Month Ahead Trading Idea - 21 May 2022COINBASE:ATOMUSD in the past 50 days made a big decline of over 75% and its a good moment for accumulation in the short-medium term time frame. Good news coming out for the ATOM ecosystem and a potential upside of 100% is very likely to happen even in 1 month period.
What is the supported thesis technically for the expected scenario on ATOM?
- There are big liquidation holes to be filled upside and the first strong resistance is at $22.00 per coin
- The MACD indicator hits low points and soon will start its explosive on the upside
- Wedge concentrate price action and soon will break out with huge price action
- Breaking of downside dynamic trendline should be a reality in the beginning of June
If you have any questions related to this trading idea I will be happy to provide you with answers.

BTC, In-way to $21800 then 2X if select bottomAccording To Three Drive rules ><
The Next Support for Btc is 21800<>
If touched Maybe We See 2X Here upto $40000
BITCOIN - WE ARE NOT DONE YET, BYT FUTURE LOOKS BRIGHTI ont think we are done yet. There was no real capitulation and general volume is low. Despite this I think we will bottom till end of may and aftr few months of accummulation we will have final leg up till the beginning of the nxt year.

What's Next For Bitcoin ¿? UNDERVALUEDBTC undervalued for sure, we are in a good levels for accumulate right now... Important support at $30k for bitcoin.
We will recover soon? mmmm... I dont think so if SP500 & Stock Market keep dropping!!
In my opinion we could see 24-26k soon if we don't PUMP hard and price cannot be above 30k.
Anyway, BUY AND HODL $BTC FOREVER. WE DONT SELL HERE, JUST BUY MORE!

BITCOIN - NET OF 5 YEAR PARALLEL CHANNELSThat 5 year net of parallel channels shows us how many touch ponts with the lines we had, every single top and bottom included. So something to watch. If we fall - 24/26 k is a floor lower level, if up.. depends on timing but moon generaly.

BITCOIN - TWO CHANNELS AND ONE TRIANGLE ;))Bullish triangle in downward channel and big upward channel in creation. Let's see how these three will develop! :)


ETH - FUTURE LOOKS BRIGHT, WILL WE REPEAT THAT PATTERN? ETH is repeating scheme from accumulation channel we had in 2020, now, after 15 months it's 100% same. Will see if reaccumulation will end the same.

The analysis of the behavior of major player Part 4We begin our 4th part of the demonstration and disclosure of this method of analysis with the current BTS example.
Now we can see how all our previous forecasts for the current situation came true exactly before all the current reversals.😉
A very good example of working with the analysis of the behavior of a major player is right in front of you, guys.
Look, we fixed the breakdown of stops, which in turn are signals to buy and calmly went for a correction, before the start of a massive pump.
Thanks

$UNI UPUNI might just take a BULLISH TURN. Although, reconfirmation may be required but i see Bull movement for the week.
It just my thoughts

Bitcoin analysis In my opinion bitcoin will go to 42 area then will go up to 44 area then down again
Watch with me and comment if you agree or disagree with reason
Thanks

WHAT IF REACCUMULATION JUST GETTING STARTED?Just an idea of how reaccumulation ca develop, eight more months of that range would be killing for both sides, bears and bulls.

Trading Idea - #BitcoinGeneral sentiment is right for Bitcoin!
BUT!
The price of Bitcoin is currently struggling at the upper edge of an ascending triangle formation. A clear breakout seems to have failed. The logical consequence for me would be a return to the inner of this triangle.
A beautiful course from a chart-technical perspective, would be a return to the upward support line of the triangle. From there it can go up again to attack the 50,000 USD level!
I entered at 46,300 on SHORT with a target at 41,200 USD. My stop is at 48,000 USD!
*not an investment recommendation

AAVEUSDT Correction ?AAVE was a successful trade that I personally took .
By looking at the chart and the FIB level it touched , I will be expecting a retracement or a small correction in order for it continue going up . Just keep in mind , that in case AAVE decouples from the general crypto market like it had done in the past , it could just keep going up .
In my opinion , I am in favor of having a retracement before going further up around $188 or even $175 which was the downtrend breakout .
In addition , is also important to note that a violent breakout of BTC to the upside or a retracement could just move AAVE and other ALTS violently up or down , at this point I believe everyone needs to be cautious .
By saying this personally I would be waiting for AAVE to break this level and test it as support before re entering a position or waiting for the retracement and longing or buying spot at the local bottom after the correction .

Analysis of Ethereumit is simple enough for a person to understand and I'm just going to write down random crap in here in the description to actually make it publish


POSSIBLE LONG POSITIONEntry @ orange line + orange flag
Target $44500 take profit
Stop Loss $40100
Bullish short term
Using Pionex grid bot - fully automated and ability to leverage up to 5x
The reason I took this trade is because Bitcoin has bounced off the rising lower support level on smaller timeframe (white dotted line ascending) which means we are close to a pivot point. I expect at least 1 price action fakeout either to the upside or downside. This time I am guessing that BTC will increase to $41500 and flip as support, and then rise to $45 before the Big Short to $30k.


OMG if this pattern repeats….I will be super grateful BITCOIN Here we can see the pattern of previous lower sequence as it repeats IDENTICALLY in form. I am ready to short in about. 1-2 hours….Bitcoin will shoot up one last time and then DUMP…..be READY.

BUYING DIPS AND EATING CHIPS (Btc-Usdt)Last night….saw some uptrend but held my bearish position since $39,967 previously…….thought they had us in the first half not gonna lie. Now I will continue to push for lower threshold, unless people wake up on Monday’s and decide to buy but let’s see how stocks perform. Historically the week starts off bearish for stocks and ends the week bullish. But the world is unpredictable as ever nowadays. Buy those dips and Eat those Chips! (Using Pionex trading bots) currently up +22%

ETH - One More Roadblock!Hello TradingView Family / Fellow Traders. This is Richard, as known as theSignalyst.
As per my last analysis (attached below), we were waiting for the bulls to take over, by first rejecting the support then breaking above the upper gray trendline.
However, the bulls were too strong and broke the gray trendline before forming the third swing around it as per my trading plan.
UPDATE: ETH is now forming a potential big inverse head and shoulders pattern, marked by orange arcs.
For the bulls to take full control, we need a momentum candle close above the gray neckline which covers the entire pattern/structure.
Meanwhile, until the bulls take full control , the bears can still kick in to form an over-extended right shoulder.
Which scenario do you think is more likely to happen? and Why?
Always follow your trading plan regarding entry, risk management, and trade management.
Good Luck
All Strategies Are Good; If Managed Properly!
~Rich

MARKET CAP USDT DOMINANCE /1D as you can see If support is maintained, we expect growth rather than resistance 4.42%
#usdt #dominance #marketcapusdtdominance #usdtdominance #marketcap #cryptocurrency #crypto #trade #trading #technicalanalysis #analysis
