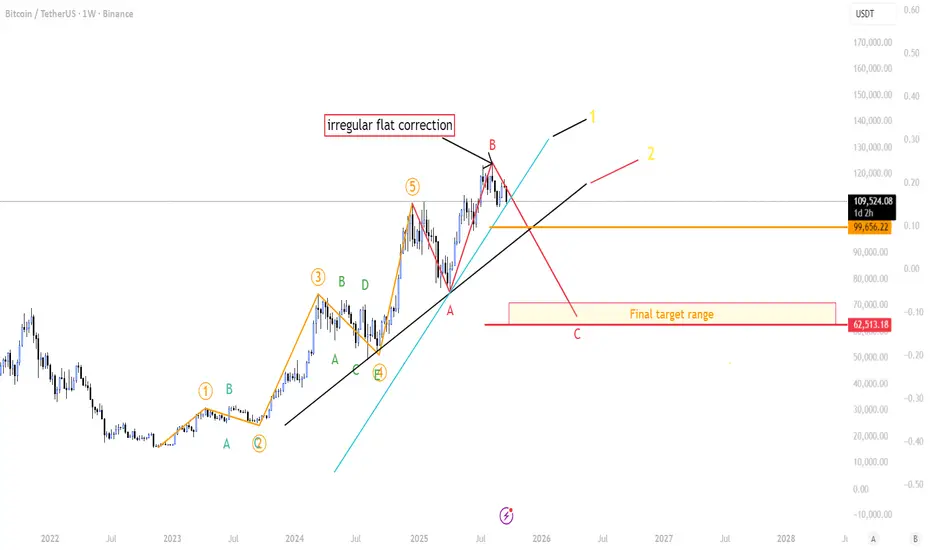
BTC at a Crossroad: Path to 62.5k Is Conditional-Pick Your PlayI’m sharing a possible irregular flat correction that could pull BTC toward ~62,513—only if two key trend supports break.
Note: This Elliott count differs from my main count. It’s my secondary scenario—lower conviction, but it deserves close attention because the structure is developing cleanly. This does not mean BTC is going down (it's just a watch out scenario)
The story so far
From the Nov 22, 2022 low, BTC ran a full 5-wave impulse.
Wave 3 was the extended one.
Wave 4 formed a triangle.
Wave 5 ran hotter than expected (roughly the size of Wave 3). That’s unusual, likely fueled by extreme Bollinger Band Width compression before the final push.
Why this matters: when Wave 3 extends, Wave 5 is usually shorter. It isn’t a hard rule—just a guideline—so this count stays on the board, but it’s not a high-conviction setup.
What I think is happening now
The drop and bounce look like an expanded (irregular) flat: (A) down, (B) up which was our All time high, C down.
If the pattern completes, C could target ~62,513.
Quick pattern note (irregular flat): It’s a 3–3–5 structure — A = 3 waves, B = 3 waves (often pokes above the prior high), and C = 5 waves. On this chart, A and B already printed as 3 + 3. The setup isn’t confirmed until we see C unfold as a clear 5-wave move (1-2-3-4-5). No five-wave C = no completed irregular flat.
What would confirm it (the “if/then”)
Lose the first rising trend support (≈ 109k).
Then lose the second, deeper trend support.
If both break, the path toward ~62.5k could be opening up.
Between those two lines: BTC can go sideways for a weeks—that “range box” is important.
Why the range box matters (Altseason meter)
Altcoins usually need steady BTC to fly:
BTC sideways (not spiking up or dumping).
TOTAL2 (alt mkt cap) breaks ATH.
BTC.D rolls over (dominance falls).
If these three line up, we’ve got a real altseason setup. If not, it’s noise.
Bottom line
This is a watchlist scenario, not gospel.
I’ll respect the levels: no break = no bear target.
If we range between supports, I’ll look for alt strength while BTC stays calm.
Crypto-price-action
#202426 - priceactiontds - weekly update - bitcoinGood Evening and I hope you are well.
bitcoin
Quote from last week:
comment: Currently my favorite market to trade and comment on because I’m hittin dem swings big time. And because btc permabullz are entertaining and salty af. Market is clearly trading down again and they shout from the rooftops that we will print 80/100k soon. In all seriousness. Clear trading range 65000 - 72000. Currently in a smaller down trend probably to touch the bull trend line around 65000 and then maybe back up to test the upper triangle trend line around 67000 again. Bear channel and triangle, both patterns are in play currently. 66000 continues to be big support so it will take something to break through. If we do break below, 61000 is next.
comment: Guess what. Anyone looking at this chart who tells you to buy for anything higher than 66000 is a permabull in denial. The last time a daily bull bar closed above its midpoint was almost 3 weeks ago. The bull trend line from 2024-02 is clearly broken. Market touched the weekly 20ema and bounced some but bulls could not get any follow through, what so ever. Bears are not that strong either tbh, just grinding this down. At some point one side will give up for a huge drop/bounce. Until bulls can make higher highs above 66500 again, you should not be looking to buy this imo. So what’s next? I expect more sideways to up movement until we reach the upper bear channel and/or the daily ema gain, where I will look for shorts again. Targets below are 61000 and if that does not hold, 56000-58000 is next.
current market cycle: trading range until clear break below 56000. It’s also a smaller weak bear trend inside that big trading range
key levels: 62000 - 67000 small range / 56000 - 74000 (big range)
bull case: Bulls tried to find a double bottom on Monday around 65000 but bears just kept at it on Tuesday and every bull bar the bulls produce on the daily is a doji or is closing below it’s midpoint. They want to touch the upper bear channel again and maybe the daily ema around 66000 but I don’t think they can get above 65000.
Invalidation is below 63000.
bear case: Bear want the bulls to finally give up and produce some big bear bars closing on their lows for targets below 60000. The selling get’s weaker and it’s just a slow grind down. Best trades are currently shorts near the 4h 20ema. Odds clearly favor the bears to break stronger to the downside, than bulls breaking above the channel.
Invalidation is above 67000.
short term: Neutral between 63300 - 65500. Expecting sideways to up movement in this range before another try to push this down harder to 60000 or 57000.
medium-long term: Down to 50000 (could take 3-6 months). Longer term than that time frame, I don’t know. Could also drop to 30000 again but let’s make 40000 first and see how many want to buy there. —Adjusted 40000 to 50000 and 40000 to 30000 because we are staying so long up here above 60000.
current swing trade: None
chart update: Removed longer waves and just focusing on this bear channel and how market behaves around 63000 over the next 1-2 days. Will update the daily chart again when we see a bigger move.

Gala chartthe price action is forming into a perfect position with the potential game launch of their big title game Mirandus.


Litecoin short term updateLitecoin Continues to be the weakest of the the top 5, recently made a lower low where the others held a higher low.
The volume overall is still declining, you could say that the bears are running out of steam, If true then the bulls are not showing much strength either.
Watching the triangle, a break above we should have LTC retest the recent high of the channel & most likely range for a while, A break below will signal new lows.
Neutral short term overall bearish
follow for updates
