SOLUSDT: Liquidity Tightens – Every Pullback Drops Even Deeper!When talking about Solana right now, the clearest feeling is that the market is losing strength day by day . Recent news shows that SOL has dropped sharply in November, and large capital keeps exiting the market — turning every bounce into an excuse for holders to sell rather than a sign of reversal.
On the H4 chart, SOL is trapped inside a descending wedge , repeatedly rejected by the Ichimoku cloud — an area that has consistently blocked every recovery attempt. Each previous bounce has only led to an even stronger downward leg.
The $130 level is the nearest immediate resistance and also aligns with the descending trendline. If price pulls back to this zone, there is a high probability of fresh selling pressure emerging. When that happens, SOL could continue dropping toward the psychological support at $100 — the key target in the current bearish outlook.
In summary, with both negative news and a weak technical structure, the most reasonable strategy now is to follow the downtrend , wait for price to pull back into resistance to find cleaner entries, and avoid catching bottoms when the market shows no clear reversal signals.
Crypto

AAPLAAPL has just executed a textbook bullish breakout from a 10-month ascending triangle, decisively clearing multi-year resistance at ~$255–260 on strong volume. The former resistance zone now acts as support, with a measured move targeting $293–$296 and potential for $300+ in an impulsive upward phase. This is a high-conviction bullish setup with favorable risk/reward for longs.

BTCUSD Liquidity Sweep Setup Before Bearish ContinuationBTCUSD Liquidity Sweep Setup Before Bearish Continuation
Overview
BTCUSD continues to display persistent downside pressure across the mid-term structure. Price action on the 3H timeframe shows a sequence of lower highs and lower lows, reflecting sustained bearish control. Despite short periods of stabilization, the overall market environment remains distribution-driven.
Market Structure
Recent price behavior confirms multiple break-of-structure (BOS) events, each reinforcing the broader downward momentum. Every attempt at upward expansion has been met with supply absorption, indicating that buyers are failing to regain initiative. The consolidation developing in the current region suggests an accumulation of short-term liquidity, but without structural evidence of reversal.
Supply & Liquidity Context
Price is positioned directly beneath a key supply zone highlighted on the chart. This zone remains unmitigated and acts as the primary area where counter-trend reactions are likely to be absorbed. The tightening range beneath this level indicates liquidity buildup, commonly preceding engineered sweeps by institutional players.
The current model suggests that the market may execute a short-term liquidity run above local highs before resuming its downward trajectory. Such a move would align with previous behavior in this trend cycle, where short-term rallies were primarily used to deliver liquidity into higher-timeframe supply.
Downside Expansion Risk
Should the market complete a liquidity sweep into the supply zone, the next phase of downside continuation becomes probable. The structural projection on the chart anticipates a revisiting of the lower demand region around 74,300 – 75,000, an area aligning with previous inefficiencies and untested demand.
This target supports the continuation of the broader bearish structure unless a significant shift in order flow emerges.
Summary
BTCUSD remains positioned within a well-defined bearish cycle, characterized by repeated structure breaks and unmitigated supply zones controlling price. Current compression suggests the market is preparing for another liquidity-driven move. Unless buyers regain structure above the key supply region, the market retains a high probability of extending toward lower demand zones.

BTCUSD – Outlook for the Upcomming daysMonthly View
The monthly timeframe remains bullish overall, but Bitcoin has pulled back to gather strength, it can take previous monthly timeframe low's liquidity. This kind of move is typical when the market is gearing up to break a higher high. The broader structure hasn’t shifted—this is simply a deeper retracement inside a bullish narrative.
Weekly View
The weekly chart is showing a similar story. Price has been dropping consistently without giving even a single proper reversal. If BTC truly wanted to fall aggressively, it would normally make a move up first, trigger traders’ stop-losses near previous highs, and then dump. But this time, it didn’t do that.
This unusual behavior hints that the market may be preparing something different from what most traders expect.
Daily View
The daily timeframe is where things get really interesting. Bitcoin spent more than half the recent sessions moving sideways, collecting liquidity on both sides. After that, it dipped and formed a lower high—but that lower high hasn’t been broken yet.
According to my analysis, BTC is currently sitting in the Discount Zone, an area where buyers often start becoming active.
4-Hour View
On the 4H chart, I already had a clean short setup earlier, but now I’m watching for signs of a potential reversal. That reversal idea is not guaranteed, though—it becomes invalid if BTC fails to break the series of lower highs.
There’s also another scenario: BTC might refuse to break the lower highs and begin forming higher lows at the same time. If that happens, we’ll see a period of sideways consolidation. When the breakout finally comes—whichever direction it chooses—the move is likely to be powerful.
Final Thoughts
Based on my analysis, BTC is showing mixed but promising signals across the higher and lower timeframes. The monthly structure is still bullish, and this pullback looks more like preparation for a stronger push rather than a trend reversal. Weekly price action hasn’t shown any meaningful bounce yet, which is unusual—and that alone hints that the market might be setting up something unexpected.
On the daily chart, BTC has swept liquidity after moving sideways for quite a while, and now it’s resting in the Discount Zone, where smart money usually becomes active. The 4H timeframe already gave clean short opportunities earlier, but now the market is approaching a point where a reversal could begin—unless lower highs remain untouched.
If BTC starts forming higher lows without breaking lower highs, the market will likely slip into a compression phase. When price finally breaks out of that squeeze, the move—up or down—can be very strong.
Again, this is just my personal viewpoint. Please do your own analysis before investing. Your profits and losses are entirely your responsibility—I’m only sharing what the charts are suggesting to me right now. Stay alert to the reaction levels ahead; that’s where the next major direction will reveal itself.
----------------------------------------------------------------------------------------------
Thanks for checking out this analysis! If you enjoyed it, hit that follow button so you don’t miss future updates. And if this breakdown helped you out, drop a like 👍 and share your thoughts in the comments 💬—I always appreciate the feedback!

BTC Is Falling Freely – Every Pullback Is Just a Trap!Bitcoin is currently entering a phase where every bounce is seen as a selling opportunity . Market sentiment has turned cautious as news continues to lean negative: BTC has broken its lowest level in six months around $86,000 , and reports indicate that a major whale has exited a position worth $1.3 billion . When big money pulls out, the market struggles to stay stable.
Observing price action, BTC is moving steadily downward with lower highs forming continuously . Every time the price attempts to rise, it gets pushed down immediately, showing that sellers are fully in control of the market. Upper price zones are consistently rejected, proving that buying pressure is not strong enough to create any meaningful reversal.
The most reasonable scenario now is that BTC may stage a technical bounce toward $93,700 , but it is likely to encounter strong selling again and continue falling toward the major target around $76,800. Any upward move during this period is just a pullback to sell , not a signal of a real trend reversal.
In short, negative news + bearish technical structure are strongly aligned, so for short-term traders, it’s best to sell with the trend , wait for price to pull back before entering, and avoid catching bottoms when the market has no clear reversal signals yet.
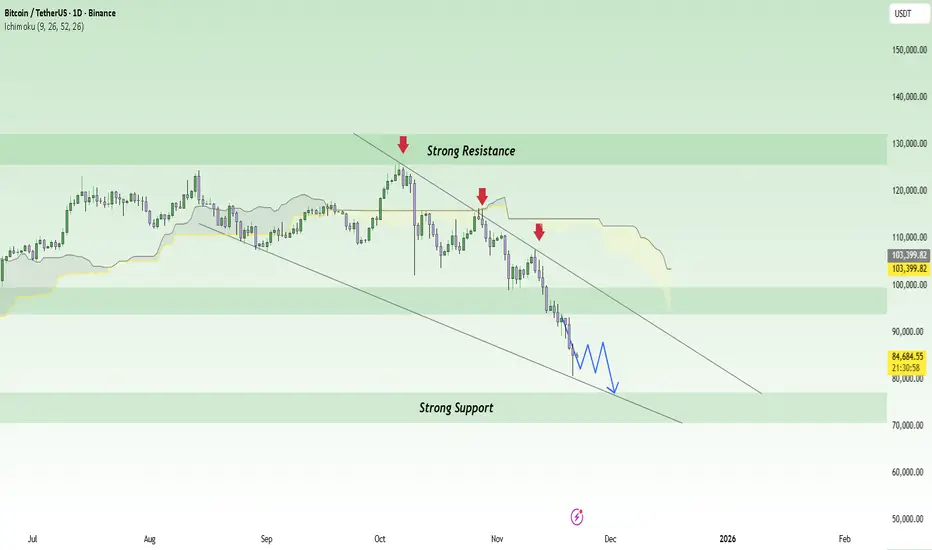
BTC Daily Analysisbased on our previous analysis bitcon made an announced ATHs and drop down from that point.
it is near our important support levels. we expect BTC ranges between its support and resistance levels.
in weekly timeframe we can't see any signs of downward movement.
if any of these levels breaks with ichimoku confirmation, i will update the analysis.

EURUSD: Targets focus on declines to 1.1480 support levelHello everyone, here is my breakdown of the current Euro setup.
Market Analysis
EURUSD continues to trade within a clear Downward Channel, maintaining a strong bearish structure characterized by consistent lower highs and lower lows. Early in the chart, the pair formed a prolonged Range Phase, signaling indecision before sellers eventually took control and pushed the price downward. After breaking below the range, EURUSD repeatedly retested the Resistance Area around 1.1550, where the market showed strong bearish reactions. Each bounce into this resistance zone resulted in a clear rejection, proving that sellers consistently defend this area. The chart also highlights multiple Breakout attempts, all of which failed to sustain upward continuation, confirming a lack of bullish strength. Additionally, the chart shows the formation of a Triangle Pattern, with price reacting between the Triangle Resistance Line and the Triangle Support Line. Despite temporary recoveries, every move upward was limited and capped by descending trendline pressure.
Currently, EURUSD broke below the minor structure support again, demonstrating that bearish momentum remains dominant. Price is now heading toward the Support Zone near 1.1480, which aligns with both horizontal demand and the Triangle Support Line. This confluence makes it a key level to watch. As long as EURUSD trades below the 1.1550 Resistance Area and stays inside the Downward Channel, the bearish structure remains intact. Any bullish recovery is likely to be corrective rather than trend-changing unless buyers manage to break above major resistance.
My Scenario & Strategy
I expect EURUSD to continue edging lower toward the 1.1480 Support Zone, following the recent rejection from resistance. A minor upward correction may occur, potentially retesting broken support or the Triangle Resistance Line, but such a move would likely be short-lived without strong bullish confirmation.
A confirmed breakdown below 1.1480 would open the path for deeper bearish continuation within the Downward Channel. Only a solid breakout above 1.1550, backed by strong buying pressure, would challenge the prevailing bearish trend. For now, selling the pullbacks remains the more favorable strategy while price stays below major resistance.
That's the setup I'm tracking. Thank you for your attention, and always manage your risk.

BTCUSD Channel Support Holds as Price Targets $85K PullbackHello traders! Let’s break down the current BTCUSD market structure. Bitcoin is trading inside a well-defined descending channel, forming consistent lower highs and lower lows. This structure confirms that the market is still moving within a broader bearish trend. Earlier, BTC created a large range phase on the left side of the chart, showing indecision before breaking down and starting the current downtrend. Each approach to the upper trendline (Resistance Line) resulted in a clear turnaround, proving that sellers continue to defend this zone aggressively. During the recent decline, BTC made multiple corrections inside the channel, but every upward move was short-lived and rejected by the descending resistance. A recent breakout attempt failed, and price quickly returned back into the channel, signaling that bullish momentum remains weak. Currently, Bitcoin is testing the Support Line of the descending channel near the $81,400–$82,000 zone. This level has acted as a key demand area within the trend. A short-term bounce from support is possible, and the chart shows a projected move toward TP1 near $85,000, which aligns with a minor internal resistance level. However, as long as BTC trades below the major Resistance Level around $94,000 and within the descending channel, the market maintains a bearish bias. Any bullish recovery is likely to be limited unless price can break above the channel and secure structure above $94,000. Please share this idea with your friends and click Boost 🚀

XAU/USD | Gold Rebounds Strongly After Hitting Key Demand Zone!By analyzing the #Gold chart on the 4-hour timeframe, we can see that after reaching $4105, the price dropped again and made a sharp move down into the $4026 demand zone I mentioned in the previous analysis. As soon as gold touched this zone, strong buying pressure kicked in, pushing the price back up to around $4080.
The next short-term supply zones to watch are $4090, $4100, and $4109.
The medium-term supply zones are $4150, $4172, and $4193.
Keep an eye on gold’s reaction in these areas, they can trigger new pullbacks or confirm further upside movement.
Please support me with your likes and comments to motivate me to share more analysis with you and share your opinion about the possible trend of this chart with me !
Best Regards , Arman Shaban

BTCUSD Short: Descending Channel Targets $89,000 Demand ZoneHello traders! BTCUSD continues to trade within a clear descending channel, maintaining a strong bearish structure characterized by consecutive lower highs and lower lows. The price action repeatedly respected the channel boundaries, confirming solid seller control throughout the recent decline. Each time Bitcoin reached the upper boundary of the channel, it formed a pivot point, initiating another downward wave. Before the latest drop, BTCUSD spent some time moving sideways inside a Range Zone, showing temporary accumulation before sellers regained dominance. The bearish continuation led to another pivot formation near the channel’s resistance, triggering a fresh leg to the downside.
Currently, price has now approached the $89,000 Demand Zone, which aligns with the lower boundary of the descending channel. This level has acted as a significant reaction point, generating short-term bounces in previous price swings. The current positioning suggests that buyers may once again attempt to defend this zone. While below the $96,000 Supply Zone and the channel resistance, the broader trend remains bearish. BTCUSD is likely to experience a short-term corrective rebound from the demand area, aiming toward the $92,000–$93,500 region — a previous reaction cluster and local resistance.
My scenario is targeting the $89,000 level. However, if Bitcoin breaks below the $89,000 Demand Zone, it may trigger a deeper bearish continuation toward the lower liquidity areas around $88,000 or even lower. A confirmed breakout above $96,000 would be required to invalidate the bearish structure and signal a potential shift in momentum. For now, BTCUSD remains bearish, with a potential short-term correction from demand before further direction becomes clearer. Manage your risk!

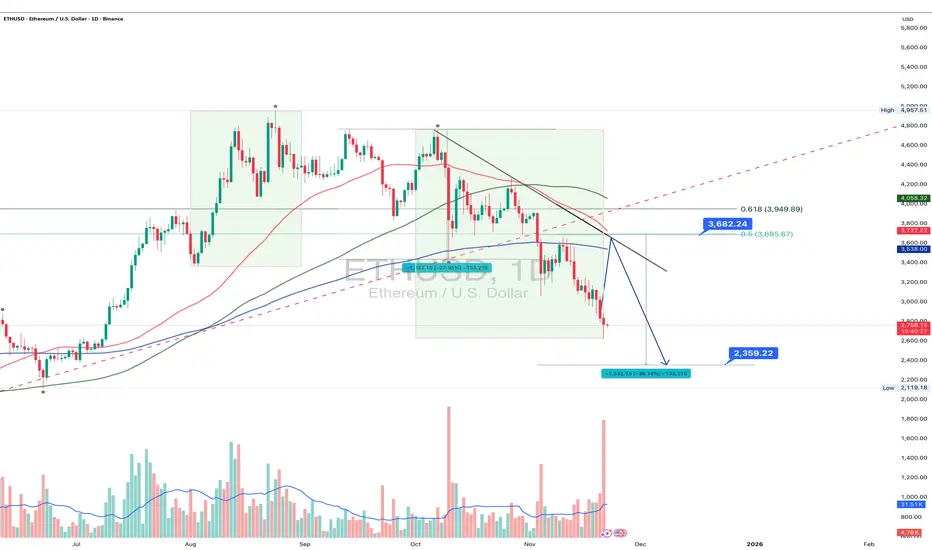
ETH 1D: correction unfolding or just a warm-up?Ethereum continues to trade within a clear bearish structure: after breaking below key daily moving averages, the decline accelerated, pushing the price into the 2720–2800 zone an area that previously acted as a short-term reversal cluster. The trendline from the recent top is broken, and a retest of the 3600–3700 resistance (0.5–0.618 Fib) remains the key scenario before any continuation of the downtrend. Only a confirmed breakout above 3700 would shift the structure back to bullish.
A deeper correction target sits around 2360–2400, where symmetry projections and previous accumulation zones converge.
Fundamental snapshot (Nov 22): network activity is stable, but downward pressure persists due to lower transaction fees and reduced validator revenue. Capital inflows remain weak, and ETH’s dominance continues to erode against L2 networks and alternative L1s. The market is waiting for strong catalysts such as real-world asset tokenization and institutional adoption. In the short term, sentiment leans neutral-to-bearish, supporting the probability of a move toward 2360–2400.
As long as ETH remains below 3600–3700, the bearish scenario holds priority. A breakout above 3700 would flip the structure, but current price action still favors continuation of the correction.
Ethereum is full of surprises - yet price levels tend to be much more disciplined than traders.
BITCOIN (BTCUSD): When to Buy?!
Bearish rally continues on Bitcoin.
The market already lost more than 34% from a current ATH.
Analyzing a historic price action, I see an important structure cluster to focus on.
65000 - 76000 is a significant support area.
That will be a good zone for buying Bitcoin, expecting a resumption
of a long-term bullish trend after its test.
❤️Please, support my work with like, thank you!❤️

BTC/USDT Building an Early Base, High Chance to Retest 93K-108+BTC/USDT — Building an Early Base, High Chance to Retest 93K → 108K+
Bitcoin is forming a stabilization zone between 80K and 93K, which could mark the start of a deeper recovery phase. The recent bounce off the lower boundary suggests that buyers may be re-entering, setting up a potential long-term trend shift.
Key Technical Points:
📉 Support Zone: The lower range around 80.6K has held, showing strong demand at these levels.
🔁 Current Structuring: BTC’s price action shows a gradual range build — this isn’t just a short-term bounce, but a possible formation of a base.
🎯 First Upside Target: A clean breakout above 93K would signal renewed strength and is likely to trigger further buying.
🚀 Extended Target Potential: If momentum confirms and volume supports the move, BTC could aim for the 100K+ region. This would align with a multi-wave recovery to reestablish higher long-term structure.
Trade Outlook:
Holders: This could be a key accumulation setup — building on strength around the base may pay off if the breakout runs.
Short-term traders: Watch for a breakout above 93K with volume as your trigger for re-entry or scaling in.
Risk: If BTC fails to reclaim 93K decisively, a retest of the 80K base is still possible.
Summary:
There’s a realistic and structurally sound scenario where BTC could recover from this base and push toward 93K, with a strong shot at going 100K+ if the breakout materializes. Conditions are setting up for a potential multi-wave uptrend, but confirmation will be critical.

Ethereum Slides Deeper as Price Moves Toward 2,750 SupportHello everyone, Ethereum is facing a rather uncomfortable decline after its attempt to recover from the 3,000 USD region failed completely. The price is now hovering around 2,790 USD — the lowest level in over 10 days — and is trading firmly below the Ichimoku cloud, a familiar signal that sellers are still dominating the market.
Observing the price structure on the 4H chart, I see ETH repeatedly leaving red FVGs above, stretching from the 3,000 to 3,200 USD zone. This clearly shows one thing: every recent bounce has been quickly sold off. The market is showing a clear “sell the rally” sentiment, making the short-term downtrend smooth and consistent.
Ethereum is now sliding toward the 2,750 USD zone — a key support area that held price quite well in early November. This is also where liquidity thickens, a region where the market often reacts. But if this level is broken cleanly, the decline could extend toward 2,700–2,650 USD, right at the high-liquidity region and strong support on the D1 timeframe.
News flow also isn’t helping crypto at the moment. The USD is strengthening after September’s jobs report came in far above expectations, raising concerns that the Fed may not cut rates anytime soon. When the dollar becomes more attractive, capital tends to move away from risk assets — and crypto feels the pressure directly. Meanwhile, US equities are recovering strongly thanks to Big Tech and AI stocks, drawing speculative flows away from major coins like ETH.
From my perspective, the highest-probability scenario is that Ethereum continues dropping toward 2,750 USD to test demand. If this area fails to generate a strong enough reaction, price could easily extend lower toward 2,700 USD — a zone where technical buyers may become more active.
What do you think — will Ethereum defend 2,750 USD successfully, or will it need to drop further before recovering?

BTC Outlook: 90K Zone Retest PossibleBTC Outlook: 90K Zone Retest Possible
BTC has entered a strong reaction zone around 82–85K, which historically acts as a demand block. The initial bounce from this area suggests buyers are stepping in again.
Key Reasons a Move Back to 90K Is Possible:
1. Strong Demand Zone (82–85K)
BTC is showing clear absorption of selling pressure. This is typically the first step before a reversal toward higher resistance levels.
2. Market Structure Reversal Pattern
Your chart indicates a potential W-bottom / reclamation setup. Once BTC holds above 85.6K, momentum usually shifts bullish.
3. Liquidity Above (88–90K)
There’s a large cluster of untapped liquidity at 88–90K where previous breakdowns occurred.
Market makers are incentivized to push price back up to that zone.
4. 90.3K = First Major Resistance Target
The yellow line at 90,370 aligns with:
HTF resistance
Former support flip
Liquidity target
Perfect location for a retest.
Scenario Path (Matches Your Green Projection):
Bounce from 82–85K
Break above 85.6K reclaim
First target → 87K
Pullback / consolidation
Final push → 89.5K–90.3K

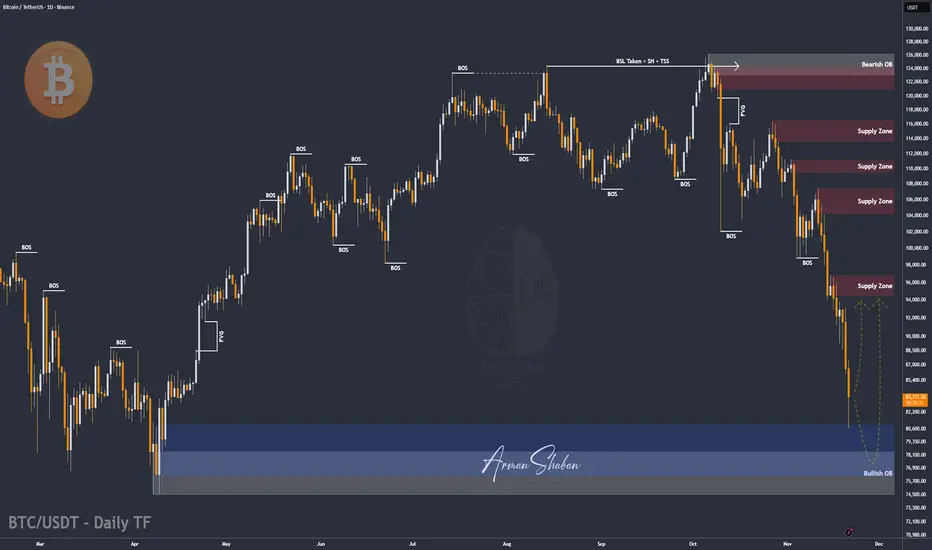
BTC/USDT | Bitcoin Hit Major Demand, What’s Next?By analyzing the #Bitcoin chart on the daily timeframe, we can see that the price dropped exactly as expected and fell sharply to $80,500. Once it reached this major demand zone, buyers stepped in and Bitcoin bounced back to around $83,900.
As long as BTC can hold above the large demand zone between $74,000 and $81,000, we can expect the next bullish wave to start.
From my perspective, the trend is not bearish! this is still a healthy correction.
From the ATH at $126,200, Bitcoin has corrected 36%, which is completely normal in strong uptrends. Now it’s time to watch for decreasing selling pressure and the beginning of a stronger upside move. This analysis will be updated soon.
Please support me with your likes and comments to motivate me to share more analysis with you and share your opinion about the possible trend of this chart with me !
Best Regards , Arman Shaban
XAUUSD: Price Holds Triangle Support, Aiming for $4,120Hello everyone, here is my breakdown of the current Gold setup.
Market Analysis
XAUUSD is trading within a broad symmetrical triangle structure, where price continues to respect both the Triangle Resistance Line and the Triangle Support Line. After a strong bullish rally inside the Upward Channel earlier, Gold reached the Resistance Area around $4,120–$4,130, where a sharp reversal occurred. This zone has consistently acted as a major supply level, triggering multiple corrections in recent sessions. Following the breakout below the Upward Channel, XAUUSD entered a consolidation phase supported by the Support Zone near $4,000, which aligns with the lower triangle boundary. This level has proven to be a key reaction zone, showing strong buyer interest each time price tested it.
Currently, Gold attempted another bullish push after bouncing from the Triangle Support Line. Price is now approaching the Resistance Area once again, but buyers face strong selling pressure around $4,080–$4,120, which overlaps with both horizontal resistance and the descending triangle boundary. A break and close above the Triangle Resistance Line would confirm bullish continuation and likely lead to a retest of higher liquidity levels near $4,180–$4,200. As long as XAUUSD stays above the $4,000 Support Zone, the broader structure remains bullish. However, sustained failure to break the resistance area may result in another corrective move back toward the Triangle Support Line.
My Scenario & Strategy
From my perspective, as long as Gold holds above $4,000, the bullish bias remains intact.
My near-term target (TP1) is the $4,120 Resistance Area, with potential extension toward $4,160–$4,200 if buyers manage a clean breakout above the triangle resistance. I will look for long entries on pullbacks toward the Triangle Support Line or the Support Zone around $4,000–$4,020, especially if bullish rejection patterns appear.
If XAUUSD breaks below the $4,000 level, the bullish setup becomes invalid and deeper correction toward $3,960–$3,920 may follow. For now, price action favors a bullish continuation setup, provided support continues to hold.
That's the setup I'm tracking. Thank you for your attention, and always manage your risk.

Bitcoin Drops Sharply – Is This Bounce Only Temporary?Hello everyone, Bitcoin continues to show weakness on the 4H chart: the bearish structure remains intact, with overlapping red FVGs above and nearly every rebound being rejected quickly. After the sharp fall from the 100,000 USD region, the price is now hovering around 85,000 USD — a level that clearly reflects persistent selling pressure.
Digging deeper into the technicals, BTC remains below the Ichimoku cloud and under several unfilled FVG zones, especially the 87,500–89,000 USD region. This forms a “lower ceiling” where any upward attempt is met with immediate selling pressure. Volume also leans heavily toward the sellers, reinforcing the view that the short-term trend is still firmly bearish. Just beneath the price, the 84,500–84,000 USD area is acting as temporary support; it’s also the nearest liquidity pocket, suggesting a technical rebound may occur.
The broader environment is not helping Bitcoin either. The USD has strengthened following a series of stronger-than-expected US economic reports, from employment data to Big Tech performance. This has pulled capital away from risk assets. US equities continue to attract speculative money, while the Fed has yet to provide any clear signal about rate cuts. Market sentiment isn’t extremely risk-off, but it is discouraging enough to limit Bitcoin’s chances of staging a meaningful reversal.
With all these factors combined, I lean toward one main scenario: Bitcoin may see a technical rebound toward the 87,000–88,000 USD region, where the nearest FVG and an unfinished supply–demand balance lie. However, I still expect this bounce to act merely as a liquidity-grab move before BTC faces renewed selling pressure and revisits the 84,000–82,500 USD zone.
What do you think — is this rebound just a trap before the next leg down?

BTC Wyckoff (pt. III), Pi Cycle Top, 350 SMA, and SPY Is A SELL!Trading Fam,
Was this the top? Where is Bitcoin going? Where are stocks going? Will the selling continue? How long? Can we find some targets? Where should we look to start DCA'ing back in? These are hard questions. Let's take a look at what my charts are showing us.
✌️Stew

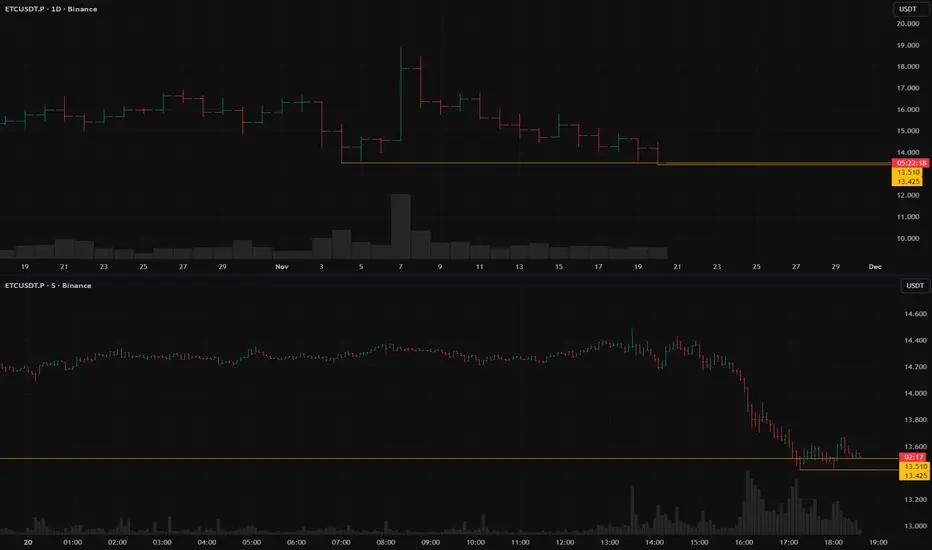
ETCUSDT.P:short setup from daily support 13.425BINANCE:ETCUSDT.P is dropping alongside Bitcoin. Currently, the price has hit a strong level and started "grinding" it. While this is typically a messy signal, there is structure within this chop, as a clear local level has formed at 13.425, offering a potential short setup. Although the asset has already covered a significant range today, I am keeping it on watch. If the price continues to consolidate tightly without pulling away, or if we see a weak correction followed by a smooth re-approach, I will await my entry trigger.
Key factors for this scenario:
Global & local trend alignment
Price void / low liquidity zone beyond level
Correlation with the market
Volatility contraction on approach
Immediate retest
Prolonged consolidation
No reaction after a false break
Factors that contradict this scenario:
Exhaustive move (approaching from afar)
Was this analysis helpful? Leave your thoughts in the comments and follow to see more.
Bitcoin dropped as planned. Wait for a new range to take SHORTBitcoin dropped as planned. Wait for a new range to take SHORT
global trnedi si still down
at this moment big liqudation had happend that's why price could create a range before new down move

SOL - Time for a pullback SOL - Time for a pullback
Before we take a new short we need a pullback and range
only after we can take a new short trade
Key resistance 171

BTCSince my first forecast regarding the BINANCE:BTCUSDT.P decline 2 months ago, the asset has dropped by 27%.
As of today, my global outlook on the market remains bearish. The first significant target is 78,200.2. Once reached, it will be necessary to assess the character of the price movement there.
While we move toward this target, the entire market will also likely head down. This creates excellent opportunities to profit, as the market is moving rather than standing still.
Subscribe to not miss updates.
