PUMP At Key Decision Zone Inside Descending StructurePUMP is still trading inside a ascending broadening wedge that has been guiding price action for an extended period. The recent move shows a short term recovery attempt, but price remains below the dominant descending resistance, keeping the overall structure bearish.
At the moment, price is reacting near a minor ascending support inside the wedge. This bounce looks corrective rather than impulsive, as it has not yet broken the main descending trendline with strength. The current structure suggests a potential pullback toward the highlighted demand zone before any stronger bullish continuation can be confirmed.
If price revisits the lower support zone and holds, a higher low could form, opening the door for a stronger recovery toward upper resistance levels. However, failure to defend this zone would likely lead to continuation toward the lower boundary of the wedge, aligning with the broader bearish trend.
This is a decision area. The next move will likely define whether PUMP transitions into accumulation or continues its larger downtrend.
Crypto

Crypto May Be In Trouble!Trading Fam,
I feel dirty for posting these recent titles. They are not intended to be clickbait. I swear. I am only relaying to you what I am seeing in the charts. I never really gain popularity by becoming bearish on crypto anyways. Degens still heart the moonboys. I am not one.
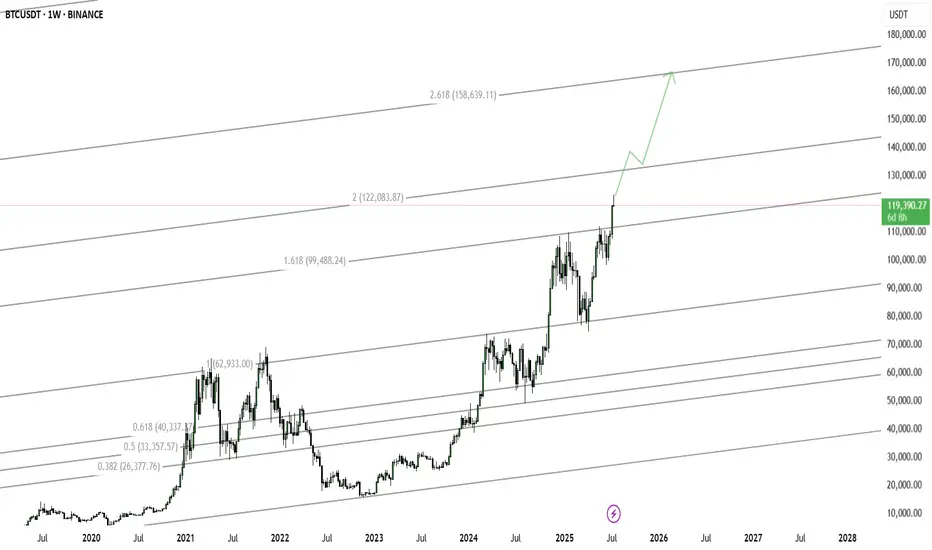
Now, to put it simply, Bitcoin has a 15 percent chance to negate the very ominous H&S pattern I am seeing in the charts. Should it take that 15 percent path, what I am about to say becomes null and void.
If Bitcoin follows the highest probability path here and this H&S pattern plays out (85 percent chance), then you can see the target I have drawn to the downside ...somewhere between 40-50k is my rough estimate. Ouch! This represents up to a 50 percent drop from current price.
Surprisingly, altcoins appear to be able to fair better. The target I have drawn for the Total3 chart represents a 25-30 percent loss.
Both Bitcoin and Altcoins are on strong support right now. If broken, the targets down become valid.
Total3 shows that price remains in a descending channel. Should Bitcoin's H&S pattern trigger, I would expect alts to follow. They would then descend to the bottom of this channel which intersects with that green support area.
You will also note that I have an "October 2023 Support" trendline drawn on both charts. Both of these trendlines have been broken to the downside, giving further indication of more bearish price action to come.
Be SAFU!
✌️Stew

XRP has formed a bearish head and shoulders pattern
📊 XRP Update
XRP has formed a bearish head and shoulders pattern
and is now testing the blue support level 🔵.
If this support breaks down,
there is a potential short entry 📉
with the first target at the green line level 🎯.
Waiting for confirmation,
breakdown strength will be key.
and is now testing the blue support level 🔵.
If this support breaks down,
there is a potential short entry 📉
with the first target at the green line level 🎯.
Waiting for confirmation,
breakdown strength will be key.

SEI At Key Support After Prolonged DowntrendSEI has been in a sustained bearish structure, trading inside a descending broadening wedge after losing its previous bullish range. The recent price action shows compression near a critical horizontal support zone while price remains below the descending resistance trendline.
A potential inverse head and shoulders structure is attempting to form inside the lower part of the wedge. However, price is still capped by the falling resistance, making this area a high risk zone rather than a confirmed reversal.
If SEI manages to reclaim the descending trendline and hold above the neckline area, a recovery move toward the mid range and higher resistance levels becomes possible. This would signal a structural shift from bearish continuation to short term trend stabilization.
On the downside, failure to hold the current support could trigger another leg lower toward the lower boundary of the wedge, completing the bearish continuation before any meaningful recovery attempt.
This zone is critical. The next reaction will likely define whether SEI stabilizes or extends the downtrend further.

SOL — unfinished business belowSOL still feels unfinished.
Price tagged the HTF bearish C (the gray box).
Yeah, it bounced a bit. But that’s it.
No structure flip.
No real strength.
Just more bearish sequences stacking .
That’s not a bottom. That’s a pause.
Below that gray zone sits another HTF bearish C .
And the last pink sequence still has its C wide open . Untouched.
We just reacted from the BC .
That move looks corrective to me. Reset energy, not reversal.
So I’m still leaning bearish.
As long as price keeps failing to protect highs, these pops are noise.
The magnet is still lower.
If structure flips and starts holding above, I’m out. Simple.
Until then, downside makes more sense.
Not financial advice. Just my read.

SOL/USDT | Slowly going back up (READ THE CAPTION)By examining the daily chart of SOLUSDT we can see that after dropping as low as 112.14 and touching the high of the Bullish OB, it bounced back up and its currently being at 116.00.
Considering that Solana has swept the liquidity pool, I expect it to slowly move higher.
Targets for Solana: 116.50, 117.00, 117.50, 118.00, 119.00 and 120.

XAUUSD 1H chart pattern market is making lower lows and lower highs it is strong down trend
entry at 5003
target should be 4720
trade active active

GOLD DROPPING BADLYXAUUSD is showing a strong impulsive bullish structure on the higher timeframe followed by a sharp rejection candle, signaling a corrective phase after an overextended rally rather than a confirmed trend reversal, with price pulling back into a key Fibonacci retracement and previous breakout demand zone where resistance flipped to support, a classic breakout and retest scenario watched by smart money and trend traders. The broader market context still favors gold strength as safe haven demand, inflation hedge positioning, central bank gold accumulation, and ongoing macro uncertainty continue to underpin the long term bullish narrative, while short term volatility is being driven by US dollar flows, bond yield expectations, and high impact economic releases that temporarily fuel profit taking after parabolic moves. Technically this is a healthy pullback within an overall uptrend, with liquidity being rebalanced and momentum resetting from overbought conditions, and as long as price holds above the major demand block and structural higher low zone, dip buying, trend continuation, bullish order flow, and breakout retest setups remain the dominant strategy for positioning toward higher resistance levels once the correction completes.

ETHUSD (3H chart pattern ).ETHUSD (3H chart pattern ).
structure-based take.
What the chart shows
Strong impulsive drop → then a bearish descending channel (flag)
Price is below the Ichimoku cloud → bearish bias
Me’ve marked a breakdown attempt near the lower channel
This looks like a bear flag continuation, not a reversal
🎯 Downside Targets
🎯 Target 1 (near-term)
≈ 2,880 – 2,850
Recent reaction lows
First liquidity/support zone
Good partial profit area
🎯 Target 2 (main target)
≈ 2,700 – 2,680
Measured move of the flag (pole → breakdown)
Strong horizontal support
Matches my marked “target point” area
🎯 Target 3 (extension, if momentum is strong)
≈ 2,600
Previous demand zone
Psychological level
❌ Invalidation
If price breaks and holds above ~3,000–3,020
Or cleanly reclaims the channel + cloud → bearish setup fails
Summary
TP1: 2,880–2,850
TP2: 2,700–2,680
TP3: 2,600 (optional extension)
If my want, I can:
Tighten this into a scalp vs swing plan
Help with stop-loss placement
Or flip it and give bullish targets if it breaks up 📈

BTCUSD (3H, chart pattern)...BTCUSD (3H, chart pattern).
clean bearish structure 👍
Here’s the straightforward target map based on what’s on my chart.
🎯 Targets (bearish continuation)
TP1: 87,900 – 88,000
→ Nearest liquidity + minor structure (price already reacting here)
TP2: 85,500 – 85,800
→ Equal lows + demand sweep zone (my marked “target point” area)
TP3 (extended): 83,800 – 84,200
→ Channel projection + higher-timeframe imbalance
🧠 Why these targets
Overall lower highs + lower lows
Price is below the descending trendline
Consolidation under resistance = bearish continuation
Ichimoku cloud above price → bearish bias stays valid
❌ Invalidation
Clean 3H close above 90,200 – 90,500
Break and hold above the descending trendline
🧭 Trade bias
Best plays: sell rallies
Avoid longing until trendline + structure break
If my want, tell me:
Entry price my eyeing
Scalp or swing.

above horizontal zone it can good rallyAs you can see, the trendline has already been broken. If price also breaks and holds above the horizontal resistance, it will open strong upside chances.
Above this level, the market can offer a good bullish move in the coming time.

ALGO Approaching Decision Zone Near TrendlineAlgorand has been trading under a long term descending trendline and is now compressing near a critical support zone. Price action shows the formation of a potential inverse head and shoulders structure while still respecting the broader downtrend.
The neckline area aligns closely with the descending trendline, making this zone extremely important. A successful breakout above this trendline would invalidate the bearish structure and open the path for a stronger upside continuation toward higher resistance levels.
However, if price fails to break the neckline and loses the local support, a downside move toward the lower liquidity zone is possible to complete the wick fill. This would keep the broader bearish trend intact.
Momentum is tightening and volatility is likely to expand soon. The next move from this area should define the short to mid term direction.

BTC/GOLD will bottom hereJust a couple more months of chop and pain for crypto before the up-only resumes again
This happened back in May 2021

BTC/USDT | Sweeping the SSL (READ THE CAPTION)After failing to sweep the liquidity, BTCUSDT has been experiencing a dramatic drop in its price, going as low as $81,118 and now being traded at 82,735. I would like to see BTC drop more and sweep the sellside liquidity before make an upwards move.
Targets for BTC: 82,000, 81,500, 81,000 and 80,500.

SOL Holding Major Support Inside Falling WedgeSOL is trading inside a well defined falling wedge structure on the higher timeframe. Price has been compressing within the wedge after a strong prior move and is now reacting near the lower boundary while sitting on a major ascending support trendline.
This ascending support has acted as a strong base multiple times in the past and is currently helping to slow down the downside momentum. As long as SOL holds above this rising support, the falling wedge structure remains valid and constructive.
A short term dip toward the lower wedge support is possible, but if buyers defend this region, price can gradually rotate higher toward the upper wedge boundary. A confirmed breakout above the wedge would open the door for a stronger recovery move toward higher resistance zones.
If price fails to hold the ascending support, the bullish structure weakens and deeper downside levels may come into play. This area is a key decision zone where the next major move is likely to form.

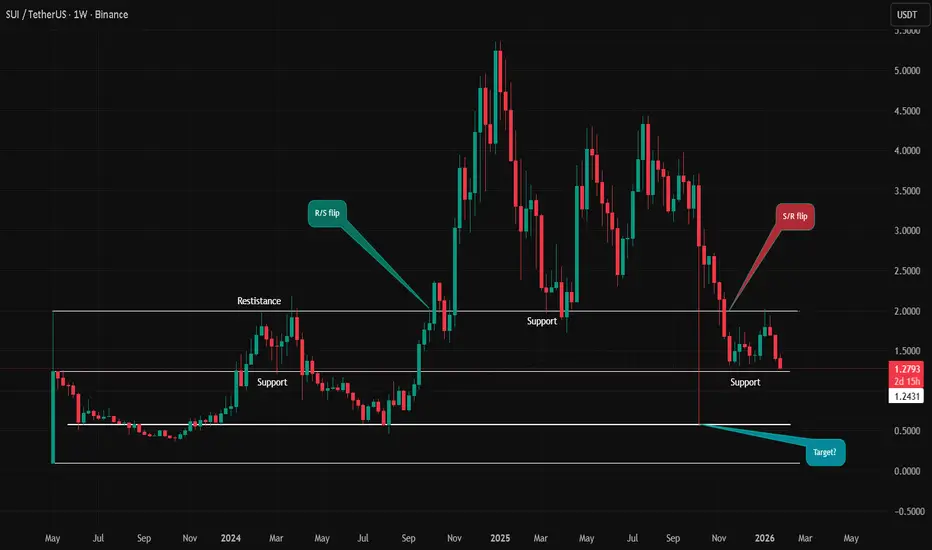
SUI / USDT – Weekly OverviewPrice is currently trading below a key support zone, which previously acted as strong demand.
This level has now turned into resistance (S/R flip).
Key Levels
Resistance: 1.55 – 1.65
Major Resistance: 2.00
Support: 1.20 – 1.25
Downside Target: 0.85 – 0.90
Scenario 1 – Bearish Continuation
As long as price remains below 1.55, the bias stays bearish.
Failure to reclaim this level increases the probability of a move toward 0.85, which aligns with previous demand on the higher timeframe.
Scenario 2 – Bullish Recovery
A clean weekly close above 1.55–1.65 would invalidate the bearish scenario.
In that case, price could rotate back toward 2.00, where heavy resistance is expected.
Conclusion
This is a high-timeframe decision zone.
Patience is key — wait for confirmation instead of anticipating the move.
What do you think: breakdown continuation or reclaim of resistance?
MrC
BTCUSDT Long: Recovery From Demand Zone - $89,800 in FocusHello traders! Here’s a clear technical breakdown of BTCUSDT (3H) based on the current chart structure. Bitcoin is trading within a broader corrective-to-recovery phase following a strong bullish impulse that previously developed inside a well-defined ascending channel. Within that channel, price consistently printed higher highs and higher lows, confirming buyer dominance and healthy trend conditions. The rally ultimately reached a key pivot point near the upper boundary of the ascending channel, where bullish momentum began to weaken. From this pivot high, BTC transitioned into a consolidation range, signaling temporary balance and distribution rather than immediate continuation.
Currently, BTC is recovering from the demand zone and moving higher along a rising demand line, while approaching the former supply level near 89,800. Price action suggests a corrective recovery rather than a full trend reversal, with buyers attempting to reclaim key structure. The area around 89,800 now acts as a critical decision zone, where market acceptance or rejection will likely define the next directional move.
My scenario: as long as BTCUSDT holds above the 87,200 Demand Zone and continues to respect the rising demand line, I expect a continuation of the recovery toward the 89,800 Supply Level (TP1). A clean breakout and acceptance above this resistance would strengthen the bullish recovery scenario and open the door for a move back toward higher resistance levels. However, a strong rejection from supply followed by a breakdown below demand would invalidate the recovery and suggest continuation of the broader corrective move. For now, price action shows buyers regaining short-term control, but confirmation at resistance is key. Manage your risk!

BTC is now bearish long term!!!From what we're seeing bitcoin has completed its bullish cycle and has now become bearish in long term, we're expecting a bit sideways for now then the completion of a 5 wave bearish move and looking forward to a wave 2 correction to continue the downward move

BTCUSD: continuation of the fall🛠 Technical Analysis: BTC is trading below the 90K psychological zone after the recent pullback, with price compressing near the MA cluster (dynamic resistance). The rising support line and the 88,335 area act as the key “trigger” zone: a clean breakdown can open the way for a deeper correction. Nearest resistance is 92,193 . Key downside support/target zone is 80,820.
———————————————
❗️ Trade Parameters (SELL)
———————————————
➡️ Entry Point: 88335.83
🎯 Take Profit: 80820.02
🔴 Stop Loss: 92193.50
⚠️ Disclaimer: This is a potential trade idea based on current analysis; market conditions and price direction are subject to change based on news factors and volatility.

BTCUSDT: Recovery From Support Within a Uptrend Toward $92,300Hello everyone, here is my breakdown of the current BTCUSDT setup.
Market Analysis
BTCUSDT is trading within a broader bullish market structure, previously supported by a well-defined upward channel. Inside this channel, price consistently printed higher highs and higher lows, confirming strong buyer dominance. During the advance, BTC reached the upper boundary of the channel, where a fake breakout occurred. This failure to hold above the channel top signaled temporary exhaustion and triggered a sharp corrective move to the downside. Following the rejection, price broke below the mid-channel structure and dropped aggressively into a clearly defined Support Zone around 88,500–89,000. This zone acted as a key reaction area, where selling pressure weakened and buyers began to absorb liquidity. The initial breakdown below support resulted in a fake breakout to the downside, after which BTC quickly reclaimed the level, indicating seller trap behavior.
Currently, after the fake breakdown, price entered a consolidation range, showing balance and compression rather than continuation selling. This range reflects a corrective phase after the impulsive drop, not a trend reversal. Recently, BTC broke out of this range to the upside and is now respecting a rising triangle support line, which suggests growing buyer strength and improving short-term structure.
My Scenario & Strategy
My primary scenario is bullish continuation as long as BTCUSDT holds above the 88,500–89,000 Support Zone and respects the ascending triangle support line. The recent breakout from the consolidation range strengthens the probability of a corrective recovery turning into a continuation move. I expect buyers to push price higher toward the 92,300 Resistance Zone (TP1), which represents previous resistance and a key reaction level. A clean breakout and acceptance above this resistance would confirm bullish continuation and open the door for a move back toward the upper boundary of the larger bullish structure.
However, if price fails to hold above support and shows strong bearish acceptance below the 88,500 zone, this long scenario would be invalidated and increase the probability of deeper downside continuation. For now, structure favors buyers, and the current move appears to be a healthy recovery after a corrective shakeout.
That’s the setup I’m tracking. Thank you for your attention, and always manage your risk.

SOL/USDT | SSL sweep? (READ THE CAPTION)As you can see in the 4h chart of SOLUSDT, it has experienced a massive drop from 148.74 all the way to 117.15, but managed to recover a bit and reached 128.34 before dropping again and now it's being traded at 122.70.
I don't want Solana to go for the Sellside liquidity pinpointed on the chart, but it is not unlikely for it to go there and sweep the liquidity below the 116.88 level, then starting a move upwards, going for the IFVG.
Bullish Targets for Solana: 123.00, 123.50, 124.00, 124.50 and 125.
Bearish targets: 122.50, 122.00, 121.50 and 121.00.

ETH/USDT | Where will it go? (READ THE CAPTION)By examining the 4H chart of the ETHUSDT we can see that Ethereum hit 3045, hitting the low of the FVG, but then today it dropped all the way to 2923, now being traded at 2928.
I'd like to see Ethereum retest the FVG again and then sweep the Buyside Liquidity pool.
Bullish Targets: 2936, 2954, 2972 and 3000.
Bearish targets: 2916, 2900 and 2884.
