ZEC Update: Fighting back with force ZEC Update: ZEC continues to strengthen structurally, with price firmly back inside the rising channel and now pushing higher within a well-defined uptrend. The prior downside thesis has been fully invalidated, and the reclaim of the channel has clearly shifted momentum back in favor of the bulls. Price is holding above the mid-channel region and printing higher lows, which is exactly what you want to see if this move is going to continue.
The reaction off the ~300 level was the key inflection point. That level acted as a higher timeframe demand zone, and the subsequent impulsive move higher suggests strong acceptance rather than a temporary bounce. Since then, ZEC has respected the lower boundary of the channel, using it as dynamic support, which reinforces that this is trend continuation rather than a corrective retrace.
Short term, price is consolidating around the low-500s, which looks constructive. This kind of sideways-to-slightly-up consolidation within an uptrend often resolves higher, especially when it occurs above prior resistance. The projected path (yellow) highlights a scenario where ZEC continues to grind higher with some volatility, using pullbacks to reset momentum before pushing toward the upper channel region.
As long as ZEC remains inside this rising structure, the bias stays bullish. Any pullbacks into the lower channel or prior breakout areas would be considered normal trend behavior, not weakness. A loss of the channel would be the first sign that momentum is fading, but until that happens, structure favors continuation.
Overall, this looks like a strong recovery phase following a failed breakdown, with ZEC transitioning back into trend mode. Patience remains important, but the technical picture continues to improve as long as price holds this uptrend structure and avoids a decisive breakdown back below it.
Crypto

EURUSD: 1.1750 Support Sets Up a Retest of 1.1800Hello everyone, here is my breakdown of the current EURUSD setup.
Market Analysis
EURUSD has confirmed a bullish shift after breaking out of the previous downward channel, signaling a clear change in market structure from bearish to bullish. This breakout marked the start of a strong impulsive move higher, with price establishing higher highs and higher lows. Following the breakout, EURUSD respected a rising trend line, which is now acting as dynamic support and reinforcing the bullish bias.
Currently, price pushed into the 1.1800 Resistance Zone, where selling pressure emerged, leading to a rejection and short-term pullback. This reaction looks corrective rather than impulsive, suggesting profit-taking instead of a trend reversal. The pullback is currently unfolding toward the Support Zone around 1.1750, which aligns with the previous breakout area and the ascending trend structure. This zone has already shown buyer reaction, indicating active demand.
My Scenario & Strategy
My primary scenario remains bullish as long as EURUSD holds above the 1.1750 Support Zone. I expect buyers to defend this area and attempt another push toward the 1.1800 Resistance Zone. A clean breakout and acceptance above 1.1800 would confirm bullish continuation and open the path toward higher targets.
However, a decisive breakdown below the support zone would weaken the bullish structure and signal a deeper corrective move. For now, price action favors buyers while the ascending structure and key support remain intact.
That's the setup I'm tracking. Thank you for your attention, and always manage your risk.

EURUSD in Uptrend – Retest of Support Before Next PushHello traders! Here’s my technical outlook on EURUSD (2H) based on the current chart structure. EURUSD is trading within a clear bullish environment after transitioning from a prolonged consolidation phase into an impulsive upward move. Earlier on the chart, price was moving inside a range, indicating balance between buyers and sellers. This range was eventually resolved to the upside, confirming a shift in market control. Currently, price is trading above the Support Level around the 1.1750 area, which also aligns with the Buyer Zone and the former range high. This zone is acting as a key demand area after the breakout. The recent pullback appears corrective, with price retesting support rather than showing impulsive selling pressure. As long as EURUSD holds above this support zone, the bullish structure remains intact. My scenario: if buyers continue to defend the 1.1750 Buyer Zone, EURUSD could resume its upward move toward the 1.1800 Resistance Level and potentially extend toward the 1.1820 TP1. A clean continuation above resistance would confirm further upside momentum. However, a breakdown below the support zone would signal a deeper correction and weaken the bullish setup. For now, the structure favors buyers while price respects support. Please share this idea with your friends and click Boost 🚀

Bitcoin (BTCUSD) – 1-Day Timeframe Tradertilki AnalysisGuys,
There have been many requests for me to share a new Bitcoin analysis, so here I am with my latest one.
My friends, Bitcoin is currently stuck between the levels of $94,500 and $84,000. This consolidation has two possible outcomes: it will break strongly in one direction.
If Bitcoin closes a daily candle above $94,500, it means that major buyers will push the price toward the $104,000 target level. In this case, my target level after a breakout above $94,500 will be $104,000.
If Bitcoin closes a daily candle below $80,000, the first target will be testing the $74,000 level.
This is only an informational Bitcoin analysis for you.
My friends, unlike some who throw out random targets, I analyze the data and follow the major buyers. In trading, the most important thing is to move together with those big buyers.✨
My friends, I share these analyses thanks to each like I receive from you. Your likes increase my motivation and encourage me to support you in this way.🙏
Thank you to all my friends who support me with their likes.❤️

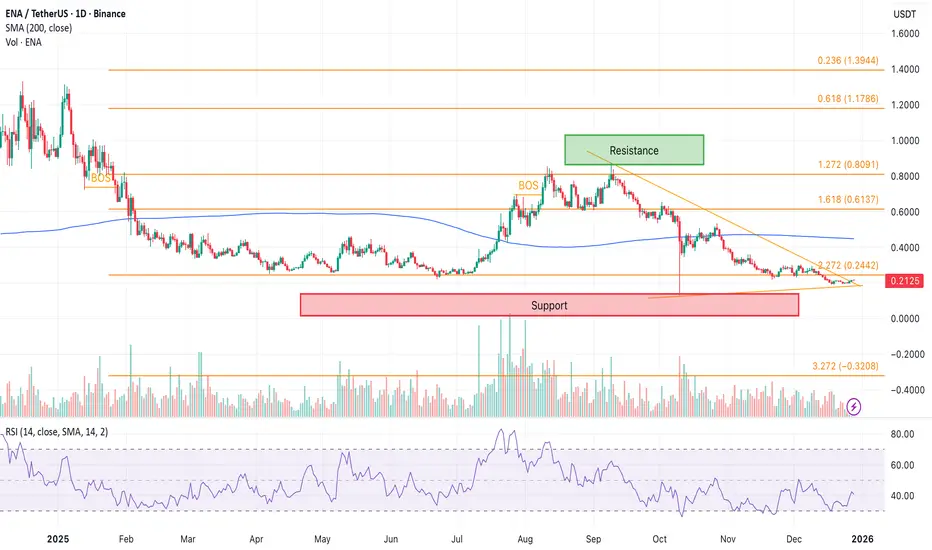
Here’s Where Ethena (ENA) Price Could Go Next* Ethena has just emerged out of a bear flag, but whether it has legs to stand on or if further downside can be expected is now in question.
* The recent bounce has been a weak one, which shows a measure of restraint on the part of traders who are holding out for further signs.
* On-chain data points to stabilization, not strong buying, which keeps ENA in a wait-and-see phase for now.
When you zoom out and look at Ethena’s recent price action, it’s clear the market isn’t panicking anymore, even after a sharp breakdown.
The ENA price didn’t drift lower slowly. Once the bear flag broke, the price dropped fast, falling more than 30% in a short span. That move wiped out late buyers and cooled off the optimism that had built up during consolidation. Since then, though, the tone has shifted. Instead of continuing lower, the market looks like it’s taking a pause.
Over the past few sessions, the ENA price has been hovering around the $0.2000–$0.2100 area. This is the first zone where selling pressure has clearly slowed after the breakdown.
The price isn’t cascading lower anymore, and dips into this range are getting absorbed more quickly. That indicates sellers are losing urgency, even if buyers aren’t stepping in aggressively yet.
That matters. After slicing through multiple support levels during the selloff, this is the first place where the market seems willing to stabilize instead of accelerate lower. It doesn’t mean a bottom is in, but it does suggest the market is digesting the move rather than reacting emotionally.
On-chain data supports that view. ENA’s market cap stopped falling sharply once the price reached this area and has moved mostly sideways since. Capital isn’t rushing out anymore, even if fresh inflows haven’t arrived.
What’s next for Ethena?
The main challenge remains overhead resistance. The ENA price continues to stall near $0.2160 on the daily chart.
Every bounce so far has failed before reclaiming that level, keeping the broader trend intact. Until that zone is cleared and held, upside moves are better seen as relief bounces, not true reversals.
For now, ENA remains in wait-and-see mode. The damage has already been done, and what the market needs next isn’t hope, but confirmation.
If You Love Bitcoin and Own Silver, You Need to See This ChartLet me introduce you to "The Most Extreme BTC/Silver RSI Since 2011"
Silver is on course for its strongest annual performance since 1979, supported by a broad rally across precious metals. This uptrend has been fuelled by sustained central bank buying and steady inflows into exchange-traded funds, which have lifted overall investor sentiment. Silver has also gained from robust industrial demand, reinforcing its price momentum. The metal remains vital to global supply chains, with wide applications in electronics, solar power systems and specialised medical coatings.
The BTC / Silver ratio gives us one of the clearest lenses to understand when capital is shifting between hard assets and digital assets.
A few months ago:
1 #Bitcoin ≈ 3,500 oz of Silver
Today:
1 Bitcoin ≈ 1,100 oz of #Silver
That’s a ~68% decline in the #BTC/Silver ratio since May 2025.
In the 2017 bull market, Bitcoin reached ~1,100 oz of Silver.
That was the first time in history.
What was resistance back then is now potential structural support
Markets don’t forget these levels.
On the weekly BTC/Silver chart:
RSI ≈ 20
This is the lowest RSI reading since Bitcoin’s creation (2011)
Historically:
RSI has reached above 80 multiple times
But it has never been this oversold versus Silver
Let’s be precise:
❌ There is no 100% confirmation that Bitcoin has bottomed versus Silver
❌ This is not a “sell everything, buy Bitcoin now” call
But…
✅ If you are a Bitcoin believer
✅ And you accumulated Silver over the past few years
✅ This is one of the best risk-reward zones to start rotating profits from Silver into Bitcoin
Should You Sell 100% of Your Silver Right Now?
Absolutely not.
You don’t exit positions emotionally — you exit systematically.
👉 You can wait for TA / FA confirmations
👉 You can scale in instead of going all-in
👉 You can let the market confirm the rotation
This is important — because timing matters.
If you look carefully at the BTC/Silver chart:
🔺 Best time to convert Bitcoin → Silver
Level 3️⃣
🔻 Best time to convert Silver → Bitcoin
Levels 1️⃣ and 2️⃣
These zones historically rewarded early rotation
👉 What If Silver Continues to Outperform?
If Silver keeps outperforming Bitcoin, the chart already shows where profit-taking zones are:
"700 oz Silver per CRYPTOCAP:BTC → very realistic in 2026"
370 oz Silver NASDAQ:XAG per BTC → not a primary target right now
The 370 oz level would likely require:
Bitcoin falling below ~$80,000
A broader risk-off or crypto-specific drawdown
Not impossible — just lower probability for now.
This is not about choosing sides:
❌ Silver vs Bitcoin
❌ Old money vs new money
This is about capital rotation.
Big Money Enters 👉 Takes profit 👉 Rotates 👉 Repeats
If you love Bitcoin and have already made good money with Silver,
This is one of the "FIRST " cleanest transition zones we’ve seen in years — with discipline, patience, and confirmation from TA.

JOE Breakout Above Descending Trendline, Retest in ProgressJOE was trending under a strong descending trendline that capped price for an extended period. Price has now broken above this descending resistance, marking a potential shift in short-term structure.
After the breakout, JOE is currently retesting the broken trendline, which is acting as a key decision zone. This behavior is typical after a structure break, where the market checks whether former resistance can flip into support.
If price manages to hold above the retest zone and shows acceptance, continuation toward the higher resistance areas around zero point zero six eight and zero point zero seven seven becomes likely. This would confirm the breakout and strengthen the bullish continuation scenario.
On the downside, failure to hold above the broken trendline would signal a failed breakout. In that case, price could rotate back toward the lower demand zone around zero point zero five four, keeping the broader corrective structure active.
This setup is driven by descending trendline breakout mechanics, support resistance flip behavior, and post-breakout retest dynamics. Confirmation at this retest level is essential before expecting follow-through.

C98 Approaching Falling Wedge Resolution ZoneC98 has been trading inside a falling wedge after a prolonged bearish phase. Both trendlines are sloping downward and converging, indicating compression and gradual loss of bearish momentum rather than strong continuation.
Price is currently holding near the lower boundary of the wedge while printing tighter ranges. This area acts as a critical decision zone. If buyers manage to defend this base and push price above the upper wedge resistance, a relief move toward the mid resistance region around zero point zero two five becomes likely, followed by a larger recovery toward the higher resistance zone near zero point zero four five.
On the bearish side, failure to hold the wedge base would invalidate the reversal structure. In that case, price may extend lower toward deeper demand zones before any meaningful recovery attempt.
This setup is driven by falling wedge compression, momentum exhaustion, and structure tightening near long-term lows. Confirmation through breakout and acceptance is required before expecting sustained upside continuation.

BTCUSD 4H: Range Compression Above Demand — Breakout to 93K/100KBTC is coming off a strong sell-off from the 100K area and has transitioned into a sideways accumulation/distribution range. Price is currently compressing near the mid-range, which usually precedes an expansion move (either up or down).
Key Zones & Levels (from the chart)
Major Resistance / Targets
- 93,198: Key horizontal resistance (range ceiling / supply).
- 98,976 – 100,005: Macro resistance cluster (major sell zone / psychological 100K).
Local Resistance
- 90,000: Psychological + mid-range friction.
Support / Demand
~86.5K–87.5K (upper green zone): Local demand + current “decision area”.
- 85,000: Psychological support.
- 83,437: Breakdown trigger / next reaction level.
- 80,243 (lower green zone area): Major demand (high-probability bounce zone).
- 76,568: If 80K fails, next support.
- 72,060: Deeper downside target (capitulation/flush area).
Market Structure Read
The market is range-bound after a large impulsive drop.
Current price action suggests indecision, with liquidity likely building on both sides:
- Above: stops & breakout buyers above 90K / 93.2K
- Below: stops & forced selling below 85K / 83.4K / 80.2K
Momentum & Volume (what your indicators imply)
- Stoch RSI is choppy and mean-reverting → confirms a sideways market (not trending).
- Net Volume is flat/neutral → no strong directional conviction yet.
➡️ In this environment, breakout confirmation matters more than guessing direction.
Primary Scenarios
✅ Bullish Scenario (Breakout Plan)
- Hold above the upper demand (~86.5K–87.5K) and reclaim momentum.
- Break and sustain above 90K.
- Confirmation: 4H close above 93,198, ideally followed by a retest holding as support.
Targets
- TP1: 93,198
- TP2: 98,976
- TP3: 100,005
❌ Bearish Scenario (Breakdown Plan)
- Lose the upper green demand and fail to reclaim it (retest rejection).
- Break below 85,000 → increases probability of continuation.
- Confirmation: 4H close below 83,437.
Targets
- TP1: 83,437
- TP2: 80,243
- If 80K fails: 76,568 → 72,060
Execution
Best approach: Wait for a 4H close outside the range, then trade the retest.
Invalidation logic:
- Long idea invalid if price closes back below the reclaimed breakout level (fakeout).
- Short idea invalid if breakdown is reclaimed quickly and holds (bear trap).
Risk note: This is a compression zone → spikes are common. Keep size reasonable and avoid chasing candles.
Not financial advice. Levels are for planning and risk management.

Bitcoin at Year-End: Quiet Before the BreakoutIn the year-end market environment, BTCUSDT is moving in a classic “compression before expansion” manner. After the major options expiry event passed, technical pressure that had been holding price down has eased noticeably. While liquidity remains thin due to the holiday period, this condition often creates the perfect setup for fast and decisive breakouts once the market begins to choose a direction.
On the 4H timeframe, price structure is forming a clear compression triangle. Price is being squeezed between a descending trendline above and an ascending trendline below, showing that buying and selling pressure are both building. As price moves closer to the apex of the triangle, the probability of a breakout increases, and the side that successfully defends its base will gain the advantage.
The 87,000 level is acting as a key support zone. Each pullback into this area has been met with solid buying interest, indicating that buyers are quietly absorbing sell pressure. This is a familiar sign of bullish accumulation rather than distribution.
With the current structure, the most reasonable scenario is continued tight consolidation followed by a breakout above the upper boundary of the triangle. If a breakout occurs and price holds above the broken level, the first upside target lies near 90,400 — a zone that aligns with both technical resistance and an overhead supply area. Conversely, only a clear 4H close below 87,000 would invalidate this bullish scenario.
In summary, BTCUSDT is in a state of “calm before the move”. As long as the 87,000 base remains intact, the broader bias stays bullish, with expectations for a clean breakout toward the 90,400 area in the short term.

AFTER CYCLE BTC WILL BREAK UP 100k+ - NEW BULLRUN ON WAYBased on the trend analysis around the $92K–$93K level, this zone could mark the beginning of a new bull run. If this target is reached and held, there is a high probability that BTC will enter a new upward cycle, potentially moving beyond $100K. The coming days are crucial for confirming the overall trend direction.
Before this, there could be manipulation trends, with a fake downtrend wick, but the Data shows that we are since the 80k+ still in the uptrend and cycle can get confirmed any time.

BANK:USDT ON WAY TO NEW CYCLE $0,10There is an interesting volume structure running on this coin, which can affect this coin to break new trend. BANK: USDT is one of the interesting coins of the moment for a break.

ETHUSD Descending Triangle Breakdown SetupThis 2H ETH/USD chart highlights a descending triangle structure forming after a prior impulse move. Price is consistently making lower highs beneath a descending trendline, while holding a horizontal support zone around 2,890–2,900, signaling growing bearish pressure.
A clear CHoCH (Change of Character) confirms the shift in market structure from bullish to bearish. Price is currently trading below key dynamic resistance and within a marked Fair Value Gap (FVG), suggesting a potential rejection area before continuation lower.
The projected downside targets are:
1st Target: ~2,815 (liquidity sweep / prior support)
2nd Target: ~2,748 (major demand zone)
Overall, the chart presents a classic bearish continuation setup, favoring downside expansion if support breaks with confirmation.

Bitcoin a sinking ship...Why would I say such a thing..?!
Because early long term holders and whales are aggressively selling down their holdings.
Like Rats fleeing a sinking ship.
Creating unprecedented supply pressure.
While on-chain activity has stagnated since 2017 and BTC is underperforming less volatile risk assets like Tech stocks.
So in summation.
Active wallets on the network is steadily declining.
As there is no real usage as peer-to-peer cash.
LTH holder's are no longer buying the dips (they may step in at far lower prices ... i.e. sub $50k)
Fading demand. Search metrics have fallen off a cliff.
Poor Risk-Adjusted performance.
Higher Volatility and negligible outperformance (if any)
EASY GAINS are no longer available.
Market Timing is essential for outperformance.
#HODL narrative is dead.
BShort

BTC Update: Holiday Chop can be Boring BTC Update: There hasn’t been a ton of movement since my last update, but that’s not a bad thing. Bitcoin continues to hold up well here, with price stabilizing above recent lows and maintaining acceptance in this mid-range area. The selling pressure that drove the prior move down has clearly cooled, and for now, downside momentum looks muted rather than accelerating.
Structurally, BTC still appears to be working through a basing process. Price action remains choppy and overlapping, which is typical during bottoming phases, especially after a sharp corrective leg. What stands out is that repeated pushes lower are being absorbed, and sellers haven’t been able to force a decisive breakdown. That’s a constructive sign, even if it doesn’t immediately translate into upside expansion.
The ~$90K area remains an important pivot. While BTC hasn’t yet reclaimed higher resistance levels, it’s also not losing ground aggressively. Holding this zone keeps the market in a stabilization regime rather than a continuation-to-the-downside scenario. As long as price stays above recent lows, the probability of an immediate flush continues to decrease.
That said, I’m still keeping an eye on the ~$70K region. It remains the major higher timeframe support and the level that would represent a full reset if the market were to see another volatility spike. While the odds of a clean flush to that level appear lower than before, it’s still the key downside reference point if conditions deteriorate.
For now, the bigger picture remains constructive. BTC is holding up, volatility is compressing, and the market looks more like it’s building a base than preparing for another impulsive leg down. Until structure breaks or improves decisively, patience is key. This is still a wait-for-confirmation environment, but so far, price action is doing what it needs to do.

VET Retesting Falling Wedge Breakout ZoneVeChain previously traded inside a falling wedge after a prolonged bearish move. That structure has now broken to the upside, and price is currently retesting the former wedge resistance, which is acting as a key decision zone.
This retest is critical for short-term structure. If VET manages to hold above this reclaimed level and shows acceptance, continuation toward the next resistance zone around zero point zero one two two becomes likely, followed by a broader recovery toward the upper resistance region near zero point zero one eight.
On the bearish side, failure to hold this retest area would signal a failed breakout. In that case, price could rotate back toward the lower demand zone below zero point zero nine four, keeping the broader bearish structure active.
This setup is driven by falling wedge breakout mechanics, support resistance flip behavior, and post-breakout retest dynamics. Confirmation at this level will define the next directional move.

Unless BTC Breaks Above 200/350 Daily SMA ...Still BearishTrading Fam,
Crypto traders must have been naughty this year. Even our expected Santa Rally fell short of expectations. In other words, even this crypto grinch expected more from Santa’s reindeer. As stated in previous posts, I was expecting a bounce to at least 100k. But so far, that hasn’t happened. BTC remains in the bear flag and could not even muster enough energy to touch the top of the channel. Unless Santa had mechanical issues with his sleigh and is running behind, it looks like crypto traders have received coal in their stockings this year. So, here’s what I am seeing for price action moving into next year.
The only way we can count our Wyckoff Market Cycle as complete is if we happen to rally up above the top of our bear flag channel and break above the 350 SMA (orange) with confirmation. However, even that leaves some doubt. I’d prefer to see us break above that 200 SMA (red) and confirm to be more sure, otherwise, any rally may simply become a big old bull trap.
The remaining scenarios I see are noted: we either break down from the bear flag immediately, or we touch the top of the flag first, or that descending red trendline before continuation down. At this point, these are the most likely scenarios.
That red trendline on the underside of price, which is currently acting as support, comes all the way from the previous cycle highs in April of 2021 to Nov. of 2021 and is continued out to the present day. If this is broken, further selling should be expected. At that point, I am not even sure my Target #1 would hold strong.
Meanwhile, gold, silver, and basically all precious metals are flying! Just don’t let Peter Schiff know you’ve noticed.
✌️Stew

ETHUSD – H4 Analysis ETHUSD – H4 Analysis (based on My chart)
Market Structure
Price is recovering from a strong demand zone (yellow).
Currently trading below major resistance, inside a corrective structure.
Ichimoku cloud acting as resistance, but short-term bounce continuation is visible.
This looks like a pullback-buy → resistance sell type structure.
📈 Buy (Bounce / Recovery) Setup
Buy Zone: 2880 – 2920
🎯 Target Points (Upside)
Target 1: 3050
Target 2: 3240 (major supply / resistance zone)
❌ Invalidation
H4 close below 2800 → bullish setup invalid.
📉 Alternative Sell (from Resistance)
If price reaches resistance and shows rejection:
Sell Zone: 3220 – 3260
Downside Target: 3000 → 2920
📌 Clean Signal Summary
Pair: ETHUSD
Timeframe: H4
Bias: Buy (recovery move)
Primary Targets: 3050 → 3240

Why Most Backtests Fail in Live MarketsBacktests often look convincing because they operate in a world that does not exist in live trading. Historical data is clean, fills are perfect, and execution is assumed to be instant. In reality, markets are driven by liquidity, friction, and uncertainty, none of which show up properly in hindsight testing.
The first failure point is liquidity. Backtests assume you can enter and exit at any price shown on the chart. Live markets do not work that way. At key levels, price accelerates, spreads widen, and partial fills occur. What looks like a precise entry in a backtest often becomes slippage or a missed fill in real time, especially during news, session opens, or liquidity sweeps.
The second issue is spread and fees. Many strategies survive on thin margins. A few ticks of spread expansion or commissions per trade are enough to flip a positive expectancy into a losing one. Backtests that ignore realistic costs create false confidence and encourage overtrading systems that cannot survive friction.
Execution timing is the third blind spot. In hindsight, confirmation is obvious. Live, confirmation unfolds candle by candle. Strategies that rely on exact closes, perfect retests, or instant reactions break down when hesitation, latency, or human execution enters the process.
To stress-test ideas realistically, remove precision. Add slippage assumptions, widen stops slightly, delay entries by one candle, and test during different market regimes. If a strategy only works under ideal conditions, it is not robust. Robust strategies survive imperfection.
Backtests are not useless, but they are incomplete. They should test logic, not profitability. Live viability comes from understanding how liquidity, cost, and execution pressure reshape every idea once real money is involved.

EURUSD – H2 Analysis .......EURUSD – H2 Analysis (based on My chart)
Market Structure
Overall bullish trend.
Price is at upper resistance / supply zone (yellow area).
Rejection + long upper wicks → pullback / correction likely.
Trendline + Ichimoku cloud below → correction, not full reversal.
📉 Sell (Correction) Setup
Sell Zone: 1.1755 – 1.1785
🎯 Target Points
Target 1: 1.1680
Target 2: 1.1560 (strong demand & trendline support)
❌ Invalidation
H2 close above 1.1800 → sell setup invalid.
📌 Clean Signal Summary
Pair: EURUSD
Timeframe: H2
Bias: Sell (pullback)
Targets: 1.1680 → 1.1560
After these targets, we can look for a fresh BUY continuation from demand

EUR/USD chart (2H timeframe)...
EUR/USD chart (2H timeframe):
Bias: Bullish (price holding above rising trendline)
Targets:
Target 1: 1.1850 – 1.1860 (near first marked resistance)
Target 2: 1.1950 – 1.1980 (upper resistance / next zone)
Invalidation / Safety:
If price closes below the trendline, bullish view becomes weak.
Conservative SL area: below 1.1720
This is a technical target, not financial advice. Trade with proper risk management.

MNT Pullback to Key Support – Bounce Incoming?MNT has seen a significant drop over the past few days, but it's now entering a major support zone where price previously found strong demand. This could present a high-reward opportunity for traders watching for a potential reversal or bounce from this level.
📌 Entry Zone: $1.053 – $1.060
🎯 Take Profits: $1.35, $1.54
⛔ Stop Loss: $1.03
The entry area aligns with a strong demand zone, and if price reacts positively here, there's room for a technical bounce toward the next resistance levels. Look for confirmation via price action – bullish candles, volume spikes, or divergence setups could all strengthen the case.
🧠 Trade Smart: Always use proper risk management. This is not financial advice, just an idea based on chart structure and support/resistance zones. Trade at your own discretion.

BTCUSD trade idea for buysBTC/USD Technical Analysis: Potential to Reach $90K if Current Technicals Hold
Current Market Overview: Bitcoin (BTC) is showing signs of bullish momentum, respecting the current technical indicators. The price is positioned well within key support and resistance zones, with significant upward potential if the prevailing trends continue.
Key Levels to Watch:
Support Level: A strong support around continues to hold, with price bouncing off this level multiple times. A confirmed break below this level could signal a shift in market sentiment.
Resistance Level: The key resistance lies near $90K, a level that could be tested if the current technicals remain intact. Watch for a breakout or rejection at this level.
Indicators to Watch:
RSI: Currently, the Relative Strength Index (RSI) is , indicating . If RSI continues to move higher, it may confirm continued bullish momentum towards $90K.
EMA/MA: The 50-period and 200-period Moving Averages are showing alignment, suggesting the market's trend direction.
Volume: Strong volume support at key levels may suggest a sustainable move upward, with increasing volume acting as confirmation of the rally.
Scenario 1 - Bullish Continuation: If BTC continues respecting these technical levels, we could see a breakout towards $90K, driven by strong bullish sentiment and market momentum. Watch for a clean break above key resistance levels for confirmation.
Scenario 2 - Bearish Reversal: If technicals fail to hold, watch for a potential breakdown below support levels. This could shift the market outlook and present new trading opportunities to reassess.
