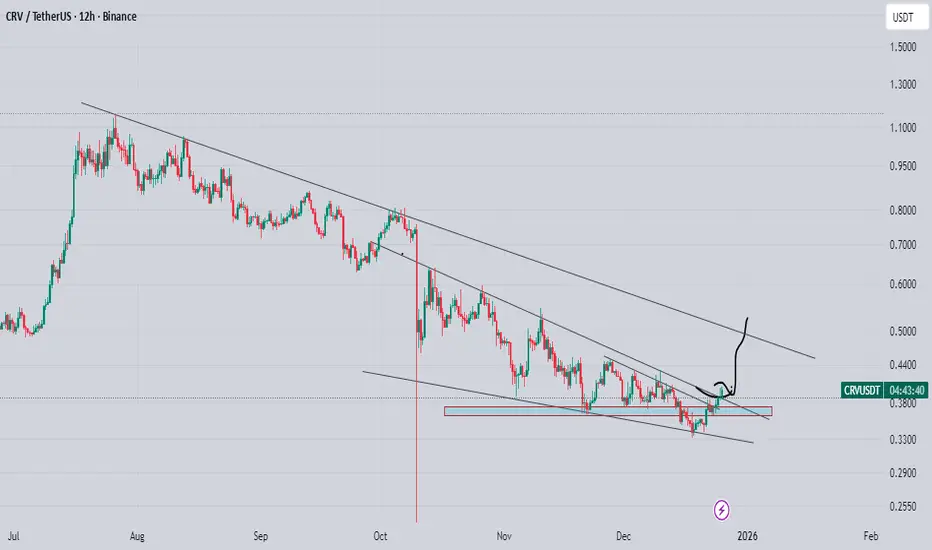
crv breaking falling wedge finally breaking long falling wedge consolidation, upon successful breakout expecting recovery, expecting move towards major descending trendline
Crypto
XMR keeps failing at 450 resistance, is a major breakdown comingYello Paradisers— how many times can XMRUSDT hit the same wall before it collapses for good? The rejection from the 448 to 450 zone is starting to look like more than just noise.
💎XMRUSDT respected an ascending channel for a while but that structure has now clearly broken. The recent breakdown along with an internal CHoCH signals a shift in short-term momentum. The impulsive rejection has cooled off the buyers and the current consolidation just below the broken channel shows that sellers are gaining control while buyers struggle to hold ground.
💎After the breakdown, price made a corrective attempt but was quickly rejected again around the 0.5 to 0.618 Fibonacci retracement area. This zone has now become a supply region and continues to suppress any bullish attempts. As long as price stays under that structure with no strong bullish displacement the bias remains bearish with a likely push toward lower liquidity zones and key support levels.
💎This view changes only if price closes a strong candle above the 450 resistance. That would reclaim the previous range high, cancel the bearish structure shift and signal renewed bullish strength with potential to target higher liquidity above the current range.
🎖Right now is not the time for emotional moves. Stay calm and stay focused. We are only interested in the cleanest and most high probability setups. That is how you win in this game long-term.
MyCryptoParadise
iFeel the success🌴

IOTA at Decision Point Near Falling Wedge SupportIOTA is forming a clear falling wedge after a prolonged bearish move. Price action shows lower highs and lower lows, but the range is contracting as both trendlines converge, indicating a slowdown in bearish momentum rather than strong continuation.
Price is currently reacting near the lower boundary of the wedge, where selling pressure has started to weaken. This zone represents a critical decision area. If IOTA manages to hold this base and break above the falling wedge resistance, a relief move toward the nearby resistance cluster around zero point zero nine to zero point one zero four becomes possible. Acceptance above that zone would signal the first meaningful short-term structure shift.
On the downside, failure to hold the wedge base would invalidate the reversal structure. In that case, price may continue lower toward deeper demand zones, keeping the broader bearish trend intact.
This setup is driven by falling wedge compression, momentum exhaustion, and support interaction at structural lows. Confirmation through breakout and acceptance is essential before expecting upside continuation.

FARTCOIN – Waiting for Key Support Before ReversalWe're watching FARTCOIN closely as it approaches a major support zone between $0.22 – $0.24. On the higher time frames, this level has held strong in the past, and we're hoping to see a bounce here that could signal the start of a trend reversal. Until then, we remain patient, waiting for cleaner entries and signs of strength before jumping in.
⚙️ Trade Setup
Entry Zone: $0.22 – $0.24
Take Profit Targets: $0.32 and $0.40
Stop Loss: $0.19
If we see bullish confirmation around the support, this could be a good spot long opportunity. The upside targets line up with prior resistance levels that could act as take-profit zones if momentum builds.

EURUSD: Bullish Structure Holds Inside Upward ChannelHello everyone, here is my breakdown of the current EURUSD setup.
Market Analysis
EURUSD has confirmed a bullish structure after breaking out of the previous Downward Channel. This breakout shifted market control to buyers and initiated a steady move higher. Price is now trading within a well-defined Upward Channel, forming higher highs and higher lows, which supports the bullish trend.
Recently, EURUSD pulled back from the Resistance Zone near 1.1800 and found support around the 1.1750–1.1760 area. This zone aligns with the channel support and previous breakout structure, showing strong buyer interest. Current consolidation above support suggests continuation rather than reversal.
My Scenario & Strategy
My primary scenario remains bullish as long as EURUSD holds above the Support Zone around 1.1750. The recent pullback looks corrective within the broader uptrend. I expect price to resume its upward move and push toward the upper boundary of the Upward Channel, 1.1840 - 1.1850 as the next key target.
A clean breakout and acceptance above 1.1800 would confirm trend continuation and open the door for further upside expansion. However, a sustained breakdown below 1.1750 would weaken the bullish setup and could lead to a deeper correction. For now, the structure favors buyers, with support holding and momentum aligned with the prevailing uptrend.
That's the setup I'm tracking. Thank you for your attention, and always manage your risk.

BTCUSDT Holds Support - Retest of 88,900 Resistance LikelyHello traders! Here’s my technical outlook on BTCUSDT (2H) based on the current chart structure. Bitcoin is trading within a broader recovery phase after a prolonged corrective move. Earlier, price formed a base and broke out of a consolidation range, signaling that selling pressure was weakening and buyers were regaining control. Following the breakout, BTC pushed higher but faced resistance near 88,900, where selling pressure emerged and caused a pullback. Price then retraced toward the 87,300 Support Zone, which aligns with the previous breakout area and acts as a key demand level. The reaction from this zone remains constructive, suggesting the pullback is corrective rather than impulsive. Structurally, price continues to respect a rising support line, while attempts to break above resistance are ongoing. My scenario: as long as BTC holds above the 87,300 Support Zone, the bullish recovery remains intact. A strong reaction from support could lead to another push toward the 88,900 Resistance (TP1). A confirmed breakout above this level would open the door for further upside. A breakdown below support would signal a deeper correction. For now, the focus remains on the 87,300 support. Please share this idea with your friends and click Boost 🚀

Bitcoin Price Analysis: Is the 4-Year BTC Cycle Still Alive?* Bitcoin is closing 2025 below expectations, even after ETFs, institutional buying, and a pro-crypto backdrop created ideal conditions for a bull market.
* Bitcoin’s RSI relative to gold has reached levels that historically appeared near major cycle turning points.
* The market looks compressed and tired rather than broken, with price action indicating a decision phase rather than a collapse.
Looking at Bitcoin’s recent price action, it’s clear the market isn’t in panic mode, even though 2025 has been frustrating and confidence feels thin.
Right now, the BTC price is trading around $87,690.28, and while that’s well below earlier highs, the behavior lately doesn’t look like fear-driven selling.
Bitcoin didn’t fall apart in one sharp move. The price rolled over from the highs near $110,000 and spent months grinding lower, slowly wearing traders down.
But recently, that rhythm has changed. Instead of accelerating to the downside, the market has started to pause. It feels more like hesitation than fear. Traders seem to be reassessing after a long stretch of disappointment, rather than rushing for the exits.
The BTC price is trading inside a broad range where buyers have stepped in repeatedly. Every dip into this zone has found demand, even if the rebounds have been weak and short-lived.
That matters because earlier in the year, Bitcoin sliced through multiple support levels without much resistance. This is one of the first areas where selling pressure has clearly slowed.
Moves lower are getting absorbed faster. Sellers don’t look as aggressive as they did during the spring and autumn selloffs, while buyers remain cautious but present. It’s not confidence yet, but it’s also not capitulation.
On-chain data backs that up. Bitcoin’s market cap has stopped falling sharply and has started to level out instead. Capital isn’t rushing out of the network any longer. It looks more like money is sitting on the sidelines, waiting for clearer signals.
Network activity tells a similar story. Active addresses and transaction counts have cooled, but they are still well above levels seen during true bear market lows. Usage hasn’t collapsed. It has stabilized.
So what’s next for Bitcoin?
On lower timeframes, the BTC price continues to run into resistance, with each bounce losing momentum before it can turn into a trend. Buyers are showing up near support, but conviction is still missing.
That leaves Bitcoin in a wait-and-see phase. Selling pressure has eased, but the market hasn’t shown enough strength yet to confirm a clean move higher.
Whether the BTC price can break out of this range or slip back into another stretch of sideways chop will likely shape the next phase of this cycle.

BTC/USDT | More Downside Ahead? Let's Discuss in the Comments!Bitcoin climbed back to $90,500, tapped resistance, and is now trading around $87,800. This bounce looks more like a classic liquidity grab than a trend reversal. I’m still leaning bearish. As long as $90,000 doesn’t flip into solid support, we’re likely heading lower. My next downside targets: $85,000 → $82,700 → $80,500
Nothing’s changed, structure is still weak, and the pressure’s on the bulls.
Please support me with your likes and comments to motivate me to share more analysis with you and share your opinion about the possible trend of this chart with me !
Best Regards , Arman Shaban

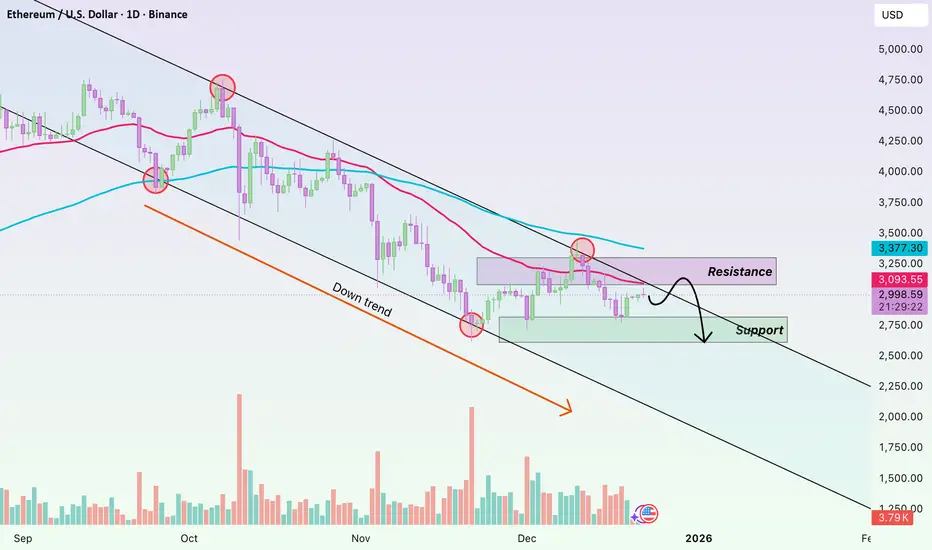
ETHUSD – Technical Rebound Within a DowntrendHello, this is Domic.
Looking at the ETH daily chart, the current picture is quite clear: the primary trend remains bearish, and the recent upside move should only be viewed as a technical rebound.
Price is still trading below both EMA34 and EMA89, with EMA34 having crossed below EMA89 and both moving averages sloping downward. This is a textbook setup of a medium-term downtrend, not a sideways phase or a basing process. As long as this structure holds, there is no solid basis to talk about a trend reversal.
On the upside, EMA34 around the 3,090 level is acting as a dynamic resistance . Price has repeatedly rebounded into this zone only to be pushed back down, indicating that sellers are clearly defending this area. The higher EMA89 further reinforces the idea that ETH still lacks the strength needed to shift the broader trend.
The quality of the current rebound also does not favor the bulls. Rebound candles are small and choppy, with lower highs forming, while volume shows no sign of strong capital inflows. In addition, this week falls into a holiday period, leading to reduced market liquidity, which makes price movements more sluggish and lacking breakout momentum.
Wishing everyone successful trading!
BTCUSDT Long: Demand at 88K Could Fuel a Move to $92,700Hello traders! Here’s a clear technical breakdown of BTCUSDT based on the current chart structure. Bitcoin recently completed a prolonged move lower within a well-defined descending channel, confirming strong bearish pressure during that phase. This bearish structure remained intact until price reached a key pivot low, where selling momentum clearly weakened. After the initial impulsive move higher, BTC tested the 92,700 Supply Zone, where temporary rejection occurred. This reaction resulted in several pullbacks toward the 88,000 Demand Zone, which aligns with previous resistance turned support and the lower boundary of the ascending channel. Each pullback into this demand area was met with buying interest, indicating absorption rather than distribution.
Currently, price is stabilizing above the 88,000 Demand Zone, and the pullbacks remain corrective in nature. Multiple minor breakouts along the channel support further confirm that buyers continue to defend structure. The market is consolidating while maintaining bullish alignment.
My scenario: as long as BTCUSDT holds above the 88,000 Demand Zone, the bullish structure remains intact. A strong reaction from this area could lead to another attempt toward the 92,700 Supply / Resistance Zone. A confirmed breakout and acceptance above 92,700 would open the door for further upside continuation within the ascending channel. Only a decisive breakdown below demand would invalidate the bullish scenario. For now, the bias remains bullish, with buyers in control while price respects the ascending channel. Manage your risk!

EUR/USD _ 2H Chart Pattern...EUR/USD _ 2H Chart Pattern
Buy bias: Bullish (uptrend holding above trendline)
Main Target: 1.1900
Partial Targets:
TP1: 1.1830
TP2: 1.1870
Support / Invalidation:
Key support: 1.1750–1.1760
Trendline break below: bias weakens
Price is respecting the ascending trendline and structure, so continuation toward 1.19 is valid unless the trendline breaks.

NZDUSD – H4 Analysis....NZDUSD – H4 Analysis (Based on My chart)
Market Structure
Overall bullish trend on H4.
Price has reached a strong resistance / supply zone (yellow area).
Rejection visible → corrective pullback expected toward trendline & support.
Ichimoku cloud below price → pullback, not full reversal (for now).
📉 Sell (Correction) Setup
Sell Zone: 0.5830 – 0.5850
🎯 Target Points
Target 1: 0.5740
Target 2: 0.5620 (extended correction target)
❌ Invalidation
A strong H4 close above 0.5860 will invalidate the sell correction idea.
📌 Summary (Signal Style)
Pair: NZDUSD
TF: H4
Bias: Sell (Pullback / correction)
Targets: 0.5740 → 0.5620

ETHUSDT – 4H Chart Update. ETHUSDT – 4H Chart Update.
Lower highs, descending trendline still active
ETH rejected from the trendline near 3,350–3,400
Price below cloud → bearish / consolidation phase
Holding around 2,930
Immediate Support: 2,880 – 2,900
Major Support: 2,700 – 2,750
Resistance: 3,050 – 3,120
Major Resistance: 3,350 – 3,400
Above 3,120 → short-term bullish relief toward 3,300+
Below 2,880 → risk of move toward 2,750
Until the breakout, range & patience are best
⚠️ Trend is still weak — trade only with confirmation & strict risk management.

AUDUSD – H4 Analysis ....AUDUSD – H4 Analysis (based on My chart)
Market Structure
Clear uptrend (higher highs & higher lows).
Price is above the trendline and above Ichimoku cloud → bullish continuation.
Previous resistance zone has flipped into support (yellow zone).
📈 Buy Setup
Buy Zone: 0.6680 – 0.6710
🎯 Target Points
Target 1: 0.6780
Target 2: 0.6850 (extended / swing target)
❌ Invalidation / Stop Logic
A strong H4 close below 0.6640 will weaken this bullish setup.
📌 Summary (Clean Signal Style)
Pair: AUDUSD
Timeframe: H4
Bias: BUY
Trend: Bullish continuation
Targets: 0.6780 → 0.6850

GBP/JPY 3H chart pattern...GBP/JPY 3H chart pattern
Buy bias while price stays above the rising trendline
Primary target: 215.80 – 216.00 (marked target point on the chart)
Intermediate resistance: 212.50 – 213.00
Support zone: 209.80 – 210.20
Invalidation: A clear break below 209.50 would weaken the bullish setup
Summary: Trend is bullish on the 3H chart. As long as price holds above trendline support, upside continuation toward 216.00 is expected.

XAUUSD: Rejection from 4,420 Resistance - Pullback Toward 4,350Hello everyone, here is my breakdown of the current XAUUSD setup.
Market Analysis
XAUUSD continues to trade within a broader bullish structure, but the current price action signals a short-term corrective phase. After forming a strong upward impulse, gold established a well-defined upward channel, confirming buyer control. Price then broke above the previous consolidation range, which marked a continuation of bullish momentum.
Currently, XAUUSD pushed higher and reached the Resistance Zone around 4,410–4,420, a level that has historically acted as a strong supply area. At this zone, price showed clear rejection, with sellers stepping in aggressively and limiting further upside. This reaction suggests that supply is currently outweighing demand at these highs. As a result, price is now pulling back from resistance and moving toward the Support Zone around 4,350, which aligns with the previous breakout area and the lower boundary of the upward channel. This zone represents a key demand area where buyers have previously defended the trend. The recent breakout above this level followed by a retest further strengthens its importance.
My Scenario & Strategy
My scenario remains short-term bearish as long as XAUUSD stays below the 4,410–4,420 Resistance Zone and continues to show rejection from this area. I expect price to retrace toward the 4,350 Support Zone, where the next reaction will be crucial for determining continuation or deeper correction.
Therefore, A clean breakdown below the 4,350 Support Zone would confirm a deeper corrective move within the structure and could open the path toward lower demand levels along the channel support. However, if price reaches support and shows a strong bullish reaction, the broader bullish structure remains intact, and buyers may attempt another push toward the resistance highs. For now, the focus is on the corrective pullback, with 4,350 acting as the key level to watch.
That's the setup I'm tracking. Thank you for your attention, and always manage your risk.

XRP/USDT – H4 Analysis....XRP/USDT – H4 Analysis (Based on my chart)
Market Structure
Price has broken the descending trendline.
Strong support zone held near the bottom (yellow demand area).
Price is now above the trendline and pushing into the Ichimoku cloud → bullish reversal confirmed.
📈 Buy Scenario
Buy Zone: 1.85 – 1.90
🎯 Target Points
Target 1: 2.10
Target 2: 2.50
❌ Invalidation
A strong H4 close below 1.80 will invalidate this bullish setup.
📌 Summary
Bias: BUY
Trend: Bearish → Bullish reversal
Expectation: Price to continue upward toward 2.10 first, then 2.50 (as marked on my chart)

EUR/JPY 2H chart pattern...EUR/JPY 2H chart pattern
Buy / Upside Target: 185.30 – 185.50
Near Resistance: 184.80
Support Zone: 183.40 – 183.60
Trend: Bullish (price is holding above the rising trendline)
Explanation (simple):
Price is respecting the uptrend and bouncing from support. If it holds above 183.50, the next move is likely toward 185.30–185.50 (the marked target point).

The Christmas Effect: Why Markets Slow Down Before They MoveEvery December, traders ask the same question:
Will we get a Christmas rally?
But the real lesson Christmas teaches the market isn’t about rallies.
It’s about behavior.
1️⃣ Christmas Is a Liquidity Event 🎄
As the year comes to an end:
- institutions reduce exposure
- desks thin out
- volume drops
- participation becomes selective
This doesn’t make markets weak.
It makes them quiet .
And quiet markets are where structure forms.
2️⃣ Low Activity Doesn’t Mean No Opportunity
During Christmas weeks, price often:
- compresses
- ranges tightly
- respects key levels
- moves slowly
Many traders mistake this for boredom.
Professionals see it differently.
Low-volatility environments often act like wrapping paper...
they hide the move that comes after the holidays.
3️⃣ Why Breakouts After Christmas Matter More
When markets return to full participation in January, two things happen:
- liquidity comes back
- intent becomes clear
That’s why post-Christmas breakouts tend to be:
- cleaner
- more directional
- better sustained
The move doesn’t start with fireworks.
It starts with patience.
4️⃣ Christmas Rewards the Prepared Trader
While most traders look for action, experienced ones:
- mark levels
- define scenarios
- reduce overtrading
- protect capital
Christmas is not about forcing trades.
It’s about preparing for the next chapter.
Final Thought 🎄
The market doesn’t move because it’s Christmas.
It moves because participants return.
And the traders who respect the quiet season
are usually the ones best positioned when the noise comes back.
So here’s the question:
Are you trying to trade Christmas… or preparing for what comes after it?
⚠️ Disclaimer: This is not financial advice. Always do your own research and manage risk properly.
📚 Stick to your trading plan regarding entries, risk, and management.
Good luck! 🍀
All Strategies Are Good; If Managed Properly!
~Richard Nasr

EURUSD Fake Breakout Signals Pullback to 1.1700 SupportHello traders! Here’s my technical outlook on EURUSD (4H) based on the current chart structure. EURUSD is trading within a broader bullish recovery after completing a prolonged corrective phase. Earlier, price broke above a descending resistance line, which marked a clear shift in market structure and signaled that sellers were losing control. This breakout initiated a steady bullish move, supported by a rising support line, confirming higher lows and improving momentum. After the breakout, EURUSD continued to push higher and reached the resistance level around 1.1750, where selling pressure emerged. Price briefly spiked above this level, forming a fake breakout, which indicates weak acceptance at higher prices and potential buyer exhaustion. Following this rejection, the market pulled back toward the previous buyer zone, which now acts as a key support level around 1.1700. This zone aligns with the former breakout area and represents an important demand level. Currently, price is consolidating above support, showing hesitation near the buyer zone, and the reaction here will determine the next short-term direction. A corrective pullback into the support zone remains healthy within the broader bullish structure as long as buyers continue to defend this level. My primary scenario is a short-term correction toward the 1.1700 support level (TP1), followed by a potential bullish reaction from this zone. As long as EURUSD holds above this support, the overall structure remains constructive, and buyers may attempt another move toward the 1.1750 resistance and potentially higher. However, a clear breakdown and acceptance below the buyer zone would weaken the bullish setup and open the door for a deeper retracement toward lower support levels. For now, the focus remains on the 1.1700 area, as this level will define whether the market resumes its upward move or extends the correction. Please share this idea with your friends and click Boost 🚀

BTCUSDT – Holiday Range Bounce (Low Volume, Lower Expectations)A) Market Summary
BTC is trading around 87.2k during the European morning, once again chilling in the 85–90k “gamma prison” after yesterday’s data delivered exactly… nothing.
Most global markets are on holiday mode (or running half-days), meaning:
• thinner liquidity
• more algos
• fewer real humans
The only US data point today is Initial Jobless Claims at 14:30 CET — not top-tier macro, but in a thin market it can still create ugly wicks.
Conclusion: this is a slow, boring, range day — perfect for one clean trade, terrible for overtrading.
⸻
B) Trade Decision
✅ Intraday trade available
But only as a low-frequency, holiday mean-reversion setup with reduced risk.
No scalping frenzy. One shot. If it doesn’t trigger — fine.
⸻
C) Intraday Setup (BTCUSDT Perps)
• Direction: Long
• Entry (limit): 85,600
• Stop-loss: 84,900
(Below today’s sweep low + key 5M/15M swing)
• Take-profit: 87,800
• R:R: ~3 : 1
Time Rules (holiday discipline):
• Limit valid until 14:00 CET
• If filled, position must be closed or SL moved to BE by 14:20 CET
• No exposure into 14:30 CET Jobless Claims
⸻
D) Trade Logic (Why This Makes Sense on a Boring Day)
• Macro context:
Holiday trading = lower volume, higher algo participation, and more exaggerated wicks.
That favors a single pre-event range trade, not multiple scalps.
Jobless Claims are medium-impact, but in thin liquidity they can still spike price hard.
• Market structure & liquidity:
On 4H / 1H, BTC continues to oscillate cleanly inside the 85–90k range, with repeated failures at 90k and consistent reactions from 85–86k.
The 85.6k entry sits slightly below the middle of this support zone — exactly where buyers have already stepped in twice.
• Gamma & options context:
From recent sessions, 85k acts as a gamma / options support area, reinforcing the idea that quick dips below 86k tend to get pulled back toward 87–88k rather than cascade lower.
• Derivatives & positioning:
BTC open interest remains elevated, but there have been no major OI shocks in the last 24h.
After recent liquidations, leverage is somewhat cleaner — reducing the probability of an immediate waterfall through 85k.
• Liquidation dynamics:
Liquidation heatmaps show long-liq clusters around 85–86k, with short-liq clusters above 90k.
This setup aims to catch a liquidity sweep of weak longs, followed by a move back toward mid-range.
• Order book (confirmation only):
Before entry, Binance/Bybit should still show layered bids at 85.4–85.8k, with relatively light asks up to 87.5–88k.
That structure supports absorption of a market-sell flush and a bounce.
⸻
E) Invalidation Rules (When to Walk Away)
Price-based
• If a 15M candle closes below 84,900, the idea is invalid.
Support failed, gamma defense is gone — respect the stop.
• If BTC rallies directly above 88.8–89k without dipping to 85.6k, cancel the limit.
Context flips to high-range trading, not a bottom sweep.
Time-based
• Auto-cancel the limit at 14:00 CET.
• If in the trade and price can’t reach 87.2–87.4k by 14:20 CET, close manually.
No holding even small PnL through data.
Macro-based
• Any unexpected Fed / geopolitical headline before 14:30 CET with strong DXY or index movement
→ don’t enter; if already in, reduce risk immediately (partial or BE).
Order-book-based
• Do not take the trade if bids disappear near 85.6k and large static ask walls build between 86–87k — that directly contradicts the bounce thesis.
• Exit immediately if, after entry, you see aggressive market sells slicing through 85k on thin bids with no absorption.
That’s a real breakdown, not a sweep.
⸻
Final Note
This is a holiday trade:
• low expectations
• low frequency
• clean execution
If it works — great.
If it doesn’t trigger — even better.
Preserving capital on boring days is a win.

NIGHTUSDT – Buying the Dip in a Fresh Listing?Market Context
NIGHT is the token of Midnight Network — a privacy-focused L1 connected to the Cardano ecosystem.
Translation: serious tech… but still early and volatile.
The coin was recently listed on Bybit (spot + Convert + Savings), which brought fresh liquidity and the classic price discovery pump. New listing energy is still in play.
On the 4H chart, NIGHT is showing a clean uptrend. We just had a strong impulse move from ~0.085 to ~0.12, and now the plan is simple:
👉 wait for the first real pullback instead of chasing green candles.
⸻
Key Levels (4H + 1H)
• Demand zone: 0.085 – 0.09
→ Last solid base before the latest leg up
• High / TP zone: 0.115 – 0.12
→ Current swing high after the listing pump
• Limit entry: 0.088
→ Right in the middle of the “discount area”
• Stop-loss: 0.075
→ Where the trend thesis officially breaks
⸻
Trade Plan (aka “Don’t Chase, Let It Come to You”)
• Direction: Long
• Entry: 0.088 (limit)
• Stop-loss: 0.075
• Take-profit: 0.115 – 0.12
• Estimated R:R: ~1 : 2
• Time horizon: 1–3 days
• Risk: Max 0.25R (new listing ≠ guaranteed moon)
⸻
Why This Setup Makes Sense
• Trend is your friend:
Clear 4H uptrend. This is a pullback entry, not a hope trade.
• Fresh listing dynamics:
Newly listed coins often do pump → pullback → continuation. This setup targets exactly that second phase.
• Clean demand zone:
The 0.085–0.09 area was a strong base before the last push — a logical place for buyers to step in again.
• Risk kept small:
Early listings can be wild. Small size keeps emotions under control.
⸻
When to CANCEL the NIGHT Limit Order (Very Important 🌙)
• Structure invalidation (too strong):
If NIGHT makes a new high well above 0.12 and starts trading in a higher range (e.g. 0.13–0.18) before your limit fills → 0.088 is no longer a discount. Cancel and wait for a new pullback.
• Structure invalidation (too weak):
If 4H candles start closing below 0.08, the base is broken and the trend thesis is invalid → cancel the limit.
• Time invalidation:
If 2–3 weeks pass and price builds a completely new structure (new bases, new highs), the old limit becomes irrelevant → cancel and re-evaluate.
• BTC / macro ruins the vibe:
If BTC flips into a clear downtrend after a macro shock (risk-off), you don’t want to be long a fresh listing hype coin → all NIGHT limits off.
• Project-specific risk:
Any serious negative news (regulatory issues, exploit, major bug, CEX warning) → cancel immediately, no questions asked.
⸻
Final Thought
This is a pro-trend pullback, not a FOMO entry.
Let price come to you, size it small, and respect the stop.
Fresh listings are fun — just don’t marry them 😄

PIPPINUSDT - Buying the Dip or Catching a Meme?Market Context
PIPPIN is an AI / meme coin on Solana, which basically means:
• strong narrative ✔️
• high volume ✔️
• zero chill ✔️
Despite the recent drama, PIPPIN is still in a bigger bullish structure, but for now it’s taking a break and chilling inside a 4H range between ~0.30 and 0.46.
BTC is doing its classic “bull market correction” thing, dominance is still high, and alt rotation feels delayed, not dead. Translation:
alts might wake up later… or after one more fakeout. 😄
PIPPIN fits perfectly as a high-beta, small-size, speculative long — emphasis on small.
⸻
Key Levels (4H + 15M)
• Support zone: 0.30 – 0.32
→ Where dip buyers usually show up (or pretend to)
• Resistance / TP zone: 0.41 – 0.42
→ Where people suddenly remember they’re “long-term investors”
• Limit entry: 0.315
→ Right in the middle of the danger zone
• Stop-loss: 0.280
→ Where we admit we were wrong and move on with life
⸻
Trade Plan (aka “The Plan”)
• Direction: Long
• Entry: 0.315 (limit)
• Stop-loss: 0.280
• Take-profit: 0.41 – 0.42
• Estimated R:R: ~1 : 2.5
• Time horizon: Intraday to 1–2 days
• Risk: Max 0.25R (this is a meme, not a retirement plan)
⸻
Why This Might Actually Work
• Range logic:
Price is still respecting the range. Buying near the bottom gives us clean invalidation and a decent shot at the top.
• Trend context:
Higher-timeframe trend is still up. This looks more like a pullback than a funeral.
• BTC vibes:
BTC isn’t collapsing — just stretching its legs. As long as that continues, memes can still bounce.
• Narrative + liquidity:
AI + Solana memes = attention. Attention = volume. Volume = tradable.
• Risk management:
Small size so you can sleep at night even if this goes sideways.
⸻
When to CANCEL This Trade (Very Important 😄)
• Structure says “nope”:
If 4H / Daily candles start closing below 0.30 before entry → the range is dead, cancel the order.
• Time says “too late”:
If price moves into a higher range (e.g. 0.38–0.55) and never comes back to 0.32, this level is old news → cancel and reassess.
• BTC ruins the party:
If BTC breaks key supports (e.g. ~80k) and turns risk-off, you do not want to be long a high-beta meme → cancel instantly.
• Project drama:
Rug, exploit, insider dump with real proof?
No analysis. No debate. Cancel.
⸻
Final Thought
This is a range trade, not a prophecy.
Size small, respect the stop, and don’t fall in love with a meme.
Good luck traders — may your limit fill and your stop stay untouched 😄📉
