Another leg down to $73k for Bitcoin? Is Bitcoin setting up for another leg down to $73k for a day trade? The $77.9k support needs to hold if bulls want a push toward $81k.
Crypto

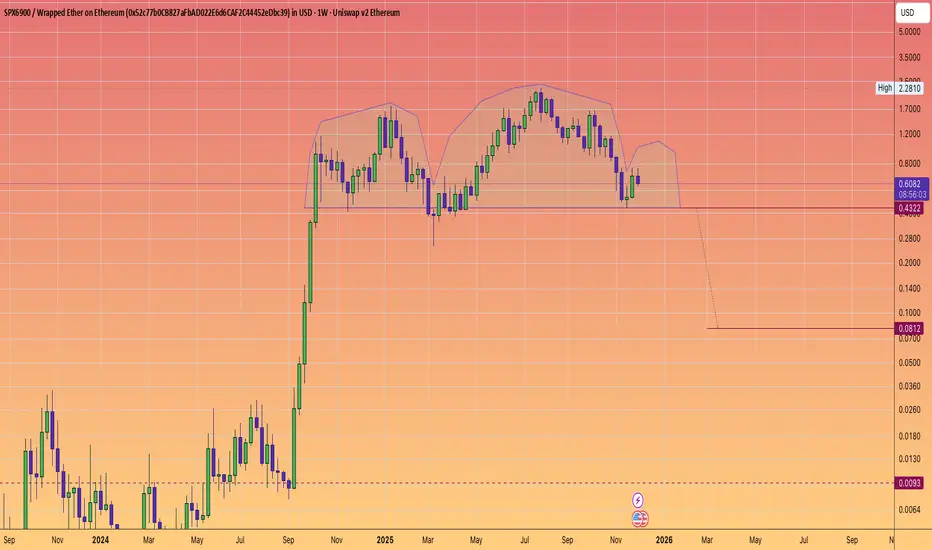
SPX6900 The meme with no community and doomed to crash.The S&P500 is at 6900
so why hold a memecoin for a target that has already been met.
SELL!
SELL!
SELL!
In true Cramer fashion :)
You will be glad you did if you are still holding, hoping and praying.
Bitcoin Weekly – Bearish Continuation Thesis (Higher Time Frame)Note / Preface:
This publication focuses on higher-timeframe (weekly) structure and macro justification. Additional Fibonacci levels, minor supply/demand zones, and other references mentioned in the text but not shown on the chart exist on lower timeframes and are intentionally omitted to preserve clarity. The chart displays only the most pertinent macro levels used to frame the higher-timeframe thesis and potential decision areas.
Thesis:
This thesis is based on higher-timeframe structure, trend, and auction behavior using the weekly chart.
Following the ATH, BTC rejected the golden pocket (≈107–110k), overlapping a major supply zone, and formed a weak corrective channel that resolves as a bear flag. The retracement failed near the 0.5 level, with repeated rejection from supply at 90–93k. No weekly candles accepted above the channel midpoint, suggesting persistent seller control rather than accumulation.
Momentum confirms the structure. Weekly RSI remains in a bear regime (below the EMA and the 50 midpoint), and rallies continue to behave as corrective rather than impulsive.
The measured move from the bear flag pole (thick vertical yellow lines) projects toward ~62k, aligning with a large multi-cycle supply/demand zone (≈53–63k), the rising 200-week SMA (yellow dotted line), and the 0.382 retracement of the Nov 2022 low to ATH (~57.7k). Notably, the anchored VWAP (brown/orange line) from the 2022 low currently sits near the top of this zone (~63k), making it a likely area for long-duration participant defense and a potential reaction.
A bullish Cypher harmonic is tracking toward completion near this region. Harmonic completion is expected to produce a reaction, not necessarily a reversal—either a short-covering bounce followed by a back-test, or a deeper liquidity sweep within the zone. MACD histogram divergence supports the potential for a counter-trend reaction but does not override bearish structure without acceptance and regime change.
From a trend-following perspective, moving-average behavior is consistent with a late Stage 3 / Stage 4 environment under Stan Weinstein’s framework, reinforcing a bearish-until-invalidated bias.
The bearish thesis remains intact unless BTC reclaims 90–93k with acceptance and exits the RSI bear regime. The 53–63k zone is viewed as a high-probability reaction and reassessment area, not a hard target.

#AAVE Bears Ready For Further Downside | Must Watch For Bears Yello Paradisers! Are you watching what’s unfolding on #AAVEUSDT right now? Because if you’re not, this could catch you completely off guard. There’s a potential bearish breakdown brewing that could send #AAVE into much deeper territory. Let’s dive in before it's too late:
💎#AAVE has been trading inside a symmetrical triangle, caught between a descending resistance and ascending support. Each test of the upper boundary has been weaker, showing fading bullish momentum. Now, we’re pressing against the lower support line with sellers gaining control.
💎The current price is $222, and we’re right on the edge. A confirmed breakdown below the ascending support will flip the entire structure bearish. The 50 EMA is now acting as resistance, reinforcing this downward pressure and aligning with the broader setup.
💎If this bearish scenario confirms, the next downside target becomes the Support Zone around $195–180, but the real liquidity lies deeper. A sharp move could easily send #AAVEUSD into the Strong Demand Zone between $133–123, where we expect stronger buyers to finally show up.
💎However, this setup is invalidated if #AAVE breaks back above the Resistance Zone at $263. That would signal strength and likely trigger a fast bullish reversal targeting higher levels above $280.
Trade smart, Paradisers. This setup will reward only the disciplined.
MyCryptoParadise
iFeel the success🌴

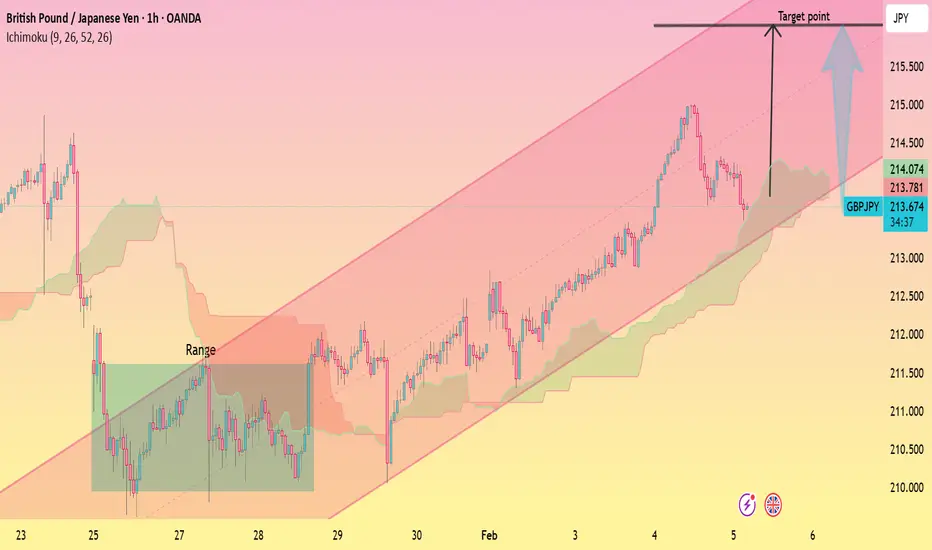
Bullish Ascending Channel with Upside ContinuationThis is a GBP/JPY 1-hour chart showing a strong uptrend inside an ascending channel. Price is making higher highs and higher lows, clearly respecting the channel structure. After a period of range consolidation, the pair broke upward and continued bullish momentum. The Ichimoku Cloud is mostly below price, acting as dynamic support, which confirms trend strength. A small pullback is visible near the mid-channel, but overall structure remains bullish, with a projected upside target around the 216.00 resistance zone, as marked on the chart.
Bitcoin Breakdown From Range, Targeting Lower SupportThis is a 2-hour BTC/USD chart showing a clear **downtrend within a descending channel**. Price previously **ranged sideways** (marked “Range”), then **broke down sharply**, losing range support. The **Ichimoku cloud is bearish**, acting as resistance above price. After the breakdown, price formed a **bearish Fair Value Gap (FVG)** overhead and is consolidating below it. The chart highlights a **projected downside move toward the ~72,000 area**, aligning with the lower channel support as the target zone.

SANTOS Compressing Inside Rising StructureSANTOS is currently trading inside a rising structure, forming higher lows while pushing into a well-defined resistance zone around 2.45–2.55. Price compression near this area suggests a decision phase is underway.
A clean breakout and acceptance above resistance would confirm bullish continuation and open the path toward the 3.60+ region. However, failure to hold the rising support could trigger a deeper pullback, with downside risk toward the 1.80–1.70 zone and potentially lower if structure breaks.
This level decides continuation vs rejection. Patience is key here.

Estimated Stock Market Peak 2026"It's time to call 'bullshit' on the market."
The newswire has been busy lately, don't get distracted by; something feels off.
More than four years have passed since my last major stock market top analysis.
Why Bitcoin? Because it is one of the most cyclical assets, based on liquidity flows at the extreme end of the risk curve, leading the global market peak.
This was the first market cycle with high interest rates and without economic stimulus. Therefore, neither an expansion of the business cycle nor a comparable investment interest from retail, which ultimately led to a peak of apathy rather than euphoria. A typical sign of a later cycle environment, in times of economic uncertainty and risk aversion, with an absence of market breadth, in which only major caps temporarily lead and all other stocks and indicators lag behind. Without an expansion of the broader markets, the entire system risks collapse as soon as the blue chips lose momentum. Zombie companies survived on 0% interest rates, but now the bill is coming due. They have to refinance billions this year at significantly higher rates and will most likely not survive. Warren Buffett, on the other hand, is sitting on a historically high cash reserve of over $380b and doesn't want to "buy the dip", but rather first ride out the delayed effects of rapid interest rate hikes and market downturns on companies whose AI expenditures aren't based on actionable revenues.
Contrary to popular belief, rate cuts into a recession are not bullish.
The Fed could begin larger cuts once they realize the economy is falling off a cliff.
Markets will then respond by falling through the news narrative of an escalating potential war or energy crisis blackout bankrun leading to surging inflation and fears of a global recession.
Only when we hit rock bottom will the Fed have a reason to intervene and aggressively stabilize the market through QE and stimulus checks.
Meanwhile, the commodity supercycle is underway, countering the cryptocurrency market, which is based on tech and big risk-on sentiment speculation. Rising precious metals are a worrying warning signal for the economy, indicating the market being concerned about the stability of the system, predicting what lies ahead of us. A rotation is unlikely to occur immediately; instead, a deep retracement will likely have to take place first. Some of the weakness by stocks may become more pronounced whenever Gold gets a correction.
You will see the US stock markets similarly plunge, but then soar like an eagle as they become the last bastion of capitalism, as frightened money from all over the place, including sovereign bond markets, pours into equities one last time as exit liquidity like never before. It will be interesting to see how ByteDance, SpaceX, OpenAI, Anthropic, Databricks, Stripe, Canva, Revolut, Klarna and Kraken time their IPOs to coincide with the market peak.
The last crypto market capitulation in June 2022 was triggered by the disappearance of Luna(+UST), 3AC, BlockFi, Celsius and the short-term depegging of USDT, which are maximum fear events. This was followed by a five-month time-based capitulation and the absolute market bottom depression caused by the FTX insolvency.
Assumption of next market capitulation bottom:
Corporate Subprime Bitcoin Crisis of 2026
"The system works – but does it justify this valuation?"
Bitcoin was an asset, but it was treated like equity. The highest-probability risk is institutional treasury capitulation under debt and cash flow pressure.
2024–2025: Bitcoin was used as a balance sheet asset (leverage, convertible bonds, project financing). Many models only work when prices rise, and not in MSTR Ponzi schemes.
In 2026, refinancing becomes more expensive, cash flows are insufficient, covenants are triggered, and creditors demand de-risking. The accompanying stock market correction will certainly contribute to this.
= Everyone who needed to own Bitcoin has to sell. High volume and volatility, thin order book illiquidity, negative altcoin funding rates, large arbitrage, and unfavorable front page newspaper and magazines coverage of fear, uncertainty and doubt sentiment.
However, the maximum psychological effect only occurs when something unexpected happens and what is perceived as "safe" breaks down, resulting in existential consequences for private investors.
1. At least another ~1% USDTUSD decline due to altcoin capitulation selling, if not eventually, at a cycle bottom, the controlled Tether implosion restructuring to USDC (Circle)
2. A reputable, top-10, retail-loving coin (-90% Solana, Tron) loses significance/trust
3. Quantum anxiety, privacy wallet/custody layer shock due to wallet bug, smart contract freeze, multi-chain bridge problem, recovery failure
= At the end of the day, as always: Bitcoin hasn't failed – but everything around it.
Assuming the market continues to move at its current velocity relative to historical corrective structures, it seems logical that the loud and frightening crash as well as the associated surprise narrative, will occur during the Blood Moon sometime in February-March.
We will see which global fear narrative emerges while observing the bottoming process through technical indicators and on-chain data. Depending on the strength of the Q1 correction, possibly 5+ months later a bottom in August-October. You should start buying BTC as soon as the price drops below $48.5k, with a target range of around $39k. If the price retraces further, things might be different this time. I will provide you with a new update then. No financial advice.
This isn't about calling a precise top. It's about asymmetry and risk management. Don't be fooled into thinking the markets are doing well beneath the surface.
"Patience is bitter, but its fruit is sweet."
Thank you for reading.
Noteworthy to watch:
- 2029 Shmita year
- 2026 median housing market peak, 18-year real estate cycle recession
- 2026 George Tritch (Benner) cycle – time to sell
- 2026 Chinese Year of the Horse
- 2026 bearish stock market U.S. midterm election years
- 2026 longest ISM PMI<50 & Copper/Gold ratio contraction
- 2026 largest inverted yield curve & Gold/US02Y ratio above 200WMA
- U.S. initial jobless claims above 260k =recession
- JNK divergences overlaying SPX
- Energy rotation Oil and Gas, inflation rising
- DXY rising
- DOWJONES reaction at 34.5k-36k
- TOTAL3ES excluding Btc, Eth and Stablecoins, reaction at $270b
- ETH expanding flat bottom zone at $900

Potential Total Market Cap BottomA potential bottom for the Total Market Cap over the coming months may be around ~$1.48T.
Currently, the market stands near $2.47T, which implies there could still be a reduction of ~$1T in total market value.
This is not investment advice.
Just sharing a personal view and interpretation of the current market environment.

EURJPY – 2H chart pattern...EURJPY – 2H chart pattern.
Nice structure on this one. Here’s the clean target map based on what’s visible.
What I’m seeing
Strong impulsive bullish move just completed
Price tapped into upper supply / resistance zone (yellow)
Ichimoku: price extended far above the cloud → pullback is healthy/expected
My marked arrows suggest a corrective move down, not full trend reversal (yet)
Sell / Pullback Targets 🎯
From current area 184.7 – 185.0:
TP1: 183.80 – 183.65
Previous structure + cloud top
Matches my first marked target
TP2: 182.60 – 182.40 🔥
Strong demand zone
Prior consolidation + liquidity pool
My second target point aligns perfectly
Invalidation / SL
If 2H closes above 185.50
→ pullback idea weak
Safe SL: above 185.80
Bias
📉 Short-term bearish correction
📈 Overall trend still bullish → watch for buys again near 182.5

Bitcoin still aiming for $78k - Institutional ContinuationH1 Long Signal: Institutional Continuation After Liquidity Sweep
Market Context & Setup
Price on the H1 timeframe is currently trading at 75,305.93, and short-term structure remains decisively bullish. The market has printed a clean Bullish Break of Structure (BOS), followed by a higher low (CHoCH) and a strong bullish candle that swept downside liquidity before reversing. This sequence signals active institutional participation rather than a retail-driven bounce.
The trade plan is an intraday long, executed either at market or on a shallow retest into the identified order block, sized according to H1 volatility and predefined risk rules.
Smart Money Concepts (SMC)
The SMC module on H1 confirms bullish control. Price cleared the prior swing high near 74,200, triggering a Change of Character, and then retraced into an institutional order block around 74,800–75,000 before resuming higher. This validates continuation rather than distribution.
Based on SMC structure:
Entry: 75,305.93
Stop Loss: 74,552.87 (below the swept low and order block boundary)
Risk: 753.06 points
Using BOS/CHoCH-based projections:
TP1 (1.5R): 76,435.52
TP2 (2.5R): 77,188.58
TP3 (4.0R): 78,318.17
SMC structure takes precedence for invalidation and stop placement. In this case, all confirmations align with the SMC read.
Liquidity Intelligence
Liquidity Intelligence flagged a clean sweep of equal lows near 74,200, followed by absorption and a bullish volume spike of ~1.8× the H1 average. This behavior is characteristic of stop-hunts followed by institutional accumulation.
Because liquidity conditions passed:
Entry is favored now or on a very shallow retest
A lack of sweep or absorption would have invalidated the setup
Order Block Detection
Order Block Detection identifies a bullish H1 order block at 74,800–75,000, which remains unmitigated. Price is currently trading just above this zone, confirming it as active institutional demand.
This order block:
Justifies entering at market or on OB acceptance
Dictates stop placement just below the zone
Allows for scaling in if price dips and holds the OB
A full mitigation (engulfment) of the order block invalidates the trade.
Fair Value Gap (FVG)
A bullish H1 Fair Value Gap sits higher between ~76,300 and 76,500, aligning precisely with TP1 at 76,435.52. This unfilled imbalance represents a natural liquidity target where partial profit-taking is expected.
Because the FVG confirmation passed, TP1 is treated as the primary exit / partial take-profit zone.
Momentum & Trend Filters
RSI (H1):
RSI is hovering around 58, indicating bullish momentum without overbought conditions. This supports further upside toward TP1 and TP2 before reversal risk increases.
Moving Averages (H1):
Price is above both the 50 EMA (~74,200) and 200 EMA (~72,400), with the 50 EMA above the 200 EMA. This bullish EMA alignment confirms that longs are favored on the hourly timeframe.
MACD (H1):
MACD shows a positive histogram with the MACD line above the signal line, aligning with the BOS candle. Momentum supports continuation rather than mean reversion.
Support, Resistance & Volume
Key Support: 74,800–75,000 (order block), then ~74,200 (swept low)
Resistance: 76,300–76,500 (FVG / TP1), 77,100–77,300 (TP2 zone)
Volume (H1):
The breakout candle printed ~1.8× average H1 volume, exceeding the strategy’s confirmation threshold (>1.5×). Elevated volume during the sweep-and-reversal sequence confirms institutional participation and increases the probability of a sustained move toward higher targets.
News & Event Risk
No specific macro, crypto, or on-chain events were provided for the current session. This setup is therefore based purely on price action and liquidity structure. Traders should remain alert to unexpected high-impact headlines or exchange announcements, as these can rapidly invalidate intraday structures.
Trade Plan Summary (H1)
Direction: LONG
Entry: 75,305.93 (market or on shallow OB retest)
Stop Loss: 74,552.87
TP1 (Partial Exit): 76,435.52
TP2: 77,188.58
TP3: 78,318.17
Execution Notes:
Size the position so the SL distance (~753 points, ~1% of price) matches your risk rules
Take partial profits at TP1 and move stop to breakeven
Exit immediately if:
The order block is fully mitigated, or
Liquidity Intelligence no longer shows absorption
Final Assessment
This is an A-quality H1 long setup, with alignment across SMC structure, liquidity sweep and absorption, order block demand, FVG targets, volume confirmation, and momentum indicators. Risk is tightly defined beneath institutional support, and profits are staged at logical liquidity and structure levels to maximize reward while controlling downside.

GBPAUD – 2H chat pattern...GBPAUD – 2H chart pattern.
Clean bearish structure here. Let’s lock the targets.
What the chart is saying
Strong downtrend (lower highs & lower lows)
Price below Ichimoku cloud → bearish control
Descending trendline respected
Current price consolidating under a supply / flip zone (yellow)
Sell Targets 🎯
From current area (~1.9450):
TP1: 1.9350 – 1.9300
First liquidity + minor support
TP2: 1.9200 – 1.9150
Strong horizontal support (matches my marked zone)
Final Target: 1.9000 – 1.8950 🔥
Major demand + measured move completion
Invalidation / Stop
If 2H closes above 1.9600 – 1.9650
→ bearish idea weak
Safe SL: above 1.9700
Bias
📉 Bearish continuation while below 1.9600

XAUUSD (2H) chart:..XAUUSD (2H) chart:
What I see
Clear breakout above the descending trendline
Price is holding above the demand / yellow zone
Ichimoku cloud ahead is thin → easier upside continuation
Momentum looks corrective → turning bullish
Targets (step-by-step)
TP1: 5,120 – 5,150 (nearest resistance / reaction high)
TP2: 5,280 – 5,320 (previous structure resistance)
Final target: 5,480 – 5,550 🎯
(Matches my drawn target point + measured move)
Invalidation / Safety
If price closes back below 4,980 – 5,000 on 2H → bullish setup weak
Conservative SL: below 4,950
Bias
📈 Bullish continuation as long as price stays above the breakout zone

BTCUSDT: Reacts to Key Support - Corrective Bounce To $82,200Hello everyone, here is my breakdown of the current BTCUSDT setup.
Market Analysis
BTCUSDT was previously trading within a well-defined upward channel, where price respected both the rising support and resistance boundaries, printing higher highs and higher lows. This structure clearly confirmed bullish control and healthy trend continuation. However, as price approached the upper region of the channel, bullish momentum began to weaken. After several failed attempts to sustain higher prices, BTC broke below the channel support, signaling the first sign of structural weakness.
Currently, price is stabilizing above the Support Zone and attempting to recover toward the 82,200 Resistance Zone, which now acts as a critical level. This area aligns with previous support turned resistance and represents a key decision point for the market. The overall structure suggests that the current move is a corrective rebound within a broader bearish impulse rather than a full trend reversal at this stage.
My Scenario & Strategy
My primary scenario favors a corrective long setup as long as BTCUSDT holds above the 77,800–78,200 Support Zone and continues to reject lower prices. A sustained hold above this demand area could allow price to recover toward the 82,200 Resistance Zone as a first upside target (TP1). This move would represent a technical retracement after the sharp sell-off.
However, strong rejection from the 82,200 resistance would likely confirm that sellers remain in control, potentially leading to another bearish continuation. A decisive breakdown and acceptance below the Support Zone would invalidate the long scenario and open the door for further downside expansion. For now, BTC is at a key reaction area, and confirmation from price behavior near resistance will be crucial.
That’s the setup I’m tracking. Thank you for your attention, and always manage your risk.

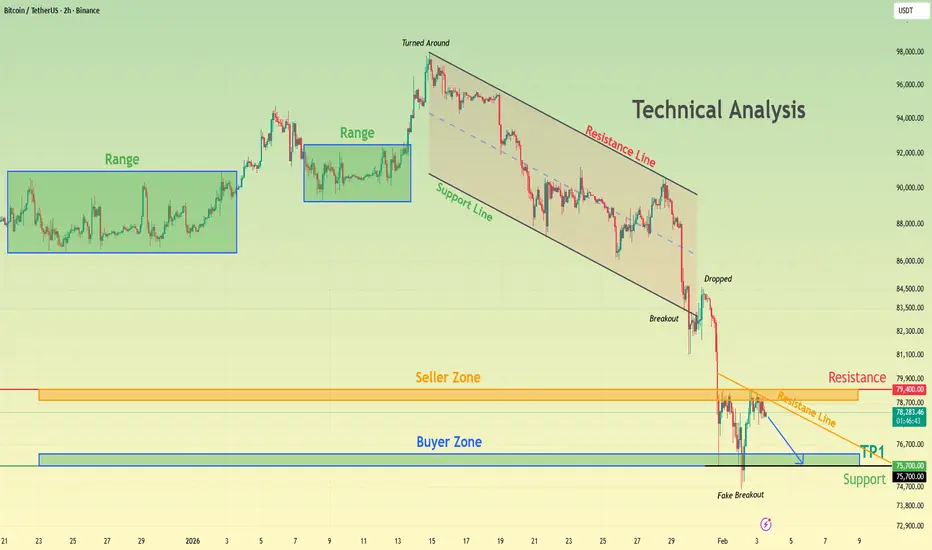
BTCUSDT Bearish Structure Holds - Short From ResistanceHello traders! Here’s my technical outlook on BTCUSDT (2H) based on the current chart structure. Bitcoin initially traded within a clearly defined range, where price moved sideways for an extended period, indicating market equilibrium and accumulation before the next directional move. This ranging phase eventually resolved to the upside, leading to a strong impulsive rally and a short-term bullish continuation. However, after reaching the local top, price turned around and transitioned into a well-structured descending channel, confirming a shift in short-term market control from buyers to sellers. Following the breakdown, Bitcoin dropped sharply into the Seller Zone, where price briefly reacted before continuing lower. The sell-off eventually extended into the major Buyer Zone around 75,700, which aligns with a key horizontal support area and prior demand. Price briefly pierced this level, forming a fake breakout, but quickly recovered back above support — a strong indication that sellers failed to gain acceptance below demand. Currently, BTC is stabilizing above the Buyer Zone and attempting a short-term recovery. This price behavior suggests a corrective rebound rather than a confirmed trend reversal at this stage. Structurally, as long as price holds above the Buyer Zone, a recovery move toward the 78,700–79,400 Resistance / Seller Zone (TP1) remains possible. This area also aligns with a descending resistance line, making it a key level to watch for potential rejection. Rejection from the Resistance / Seller Zone favors continuation to the downside. A move back toward the 75,700 support is the first target, followed by potential extension toward lower demand levels if selling pressure accelerates. Acceptance below the Buyer Zone would confirm bearish continuation and open the door for deeper downside. The bearish scenario remains valid as long as price stays below resistance and fails to reclaim the broken structure. Only a strong breakout and acceptance above the Seller Zone would invalidate the short setup. Until then, BTC remains in a corrective bounce within a broader bearish structure. Please share this idea with your friends and click Boost 🚀
EURUSD Bulls Take Control - 1.1940 as Next TestHello traders! Here’s my technical outlook on EURUSD (3H) based on the current chart structure. EURUSD previously traded within a well-defined ascending channel, where price consistently respected both the rising support line and the channel resistance, confirming steady bullish control and healthy trend conditions. During this phase, the market printed higher highs and higher lows, showing strong buyer dominance. However, after reaching the upper boundary of the channel, bullish momentum began to weaken, and price transitioned into a corrective phase. This correction unfolded gradually, signaling profit-taking rather than an immediate trend reversal. Following the pullback, EURUSD formed a rising triangle structure supported by a clear ascending support line. Price then broke impulsively to the upside, signaling a structural shift and renewed buying interest. This breakout pushed price above the Buyer Zone around 1.1860, confirming acceptance above previous resistance turned support. The bullish impulse extended into the Seller / Resistance Zone near 1.1940, where price is currently reacting. At this level, sellers have started to show interest again, and price is consolidating below the resistance, indicating hesitation and potential short-term exhaustion after the strong rally. Structurally, the Buyer Zone around 1.1840–1.1860 now acts as a key support area. As long as price holds above this zone and respects the rising triangle support line, the broader bullish structure remains intact. A sustained hold above support favors a continuation move toward the 1.1940 Resistance Level, which stands as the primary upside target (TP1). This level also represents a critical decision zone where either continuation or rejection is likely to occur. My scenario: holding above the Buyer Zone keeps the bullish continuation scenario valid, with a potential retest of the 1.1940 Resistance Level. A clean breakout and acceptance above this resistance would open the door for further upside expansion. However, a strong rejection from resistance followed by a breakdown below the Buyer Zone would invalidate the bullish bias and signal a deeper corrective move. For now, EURUSD is trading at a key structural area, with buyers attempting to defend support and push price higher. Please share this idea with your friends and click Boost 🚀

Hyperliquid: bull flag in play? key levels to watch aheadHyperliquid. Who’s riding this new perp beast or just watching from the sidelines? According to market chatter, the recent token launch plus growing derivatives volume keeps Hyperliquid in the spotlight, and today’s headlines about rising on-chain activity only added fuel to the narrative.
On the 4H chart we’ve got a classic post-pump chill phase: sharp vertical move, then a sideways pullback between roughly 31 and 35 that looks like a bull flag. Volume on the run-up was heavy and is now fading while RSI cooled from overbought back to the 50–60 zone - a healthy reset instead of a trend break. I’m leaning long, expecting liquidity grabs toward 32-31 and then a push through 34 with eyes on 36-38.
My plan: ✅ base case is that 31 holds as key support and price grinds higher toward 36 first, 38 if momentum returns. ⚠️ If we start closing 4H candles below 31 and especially under 29.7, I’ll treat it as a local top and look for deeper buys down in the lower green zones. I might be wrong, but I’d rather wait for the dip than FOMO into the last green candle at the highs.

VANA Testing Upper Boundary of Descending ChannelVANA is currently trading near the upper boundary of a long-term descending channel, making this a key decision area. Price has respected this structure for a long time, and the current move represents a clear resistance test, not support.
If price manages to break and hold above the upper trendline, it would indicate a potential trend shift and open room for a stronger upside move. However, a rejection from this level would likely keep price moving lower within the channel.
RSI is hovering near oversold territory, suggesting downside momentum may be slowing, but confirmation still depends on how price reacts at this resistance.
This is a wait-and-react zone.

BNB/USDT | Alive! (READ THE CAPTION)As you can see, BNBUSDT swept away the liquidity below 730 level and then moved back up to 783 before dropping back in the Bullish OB zone and now it's being traded at 755.
I would like to see BNB leave the Bullish OB zone soon to make an upwards move.
For now, the targets are: 760, 769, 778 and 787.

SOL/USDT | Liquidity sweep first (READ THE CAPTION)As you can see in the Daily chart of SOLUSDT, it has gone below $100 and the Bullish OB zone and it's being traded at 97.05 right now. I expect it to sweep the liquidity below the 95.27 level before starting a bullish movement.
I prefer to wait for now and not trade on SOLUSDT.

ETH/USDT | Back on track? (READ THE CAPTION)After sweeping the liquidity below, ETHUSDT managed to go high from 2110 to 2295, now being traded at 2265.
I expect Ethereum to eventually go higher and leave to Bullish OB zone.
For now, the targets are: 2297, 2320, 2345 and 2370.

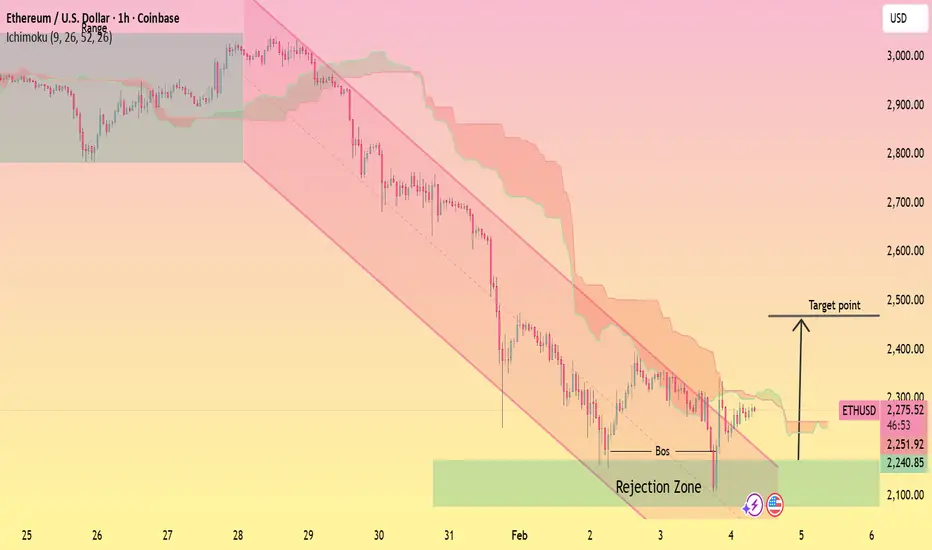
ETHUSD Downtrend Channel – Reversal Setup Toward Key ResistanceThis 1H ETHUSD chart shows Ethereum trading within a well-defined descending channel, confirming a strong bearish trend from late January into early February. Price remains below the Ichimoku cloud, keeping overall bias bearish, but a clear bounce from the highlighted demand/rejection zone has formed a short-term base. The marked BOS (break of structure) hints at early bullish intent after the sell-off. If momentum holds, price could attempt a corrective move toward the 2,450–2,500 resistance zone, which aligns with the upper channel and cloud resistance, before any larger trend continuation.
XAGUSD Trend Shift – CHoCH Signals Potential Bullish RecoveryThis 1H XAGUSD chart shows silver transitioning from a prior uptrend into a sharp bearish move, followed by signs of stabilization and early bullish reversal. The Change of Character (CHoCH) marks the shift in market structure after the sell-off. Price has rebounded from a highlighted demand zone and is attempting to reclaim the Ichimoku cloud, suggesting improving momentum. If buyers maintain control, the projected upside target sits near the 100–102 zone, aligning with previous structure and cloud resistance.
