Short-term analysis of Bitcoin (12H)After the heavy drops | which we had already identified in previous analyses () | Bitcoin is now approaching a strong supportive order block.
From the point where we marked the red arrow, Bitcoin entered a bearish phase, and it is expected that wave C of this phase will complete around the green zone.
We will see whether the price reaches the green area or not.
The initial target for this bounce can be the 95K to 96K range.
For any reason, the closing of a daily candle below the invalidation level will break the structure and invalidate this upward correction
For risk management, please don't forget stop loss and capital management
When we reach the first target, save some profit and then change the stop to entry
Comment if you have any questions
Thank You
Cryptoanalysis

ETHUSDT: Pullback to 2,900 Before the Next DropLooking at the current price action, ETH is showing the classic signs of a weak market : shallow pullbacks, weak buying pressure , and repeated rejections at key resistance zones. Everything suggests ETH is simply taking a short pause before the next leg down.
On the H4 timeframe, price remains firmly inside the descending channel drawn on the chart. Every time ETH touches the upper boundary of the channel, it gets sold off aggressively — a pattern that has repeated consistently. The 2,900 USDT area above now acts as a confluence resistance zone: it aligns with the channel’s upper boundary and a corrective structure — the perfect place for sellers to step in.
At the moment, ETH is making a minor pullback to retest the 2,900 region, but buying momentum is fading and candles are being pushed down repeatedly. This indicates that a bearish reversal is likely forming. Once rejection confirms, the nearest target is the 2,650 support zone. If bearish momentum accelerates, ETH could slide further toward 2,550.
Reference Scenario
Main Trend: Bearish
Strategy: Wait for ETH to retest 2,900 and SELL
Targets: 2,650 – 2,780 → deeper target: 2,550

BTC Daily Analysisbased on our previous analysis bitcon made an announced ATHs and drop down from that point.
it is near our important support levels. we expect BTC ranges between its support and resistance levels.
in weekly timeframe we can't see any signs of downward movement.
if any of these levels breaks with ichimoku confirmation, i will update the analysis.

TOTAL 3 New Update (1D)It appears that wave G of Total 3 has completed, and the price has entered wave H. Wave H is expected to end within the green zone, after which we’ll move toward wave I.
For now, our outlook on Total 3 remains bearish, as the strong move a few days ago and the market crash indicate the formation of new corrective waves.
A daily candle closing above the invalidation level will invalidate this analysis.
For risk management, please don't forget stop loss and capital management
When we reach the first target, save some profit and then change the stop to entry
Comment if you have any questions
Thank You

LITECOIN Analysis (4H)It appears that a double correction is forming on Litecoin and is nearing completion. Around the origin zone, we can look for long buy positions so that once this second corrective leg finishes, the price can enter a bullish phase.
The entry zone and targets are marked on the chart.
For risk management, please don't forget stop loss and capital management
When we reach the first target, save some profit and then change the stop to entry
Comment if you have any questions
Thank You

Bitcoin’s Drop From $125K: A Healthy Correction?The recent decline is largely a correction after BTC’s massive rally from $17K (Oct 2023).
Based on Fibonacci levels, the next key supports sit at $85K, $70K, and $60K — with $70K looking especially strong to me.
And yes… Bitcoin is officially 4-digit again.
#Bitcoin #BTC #CryptoAnalysis #Fibonacci #CryptoMarket

USDT DOMINANCE Roadmap (1D)From the point where the green arrow is placed on the chart, it seems that a large-degree bullish pattern has started. Waves A and B of this pattern are complete, and we are now in wave C.
Wave A was a diametric, and wave B was a triangle. We are currently in wave a of C. After wave b of C completes, caution is needed because the movement of c of C will begin.
From the green zone, Tether dominance may turn bullish again toward the two red-line targets.
We will try to update this analysis periodically.
For risk management, please don't forget stop loss and capital management
When we reach the first target, save some profit and then change the stop to entry
Comment if you have any questions
Thank You

1INCH Analysis (2H)The internal trendline has been broken and the structure is bearish. Below the current price, there is an important support level that has been tested multiple times, and lower highs have formed, indicating selling pressure.
The targets are marked on the chart.
A daily candle closing above the invalidation level will invalidate this analysis.
Do not enter the position without capital management and stop setting
Comment if you have any questions
thank you

LIGHT is Bearish (4H)It seems that a large structure, which was a triangle, has completed, and we are now at the end of wave E. Look for a trigger for a sell/short position and enter the trade at the right point with proper risk management.
If the wave count is correct, LIGHTUSDT will remain in a corrective phase for a long time.
The short-term targets are marked on the chart.
A 4-hour candle closing above the invalidation level will invalidate this analysis.
For risk management, please don't forget stop loss and capital management
When we reach the first target, save some profit and then change the stop to entry
Comment if you have any questions
Thank You

ROSE Analysis (2H)This is a buy/long setup | do not use it as a sell/short setup.
We have a solid support zone on the chart with significant liquidity resting around it.
Price is expected to show a strong rejection upon tapping the demand zone.
The targets are marked on the chart.
A 4-hour candle closing below the invalidation level will invalidate this analysis.
Do not enter the position without capital management and stop setting
Comment if you have any questions
thank you

ZEN is Bullish (4H)The structure of ZEN is completely bullish, and we are looking for demand zones and supportive order blocks to enter long positions, since buy setups align with the bullish structure and therefore carry lower risk.
There is a key zone on the chart; as long as ZEN remains above this level, the market stays bullish. Only if the specified zone gets broken and cleaned out can we say that there is confirmation for ZEN to turn bearish.
Do not enter the position without capital management and stop setting
Comment if you have any questions
thank you

Has The BITCOIN Bear Cycle Started? (1W)This is a weekly timeframe analysis. In this analysis, we examined the bullish phase that pushed Bitcoin from the $15K channel to the $125K channel.
This phase appears to be a bullish diametric pattern, with its final wave, G, completed as a triangle.
It’s important to note that there is a possibility for this diametric pattern to transform into a symmetrical pattern. The difference between a symmetrical and a diametric pattern is that the symmetrical pattern has two additional waves.
The price zone that could potentially turn our diametric pattern into a symmetrical one is the upper support area, between $64K and $74K. The potential timeline for a reversal is indicated by two vertical lines on the chart for the months of March and January. These were derived from the duration of previous branches of this pattern, where corrective branches of prior waves ranged between 16 to 25 weekly candles. If the pattern is symmetrical and not diametric, this means the next two waves of this bullish cycle are still remaining, following these timing rules.
In general, the intersection of the support zone and the timeline lines at the top of the chart is where the price could develop the pattern and move upward. However, if these zones fail, it means the main pattern was the diametric itself, and we are now in Bitcoin’s bear cycle. In other words:
If the price continues to decline, it’s possible that the diametric pattern was the main bullish phase, which is now complete, and Bitcoin has entered a monthly timeframe bear cycle that could last months or even more than two years.
The main support after this bullish phase, on higher timeframes, is in the $31K to $44K range, where Bitcoin’s bear cycle might finally end.
We hope this gives you a clear perspective on Bitcoin.
For risk management, please don't forget stop loss and capital management
When we reach the first target, save some profit and then change the stop to entry
Comment if you have any questions
Thank You

FF Looks Bullish (2H)FFUSDT has been ranging within a zone for a while, taking out both buyers’ and sellers’ stop-losses. After creating a large liquidity pool at the bottom and sweeping that lower pool, it now appears ready to move toward the key level.
On this timeframe, we have a bullish outlook on the FFUSDT pair.
Do not enter the position without capital management and stop setting
Comment if you have any questions
thank you

Bitcoin 4-Year Halving Cycle | Highs & Lows RhythmA visual comparison of Bitcoin’s market highs and lows across each 4-year halving cycle — from pre-halving accumulation to post-halving expansion.
This chart highlights how BTC typically bottoms around 1 year before each halving and peaks 12–18 months after, revealing the recurring rhythm of supply shock and market psychology.
Key markers: each halving date, cycle bottom, and all-time high zones. Ideal for macro-swing and cycle analysis.
#BTC #Bitcoin #Halving #CryptoCycles #BTCUSD #CryptoAnalysis

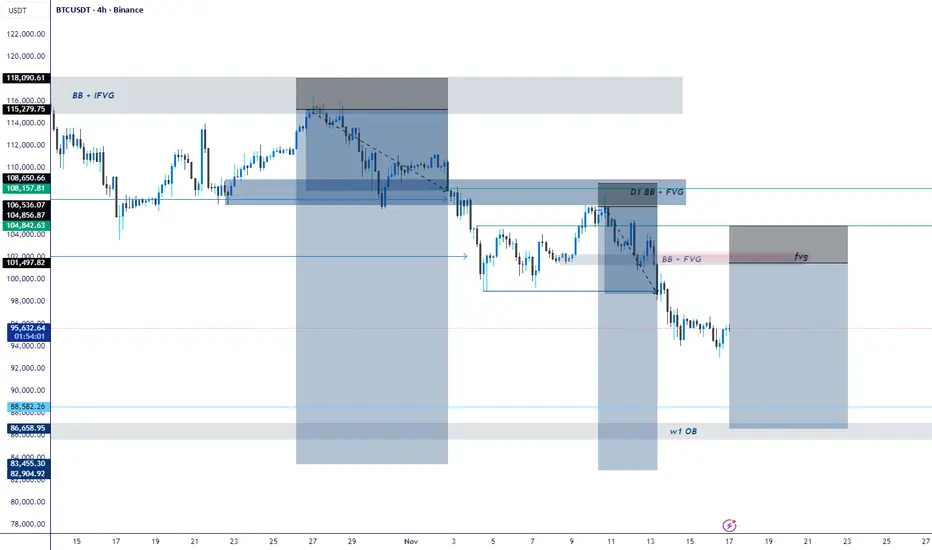
BTC Outlook: Premium Rejections, Clean Drawdown Targets, and KeyBTC continues to respect the higher-timeframe bearish order flow. Price tapped into the Daily Bearish Block + IFVG around the $104K–$108K premium zone, delivered displacement, and broke structure to the downside.
From there, the market formed a clean 3H Supply (BB + FVG) where sellers aggressively re-entered. Price rejected that imbalance and continued the markdown phase.
Structure remains bearish with lower-highs and lower-lows being printed. Current PA is consolidating below key structure, signaling that liquidity is being engineered for the next leg.
We still have an unmitigated Weekly OB at $83K–$86K, which aligns with the macro drawdown target. This zone remains the highest-probability area for a deeper corrective bounce.
K ey Levels
Premium Rejection Zone: $104K – $108K
3H Supply + FVG: $98K – $101K
Immediate Support: $92K – $95K
Major HTF Demand (Weekly OB): $83K – $86K
What I Expect Next
Retracement into the 3H FVG / inefficiency before another sell-off.
Liquidity below $92K likely to be swept.
High-probability macro reaction once price taps the weekly OB.
---------------------------------------------------------------------------------------------------------------------
CONFIRMATION ENTRY (Safer Approach)
Use this for precise execution:
Mark the 3H/1H supply zone.
Wait for price to tap the zone → no instant entries.
Drop to M15/M5 and wait for a clear CHOCH (shift) or BOS confirming sellers.
Enter on the pullback into the refined OB or FVG.
SL above the M5 POI that caused the break.
First TP at relative equal lows or clean inefficiencies.
This keeps you out of premature entries and filters manipulation.
ZEREBRO Looks Bearish (4H)ZEREBROUSDT has swept a major liquidity pool, and a supply zone has formed.
If a CH occurs on the supply zone, we can look for potential sell/short setups. Make sure to place your stop-loss at the defined invalidation level shown on the chart.
Targets are marked on the chart.
Touching the invalidation level will invalidate this analysis.
Do not enter the position without capital management and stop setting
Comment if you have any questions
thank you

BITCOIN is still bearish (4H)After accumulating a large liquidity pool, as shown on the left side of the chart, the price has entered a bearish trend.
Within the supply zone, we expect the price to move downward again after collecting liquidity from the order blocks.
The targets are marked on the chart.
A daily candle closing above the invalidation level will invalidate this outlook.
Do not enter the position without capital management and stop setting
Comment if you have any questions
thank you

FILUSDT — the formation is repeating, the structure is familiar.Filecoin(FIL) - is a decentralized storage system with the goal of "storing humanity's most important information." During its initial coin offering (ICO) in 2017, the project raised $205 million. The launch was initially planned for mid-2019, but the mainnet launch date was postponed until block 148,888, which occurred on October 15, 2020.
📍 CoinMarketCap : #50
📍 Twitter(X) : 667.3K
🔍 What I observe:
I’ve added the full trading history to the chart for better understanding (the chart on exchanges is cut off). The coin is liquid. I also added the prices for the public and private offerings.
There’s a large horizontal channel, or more specifically, a channel within a channel, which has been active for about 1111 days.
After another drop, a descending wedge formed, and now we are witnessing a breakout of its resistance (a retest is possible).
These patterns are ones I regularly track and trade, based on personal experience accumulated over the years and my strategy.
📊 I’ve plotted the nearest resistances and target prices with movement percentage calculations.
💭 It’s quite possible that this formation in the lower part of the wedge, coinciding with the area of lows on the support of the outer channel, was used to gather liquidity and shake out weak hands.
I also want to point out the large wicks in this zone - a characteristic pattern for accumulation points and subsequent reversals.
______
📌 Not financial advice. Observing structure and recurring phases.
Operate within your strategy and with an awareness of risks.

RAYSOL is bullish (1H)From the point marked as start on the chart, it appears that a bullish diametric pattern has formed, showing strong upward movements. We will wait for wave e to complete, and at the end of wave f, we’ll look to enter a buy/long position to capture wave g.
Given the strength of the bullish legs, taking a sell/short position could be risky — we’re only looking for buy/long setups.
Targets are indicated on the chart.
A 4-hour candle close below the invalidation level will invalidate this analysis.
For risk management, please don't forget stop loss and capital management
When we reach the first target, save some profit and then change the stop to entry
Comment if you have any questions
Thank You

NOTUSDT – broken faith and potential for a reversalNotcoin(NOT) - is a Web3 gaming project launched on January 1 within the TON ecosystem. Technically, Notcoin is an application inside the Telegram messenger. The project attracted users' attention through an announced token airdrop. The developers invited users to mine tokens simply by tapping on their smartphone screens. Within a few months, the game's audience exceeded 35 million people.
📍CoinMarketCap: #170
📍Twitter(X): 2.4M
________________
The NOT token dropped by -94.5% following its listing and a wave of hype. Such a decline is typically accompanied by a loss of faith in its growth and potential.
🔍 What I observe:
The price is moving within a descending channel.
A reversal pattern, the "inverse head and shoulders," is forming in the current zone, with a potential upside of around ~75%.
The key point is a breakout above the outer resistance of the channel.
The token has high liquidity.
NOT is traded on all major exchanges, including the top-tier ones.
It has excellent access to marketing and PR, which is important for pump scenarios.
💭 All key levels, possible scenarios, and targets are marked on the chart. Take them into account when building your own strategy.
________
📌 Not financial advice. Personal view and experience.

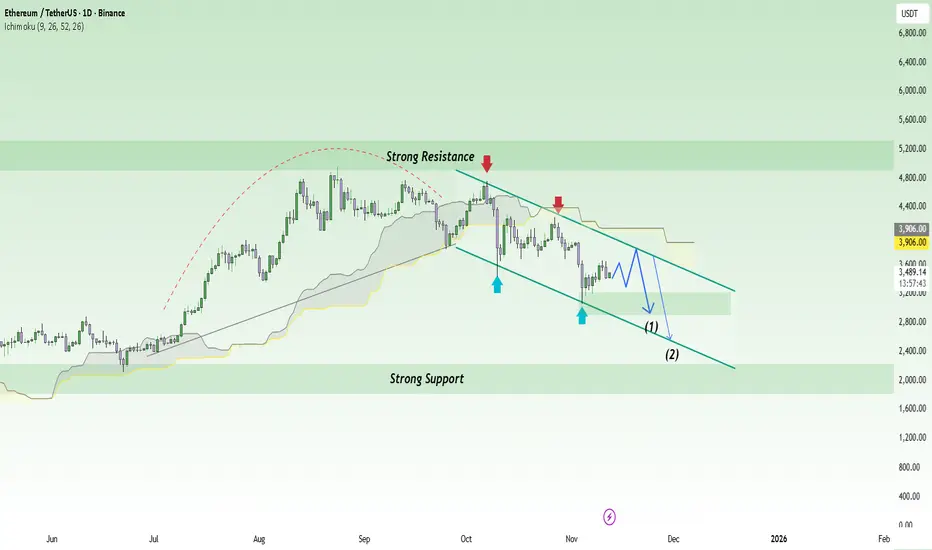
ETH Breaks Structure! Are the Bears Back in the Race?Ethereum (ETH) is entering a sensitive phase as overall market sentiment turns more cautious following recent declines across the crypto market. While it remains the leading platform for tokenization and DeFi, short-term selling pressure is becoming increasingly evident — especially as speculative capital shifts toward safer assets.
On the daily chart, ETHUSDT remains inside a medium-term descending channel , with every rebound quickly rejected at the dynamic resistance line. Price is currently trading around $3,480, signaling a weak recovery attempt while momentum remains trapped below the Ichimoku cloud.
The current scenario suggests that ETH could retest the $3,800 resistance zone before continuing its move lower toward $2,900 and $2,500 — both aligning with the lower boundary of the channel and a strong support area from previous price action.
Overall, the primary trend remains bearish , and any short-term bounce is likely just a technical pause before renewed selling pressure. In the short run, the bears are clearly still in control.
ETHUSDT – Short-Term Bounce Before Another DropEthereum is currently showing signs of a mild recovery after the sharp selloff seen earlier this week. Despite the ongoing bearish sentiment in the crypto market, a short-term rebound is forming as price finds support around the $3,300 zone.
Recent news highlights large outflows from Ethereum ETFs, signaling cautious investor sentiment. However, on-chain data also points to short-term accumulation, suggesting that some traders are taking advantage of lower prices to re-enter the market. This has helped ETH recover slightly toward the $3,700 region — a key resistance area aligned with the descending trendline and previous supply zone.
Still, the $3,700 area remains a potential turning point. If buyers fail to sustain momentum here, sellers may regain control, pushing ETH back down to $3,300 or lower in the next sessions.

#AAVE Bears Ready For Further Downside | Must Watch For Bears Yello Paradisers! Are you watching what’s unfolding on #AAVEUSDT right now? Because if you’re not, this could catch you completely off guard. There’s a potential bearish breakdown brewing that could send #AAVE into much deeper territory. Let’s dive in before it's too late:
💎#AAVE has been trading inside a symmetrical triangle, caught between a descending resistance and ascending support. Each test of the upper boundary has been weaker, showing fading bullish momentum. Now, we’re pressing against the lower support line with sellers gaining control.
💎The current price is $222, and we’re right on the edge. A confirmed breakdown below the ascending support will flip the entire structure bearish. The 50 EMA is now acting as resistance, reinforcing this downward pressure and aligning with the broader setup.
💎If this bearish scenario confirms, the next downside target becomes the Support Zone around $195–180, but the real liquidity lies deeper. A sharp move could easily send #AAVEUSD into the Strong Demand Zone between $133–123, where we expect stronger buyers to finally show up.
💎However, this setup is invalidated if #AAVE breaks back above the Resistance Zone at $263. That would signal strength and likely trigger a fast bullish reversal targeting higher levels above $280.
Trade smart, Paradisers. This setup will reward only the disciplined.
MyCryptoParadise
iFeel the success🌴
