NOTUSDT – broken faith and potential for a reversalNotcoin(NOT) - is a Web3 gaming project launched on January 1 within the TON ecosystem. Technically, Notcoin is an application inside the Telegram messenger. The project attracted users' attention through an announced token airdrop. The developers invited users to mine tokens simply by tapping on their smartphone screens. Within a few months, the game's audience exceeded 35 million people.
📍CoinMarketCap: #170
📍Twitter(X): 2.4M
________________
The NOT token dropped by -94.5% following its listing and a wave of hype. Such a decline is typically accompanied by a loss of faith in its growth and potential.
🔍 What I observe:
The price is moving within a descending channel.
A reversal pattern, the "inverse head and shoulders," is forming in the current zone, with a potential upside of around ~75%.
The key point is a breakout above the outer resistance of the channel.
The token has high liquidity.
NOT is traded on all major exchanges, including the top-tier ones.
It has excellent access to marketing and PR, which is important for pump scenarios.
💭 All key levels, possible scenarios, and targets are marked on the chart. Take them into account when building your own strategy.
________
📌 Not financial advice. Personal view and experience.
Cryptoanalysis

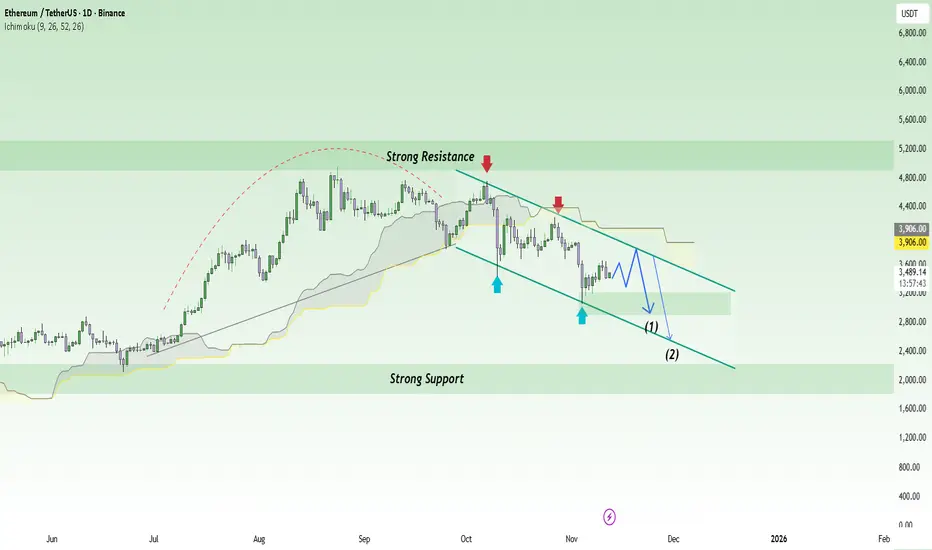
ETH Breaks Structure! Are the Bears Back in the Race?Ethereum (ETH) is entering a sensitive phase as overall market sentiment turns more cautious following recent declines across the crypto market. While it remains the leading platform for tokenization and DeFi, short-term selling pressure is becoming increasingly evident — especially as speculative capital shifts toward safer assets.
On the daily chart, ETHUSDT remains inside a medium-term descending channel , with every rebound quickly rejected at the dynamic resistance line. Price is currently trading around $3,480, signaling a weak recovery attempt while momentum remains trapped below the Ichimoku cloud.
The current scenario suggests that ETH could retest the $3,800 resistance zone before continuing its move lower toward $2,900 and $2,500 — both aligning with the lower boundary of the channel and a strong support area from previous price action.
Overall, the primary trend remains bearish , and any short-term bounce is likely just a technical pause before renewed selling pressure. In the short run, the bears are clearly still in control.
ETHUSDT – Short-Term Bounce Before Another DropEthereum is currently showing signs of a mild recovery after the sharp selloff seen earlier this week. Despite the ongoing bearish sentiment in the crypto market, a short-term rebound is forming as price finds support around the $3,300 zone.
Recent news highlights large outflows from Ethereum ETFs, signaling cautious investor sentiment. However, on-chain data also points to short-term accumulation, suggesting that some traders are taking advantage of lower prices to re-enter the market. This has helped ETH recover slightly toward the $3,700 region — a key resistance area aligned with the descending trendline and previous supply zone.
Still, the $3,700 area remains a potential turning point. If buyers fail to sustain momentum here, sellers may regain control, pushing ETH back down to $3,300 or lower in the next sessions.

BTCUSD 1D - Pause Before the Next Leg Down?On the 4H chart, Bitcoin is retesting a critical resistance area - the 111K–113K sell zone, where a descending trendline, prior support-turned-resistance, and local volume cluster converge. This confluence makes the current level a potential short-entry area.
After failing to sustain above 115K, BTC entered a corrective phase. The recent bounce looks like a retest of the broken structure, and unless bulls reclaim 113K+, the bias remains bearish with a target near 100K–101K, a key liquidity zone.
Technically, momentum is fading:
– Bearish RSI divergence at recent highs;
– Volume contraction on rallies, expansion on drops;
– Price structure forming a likely ABC correction, with wave C projection toward 100K.
Fundamentally , near-term pressure persists as traders take profits and global risk sentiment cools ahead of potential Fed guidance. However, the macro bull case remains intact - hashrate at all-time highs, growing institutional adoption, and supply tightening continue to underpin long-term support.
Tactical plan: short entries near 111K–113K, targets 100K–101K. Invalidation above 113.5K.
Even in a bull market, gravity never takes a holiday.

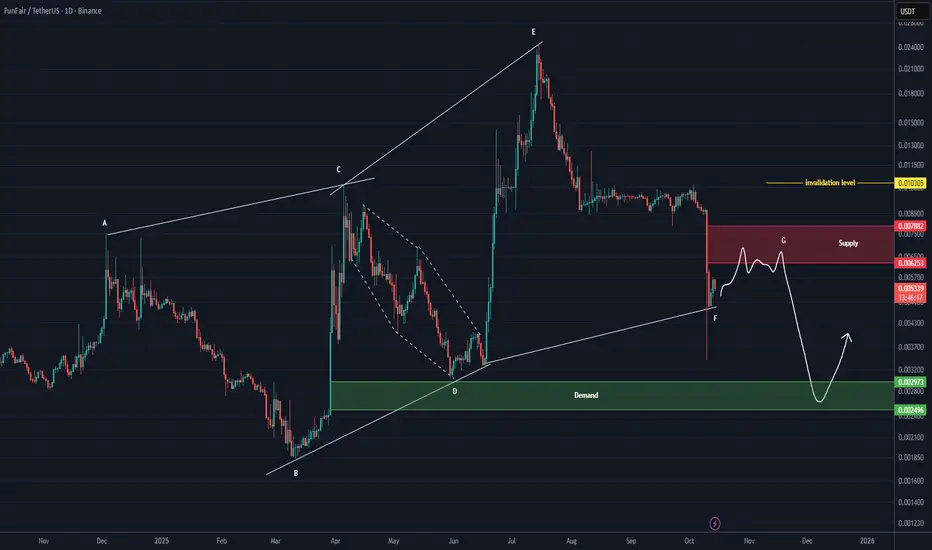
FUN Analysis (1D)It seems that the bullish diametric pattern on FUN is coming to an end. It appears that only a truncated and shortened wave G remains, which could complete after reaching the red-marked area.
A reaction is expected within the green-marked zone.
Keep in mind that the daily timeframe takes time to play out.
A daily candle closing above the invalidation level will invalidate this analysis.
For risk management, please don't forget stop loss and capital management
When we reach the first target, save some profit and then change the stop to entry
Comment if you have any questions
Thank You
AKE Analysis (4H)It seems that AKE is oscillating within a large range to absorb liquidity. It keeps forming lower highs while clinging to a weak trendline. It’s expected that this trendline will soon break, or at least the candles will retest it once more.
The best area for a price rejection—at least down to the weak trendline (which is also our liquidity pool)| is the red-marked zone.
A daily candle closing above the invalidation level will invalidate this analysis.
For risk management, please don't forget stop loss and capital management
When we reach the first target, save some profit and then change the stop to entry
Comment if you have any questions
Thank You

BCHUSDT - The bullish flag pattern might play out! Can be traded within the box 📉
Bullish flag might work — if aliens don’t dump 👽
YOU KNOW THE NAME 👱♂️🤫

42 Buy/Long Setup (30M)We have good confirmations for long buy positions around the green zone.
A bullish CH has formed on the chart, along with a solid order block, making the green zone worth the risk.
We’re also seeing good IFC movements around the higher levels.
Targets are marked on the chart.
A 4-hour candle closing below the invalidation level will invalidate this analysis.
For risk management, please don't forget stop loss and capital management
When we reach the first target, save some profit and then change the stop to entry
Comment if you have any questions
Thank You

ZORA Sell/Short Setup (2H)Add this pair to your watchlist; if it reaches our entry zone, we’ll take a position
The price shows strong confirmations for a drop | the short-term trendline has been broken, and the supportive order blocks have failed.
The market has been ranging for a while, but the price seems likely to break out to the downside.
Targets, stop-loss, and entry zone are marked on the chart.
For risk management, please don't forget stop loss and capital management
When we reach the first target, save some profit and then change the stop to entry
Comment if you have any questions
Thank You

XLMUSD — Bullish Continuation Valid While Red B HoldsFrom the top-down view, XLM completed a deep corrective structure that bottomed inside the previous WCL (blue box). The current sequence builds a new bullish cycle , with the red ABC wave mapping cleanly against both structural and liquidity geometry.
Price reacted strongly from the red BC demand zone , producing a local yellow ABC micro-sequence. The setup anticipates continuation toward the upper WCL region (0.38 – 0.42) .
The re-entry area sits near the mid-trend retest—confirmation required via MSS + FVG displacement.
Invalidation:
This idea remains bullish until the red B low is broken . Violation of that pivot voids the wave count and resumes the broader correction.
Strengths: – Multi-timeframe alignment (macro + micro)
– BC demand reaction with displacement
– Defined invalidation under red B (lowest-risk logical stop)
Weaknesses:
– Correlation drag if majors retrace
– Shallow pullbacks may induce premature MSS signals
Summary:
Bulls control the rhythm while red B stands. Break B — and the music stops.

Will #XRP Make a Bullish Move or Is this Another Bull Trap?Yello, Paradisers! Are we about to witness a major #XRPUSDT breakout, or is this just another fakeout? Let’s dive deep into the real setup on the #XRPUSD chart:
💎#XRP is currently trading around $2.65, consolidating right below a critical resistance trendline. What’s building here is a textbook ascending triangle, and the squeeze is tightening fast and moving toward an inevitable breakout.
💎A clean breakout above the resistance trendline, especially if backed by increased volume and 50EMA continuing to act as dynamic support, will significantly raise the odds of a sharp move up. The first bullish target lies at $3.10 (moderate resistance). If bulls dominate, a fast continuation toward the $3.55 strong resistance is very much on the table.
💎However, and this is key, any rejection near the resistance without solid momentum could trap breakout traders. If #Ripple drops below the ascending trendline and loses the Support Zone near $2.37, the move will likely extend into the Key Demand Zone at $2.19.
💎Below $2.19? That’s where the bullish setup gets invalidated. We would then expect a potential full breakdown, creating a cascade of stop-loss triggers and panic selling. That’s not a dip you want to buy blindly. Bulls still hold short-term momentum, but the next few candles will decide everything.
Strive for consistency, wait for clear confirmations, and remember that discipline always beats chasing quick profits.
MyCryptoParadise
iFeel the success🌴

ADAUSDT — Dual Wave ConfluenceTwo independent cycles now point to the same liquidity zone.
The wine wave (macro) has entered its BC retracement phase, and its BC target aligns perfectly with the green micro-wave’s C-target , forming a rare dual confluence at the same level. This overlap creates a liquidity magnet — a structural point where both wave systems expect equilibrium before a bullish expansion.
Price is currently reacting inside the BC demand zone , finalizing the correction before expansion toward the macro C projection at 0.7575 .
The alignment between both scales confirms that momentum and liquidity are synchronized for continuation.
Strengths :
Perfect alignment of macro BC and micro C targets
Discount entry within structural demand
Defined invalidation below BC low
High asymmetric RR toward 0.7575
Weaknesses :
Requires bullish displacement confirmation from demand zone
Possible short-term inducement before expansion
Invalidation if structure breaks below BC
Bias : Bullish continuation
Target : 0.7575 (macro C projection zone)

ASTER — OB Tap → WCL Retrace → Macro DownASTER is forming a clean ABC correction within a larger bearish structure. Price hasn’t yet tapped the order block — I expect a final dip to complete the C-leg before retracing toward the WCL zone. From there, the broader bearish wave should resume.
However, if Bitcoin continues its upward expansion, correlations could invalidate this structure and pull ASTER higher, overriding the current wave bias.
High-timeframe trend stays bearish, but intent always belongs to the present.
Strengths:
• Fractal alignment between macro and micro waves.
• Logical liquidity flow between OB and WCL.
• Flexible bias — corrective long, then macro short continuation.
Weaknesses:
• Requires precise OB tap and strong reaction.
• Bitcoin-driven expansion could neutralize bearish context.
• LTF volatility may distort confirmation signals.
SmellyTaz — decoding chaos

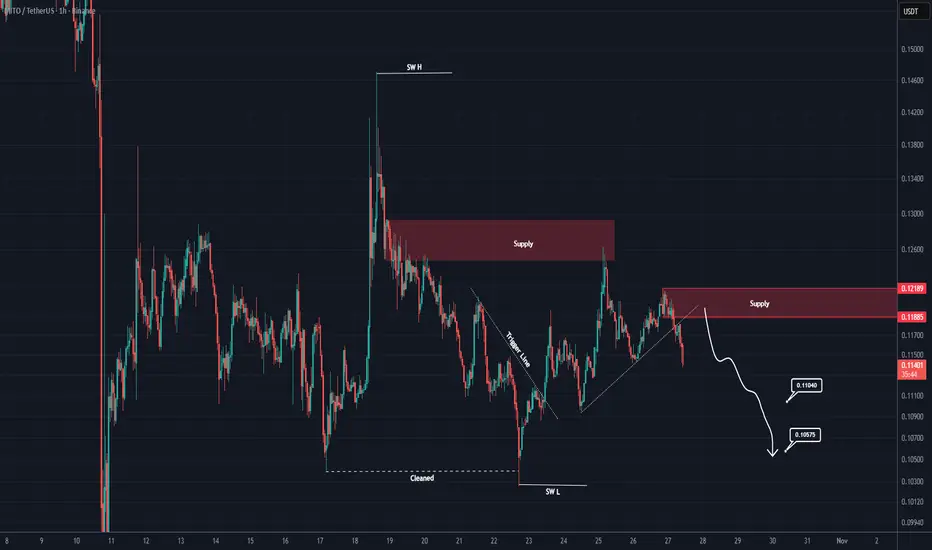
MITO New Update (1H)This analysis is an update of the analysis you see in the "Related publications" section
Be sure to manage your risk carefully; this coin is new and has high volatility
We have changed our view on this coin; it hasn’t reached our analysis entry zone yet!
Since it didn’t touch our zone and moved upward, forming and breaking out of a trendline, we’ve updated our perspective.
If there’s a pullback to the red zone, a sell/short position can be considered.
For risk management, please don't forget stop loss and capital management
When we reach the first target, save some profit and then change the stop to entry
Comment if you have any questions
Thank You
HBAR Analysis (4H)From the bottom, it seems the price is forming a corrective pattern, and we are now at the end of wave C. The price is expected to soon enter a correction for wave D or a new bearish wave.
The low-risk area for sell/short positions is the red zone.
Targets are marked on the chart.
A daily candle close below the invalidation level will invalidate this analysis.
For risk management, please don't forget stop loss and capital management
When we reach the first target, save some profit and then change the stop to entry
Comment if you have any questions
Thank You

Will #TRXUSDT Slide Down Further or Recover? Must Watch Yello Paradisers! Are you actually watching what’s developing on #TRXUSDT? Because if you’re not, you could be caught completely off guard by this sneaky bearish setup unfolding right now. Let’s break down #TRON Setup:
💎#TRX has been trading inside a textbook Ascending Channel, but that structure is breaking down fast. After losing the ascending support, the price is now retesting it as resistance — and it’s not looking good for the bulls. Adding to the pressure? The 50 EMA, which is now acting as dynamic resistance, reinforces the potential for further downside.
💎Current price of #TRXUSD is $0.30, and this level is absolutely critical. If this rejection holds and we get a clean fail from this zone, the bearish scenario becomes highly probable. Momentum is already leaning bearish, and this breakdown could trigger a deeper flush.
💎If the rejection confirms and sellers take control, we could see price cascade down toward the Support Zone at $0.26, and if that level gives way, a much more aggressive drop into the Strong Demand Zone around $0.18 becomes likely — where bigger buyers might finally show up.
💎However, this bearish structure gets invalidated if #TRX can reclaim and close above the $0.3696 resistance. A breakout above that level would trap late bears and flip the narrative bullish, with room to squeeze higher toward the $0.42 region.
Trade smart, Paradisers. This setup will reward only the disciplined.
MyCryptoParadise
iFeel the success🌴

ETH Sell/Short Setup (4H)After a strong bearish move, the price has made a solid recovery and is approaching a good supply zone.
At this level, it’s better to look for sell/short positions, as there are strong order blocks in this area that could push the price downward.
We’ve considered a 1:2 risk-to-reward ratio, and you can see the targets and stop-loss levels on the chart.
For risk management, please don't forget stop loss and capital management
When we reach the first target, save some profit and then change the stop to entry
Comment if you have any questions
Thank You

Ethereum Short-Term Breakdown Imminent | ETHUSD Short Setup🚨 Ethereum (ETHUSD) Market Update – Short-Term Setup 🚨
Ethereum is displaying clear weakness on higher levels, as the recent bounce appears to be a relief move rather than a full trend reversal. The resistance zone between $4074 – $4175 remains crucial — price rejection from this area can offer a high-probability short opportunity.
We’re currently holding short positions from $3930, and if ETH extends upward, DCA shorts will activate near $4175 for a better average entry.
📉 Downside targets to watch:
🎯 $3750
🎯 $3636
🎯 $3540
🎯 $3480
Until a confirmed correction forms, avoid aggressive long setups. Market sentiment remains fragile, and bulls may face strong resistance around the upper range.
⚠️ Timeframe: 15-Minute (Scalp / Short-Term Setup)
💡 Tip: Manage risk carefully and trail stops as price moves in your favor.
📊 Follow me on TradingView for more real-time ETH and BTC updates, short-term scalps, and market breakdowns. Your feedback and comments are always welcome!
CAKEUSDT – Potential Recovery Setup Amid BNB Ecosystem StrengthCAKE remains one of the most active decentralized exchanges by volume, maintaining strong relevance alongside UNI. With renewed bullish momentum across the BNB ecosystem, CAKE may be poised for a recovery after a recent breakdown.
Price action is approaching a key support zone between $1.93 and $2.09, which could serve as a base for accumulation. If the level holds and broader sentiment improves, this area offers a strategic long setup targeting higher resistance zones.
Upside targets are defined at $2.70 and $4.20, with a stop loss below $1.66 to manage risk. This idea hinges on stabilization in the crypto market and continued strength in BNB-related projects.
Levels:
Entry Zone: $1.93–$2.09
Targets: $2.70, $4.20
Stop Loss: Below $1.66

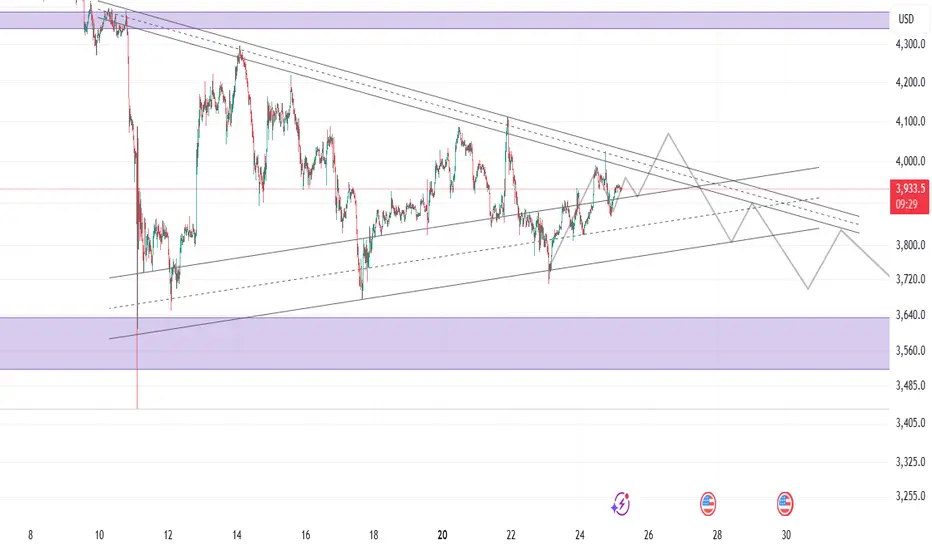
BTCUSD: Trend lost momentum, sideways within price blockBITSTAMP:BTCUSD Analysis – October 21, 2025
Overview
Yesterday, BITSTAMP:BTCUSD failed to sustain its bullish momentum and closed below the EMA, indicating that the uptrend has weakened and the market has potentially shifted back into a bearish phase.
Current structure (H4)
On the H4 timeframe, BITSTAMP:BTCUSD is moving sideways within a price block, reflecting an ongoing indecision between buyers and sellers.
At the moment, the market lacks a clear direction and is consolidating within a tight range, waiting for a breakout to define the next move.
In such a challenging and uncertain market environment, the best approach is to stay patient, wait for clear confirmation, and avoid forcing trades when price action is still unclear.
Above all, capital preservation and risk control should remain the top priority.
Trading plan
Bearish scenario:
If price consolidates with weak momentum below the EMA and near the lower boundary of the price block, we can consider short positions, following the downside momentum.
Bullish scenario:
If price moves back above the EMA, then forms a tight accumulation near the upper boundary of the price block while the EMA holds below price, this would signal that bulls are regaining control in that case, consider long positions.
Notes:
Avoid entering trades when price is still within the mid-range of the block.
Wait for clear price reactions around key boundaries.
Maintain strict risk management and limit exposure per trade.
Daniel Miller @ ZuperView

The Bitcoin bearish era has begun (1D)First of all, you should know that in our previous analyses, we had identified a large triangle. However, the market makers created another bullish wave, increasing the chart’s error margin (The scenario you see in the related ideas section.).
This sharp move indicates the beginning of new bearish branches! It is expected that with a pullback to the red zone, the correction will continue, and we will be involved in it for at least a few months.
Closing a daily candle above the invalidation level will invalidate this analysis.
For risk management, please don't forget stop loss and capital management
When we reach the first target, save some profit and then change the stop to entry
Comment if you have any questions
Thank You

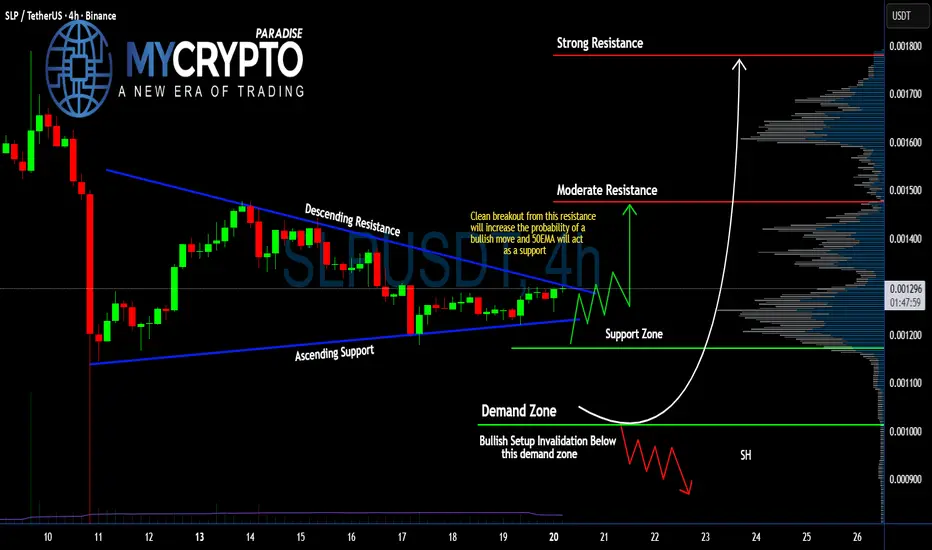
Is #SLP About to Explode Upwards or Another Trap is Set? Yello Paradisers! Are we staring at a breakout just hours away, or is #SLP setting up the perfect trap before the next rug pull? Let's break down what’s really happening with #SLPUSDT:
💎#SLPUSD is currently trading at $0.001296, and it’s stuck inside a narrowing symmetrical triangle with ascending support and descending resistance lines converging quickly. The squeeze is getting tighter, and the price is now right at the edge of a potential breakout.
💎A clean break above the descending resistance, combined with 50EMA acting as support, would significantly increase the chances of a bullish leg up. If that happens, the first target sits at moderate resistance near $0.0014, and we may see an explosive move toward the strong resistance at $0.0017 if volume supports it.
💎On the flip side, if #SmoothLovePotion gets rejected and drops below the ascending support and key demand zone around $0.0010, the bullish scenario will be invalidated. In that case, we expect a steep leg down, especially with low-volume support below. That would trap late buyers and trigger a cascade of liquidations.
💎The support zone between $0.001172–$0.001200 has already shown signs of buyer activity, and as long as we hold above it, bulls still have the upper hand in the short term. Keep an eye on how the price reacts here — it’s the true battleground.
Strive for consistency, wait for clear confirmations, and remember that discipline always beats chasing quick profits.
MyCryptoParadise
iFeel the success🌴
BITCOIN UpdateBitcoin — 104,716 POC in Play: Rotation or Breakdown?
Context
BTC remains trapped in a daily inside-bar range, digesting last week’s expansion.
Structure shows fading momentum within value, signaling a potential bearish transition.
Technical Map
• Point of Control (POC): 104,716.97 (key range Level) — line in the sand between control and collapse.
• Price Action: Low-volume compression near the POC; buyers fading as market pauses below mid-value.
• Key Target: 103,516.75 — next liquidity shelf if sellers keep pressure.
• Momentum: Bearish drift persists; initiative buying remains weak.
• Invalidation: Daily close back above 104,716 flips tone to neutral-bullish.
Fundamental Pulse
Markets are in a macro digestion phase:
• U.S. GDP & Core PCE data next week = volatility bottleneck ahead.
• Fed speaker blackout window keeps tone muted.
• Yields steady, crypto flows thin, and ETF inflows subdued — explaining the slow volume and cautious tape.
This is the classic “positioning pause” before macro catalysts hit.
Trade Plan
Below 104,716, bias remains bearish toward 103,516.75.
Mindset Pulse
The chart breathes in before it exhales volatility.
