FireHoseReel | USDT.D Compression Signals a Big Market Reaction🔥 Welcome To FireHoseReel !
Let’s dive into USDT.D analysis.
👀 USDT.D 4H Overview
USDT Dominance is trading inside a large 4H range (box) with a very strong monthly resistance at 6.605%, a key 4H and daily support at 5.859%, and a newly formed midline at 6.210%. A breakout or breakdown of any of these levels could drive a major move across the crypto market.
✍️ USDT.D Trading Scenarios
🟢 Long Scenario:
An initial long setup can be considered on a break below the 6.210% midline, allowing for a small-risk entry. If downside momentum continues and the 5.859% support is lost, a second long position can be opened, with the option to add to earlier positions if conditions allow.
🔴 Short Scenario:
A breakout above the 6.605% range high could activate short triggers across crypto assets, leading to broader market downside. A confirmed break of this level may result in a deep correction across the crypto market.
🧠 Protect your capital first. No setup is worth blowing your account. If risk isn’t controlled, profit means nothing. Trade with rules, not emotions.
Cryptocap

FireHoseReel | TOTAL2 Facing Major 4H Resistance🔥 Welcome to FireHoseReel !
Let's dive into total2 market structure.
👀 TOTAL2 4H Analysis
TOTAL2 has reached its four-hour resistance around the one point two four level and is currently showing a clear reaction and rejection from this zone. This resistance can act as a key barrier for Ethereum and ETH-based altcoins, and a breakout above it could activate their long triggers. A descending trendline has already been broken, and then TOTAL2 hit this resistance with a strong whale-sized bullish candle, which clearly highlights the importance of this level.
RSI Osilator📊
Now focus on the RSI oscillator: it is currently sitting near its local top, and the four-hour overbought level has reached the same area as the resistance. This creates a strong overlap between momentum and price resistance. If the RSI pushes beyond this momentum limit together with a clean breakout of the resistance zone, the market could see a much stronger acceleration.
Triggers Zone 🎯
The short trigger for TOTAL2 is located lower at the support zone. A breakdown below this area could push TOTAL2 lower and lead to a deeper market correction. On the upside, a clean break of the resistance zone would confirm bullish continuation for ETH and related altcoins.
🛞 Risk Management & Disclaimer
Please remember to always use proper risk management and position sizing. Nothing in this analysis is financial advice. The market can change quickly, so always trade based on your own strategy, research, and risk tolerance. You are fully responsible for your own trades.

FireHoseReel | Crypto Cap Rising TOTAL Signals Risk On Mode🔥 Welcome FireHoseReel !
Let’s explore the latest TOTAL market setup.
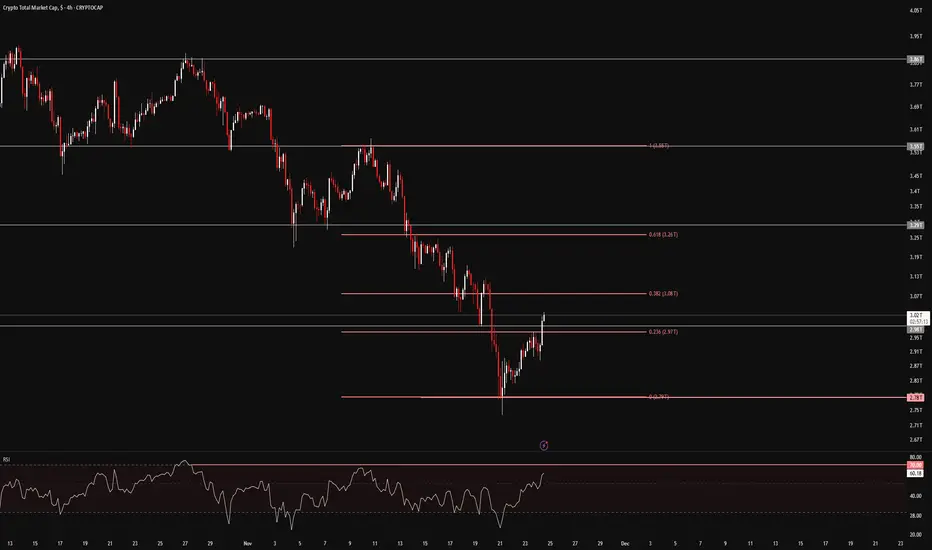
👀 TOTAL – 4H Timeframe Analysis
On the 4-hour chart, TOTAL shows the overall inflow of capital into the crypto market.
Price has successfully broken the 23% Fibonacci retracement level and is now moving toward the 38% zone.
If the 38% level breaks, traders who entered from lower supports can safely add to their position.
📊 RSI Momentum Check
The RSI has crossed above its previous high and has already moved above the 50 level, showing growing bullish momentum.
The next major RSI resistance sits around 70, which aligns perfectly with the 38% Fibonacci level, creating a strong confluence zone.
✔️ Correlation With Bitcoin
TOTAL shows a clear positive convergence with Bitcoin’s chart—both have built strong support levels and are pushing upward.
Institutional investors appear to have formed a solid accumulation base in this area, and the latest confirmations indicate this zone is becoming a reliable bottom.
With capital flowing into the crypto market and Bitcoin gaining momentum, the next moves across the market could be very powerful.
🛞 Risk Management & Disclaimer
Please remember to always use proper risk management and position sizing. Nothing in this analysis is financial advice. The market can change quickly, so always trade based on your own strategy, research, and risk tolerance. You are fully responsible for your own trades.
FireHoseReel | Total3: One Breakout Could Flip the Entire Market🔥 Welcome FireHoseReel !
Let’s break down what’s happening with TOTAL3 and see how the altcoin market is shaping up right now.
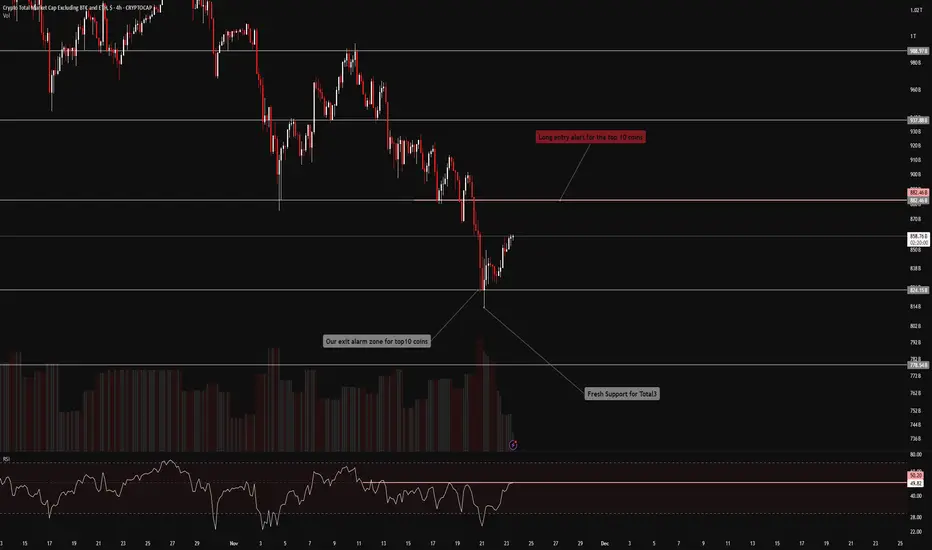
⭐ TOTAL3 Market Structure Update
The altcoin market (TOTAL3) has formed a solid support base around $824B after the recent pullback and is now pushing upward toward its major resistance at $882B.
A clean breakout above this zone could spark a broader bullish continuation, activate long triggers across top altcoins, and shift the market into a risk-on phase.
📊 RSI Momentum
The RSI is currently battling the 50 level, which has repeatedly acted as strong static resistance.
A confirmed breakout above RSI 50 would strengthen bullish momentum and support upward continuation — most likely during the China open session, where volatility usually increases.
🎯Impact on Top Altcoins
If USDT dominance declines, the top altcoins are likely to gain momentum quickly.
This can accelerate breakouts, create strong bullish impulses, and open up high-probability profit opportunities as liquidity rotates back into alts.
🧭 Trading Perspective
This is the kind of environment where staying close to the charts is essential.
Wait for index confirmations before entering new positions.
A potential altcoin rally could begin from these zones — and with proper risk management, layered entries across multiple altcoins can be highly effective.
🛞 Risk Management & Disclaimer
Please remember to always use proper risk management and position sizing. Nothing in this analysis is financial advice. The market can change quickly, so always trade based on your own strategy, research, and risk tolerance. You are fully responsible for your own trades.
FireHoseReel | USDT Dominance & BTC Dominance Overview😄 Hey! How’s everything? Hope you’re doing great!
🍾 Welcome to FireHoseReel — make sure to follow and enjoy the analysis along the way.
If you ever want a custom chart breakdown, just leave a comment and I’ve got you.
😎 Let’s dive into the analysis of two major crypto dominances: USDT and Bitcoin.
✔️ USDT Dominance Technical Analysis
• On the 4-hour timeframe of USDT dominance, we can see that after repeatedly breaking through multiple resistance levels on the chart, USDT.D has reached a point of heavy overbought conditions. It’s now sitting at a strong resistance zone.
If this resistance breaks, USDT dominance could push even higher, which would bring additional downward pressure on the market, especially on Bitcoin and altcoins, leading to another wave of selling.
• If USDT dominance rejects from this zone and starts moving downward, the nearest support to be tested is around 6.148%. Losing this support would signal the beginning of the first bullish wave in the market, giving us a potential opportunity to start opening long positions once this level breaks down.
• Another key level is the resistance at 6.623%.
If USDT dominance breaks above this level, it could trigger an even stronger bearish wave compared to the previous one, causing a deeper correction across the market.
✔️ BTC Dominance Technical Analysis
• On the 4-hour timeframe of Bitcoin dominance, we can see that after the recent market drop, BTC.D also moved downward and went through a relatively deep correction.
What’s important here is that despite the decline in Bitcoin dominance, altcoins did not experience a heavy correction, and most of them held their levels without major downside movement.
• If Bitcoin dominance loses the 58.80% level, it could extend its correction even further.
However, the key reversal zone for the 4-hour trend lies at 59.31%. A breakout above this level can trigger a solid bullish wave in BTC.D.
• Our confirmation for this bullish wave would be the formation of a higher low above this resistance zone, signaling a potential upward trend continuation.
🛞 Risk Management & Disclaimer
Please remember to always use proper risk management and position sizing. Nothing in this analysis is financial advice. The market can change quickly, so always trade based on your own strategy, research, and risk tolerance. You are fully responsible for your own trades.

USDT.D 1H Analysis - Key Triggers Ahead❄️ Welcome to the cryptos winter , I hope you’ve started your day well.
⏰ We’re analyzing CRYPTOCAP:USDT.D on the 1-Hour timeframe .
👀 On the 1-hour timeframe, Tether Dominance moved upward after breaking above the 4.46% level. However, buyers were unable to push through the 4.72% resistance, and the market reacted (rejected) at that zone. This reaction formed a multi-timeframe consolidation box. The top and bottom of this box now act as key levels to determine the next market direction:
Break above 4.72% ➝ Potential for deeper correction in the crypto market.
Break below 4.46% ➝ Possible trend reversal and confirmation of renewed upside momentum.
The market is currently in a low-volume weekend phase, and price action is range-bound. With the start of the new week, there’s a higher probability of breaking out of this consolidation.
🧮 The RSI oscillator shows that after reaching the overbuy zone, price couldn’t sustain time there and was quickly rejected, forming the current market floor. Another key RSI level is around 44, which aligns with the 4.46% support. If momentum crosses below this zone, volatility could increase and trigger the next leg of movement.
🕯 On the 1-hour chart, there have been numerous green candles, indicating a deeper market correction as earlier buyers take profit and sell. This move continued until the 4.72% resistance, and the current range structure shows:
Red candles slightly larger
Green candles more frequent but smaller
This signals weakening bullish momentum, increasing the likelihood of a break below the 4.46% support.
🧠 With the current sideways structure, two main scenarios are in play:
1️⃣ Breakdown of the lower boundary (4.46%)
Could trigger a strong bullish leg in crypto, pushing the market upward.
If this happens, it could be an ideal scenario, supporting a broader crypto rally.
2️⃣ Breakout above the upper boundary (4.72%)
Would likely lead to a deeper correction across the market.
This scenario could result in significant drops in Bitcoin and Ethereum.
Keep both the ceiling and floor of Tether Dominance in mind as the new week begins. The current range is relatively narrow, meaning a breakout could even occur as early as tomorrow during the New York session.
❤️ Disclaimer : This analysis is purely based on my personal opinion and I only trade if the stated triggers are activated .

USDT.D 1H Analysis - Key Triggers Ahead👋🏻 Hey everyone! How’s it going? Hope you’re all doing well.
❄️ Welcome to Crypto Winter.
⏰ Today, we’ll be analyzing USDT.D and exploring its potential opportunities.
👀 On the 1H timeframe of USDT dominance, we noticed that after touching the support zone, we were expecting a breakdown. However, with a fake-out, it reversed and is now correcting upwards. The next resistance for USDT dominance could be around 4.34%.
🧮 The RSI oscillator is approaching the key level around 70 (overbuy zone). If USDT dominance enters this area, it could trigger a deeper correction in the market.
🕯 The green candles in USDT dominance (profit-taking and closing of long contracts) are gradually increasing. We should watch closely how these candles react as we approach the 4.34% resistance level.
🧠 Since we don’t want to open shorts here, the best strategy is to wait and see how USDT dominance reacts before entering any positions. This is very important. In the meantime, we can build a watchlist and focus on other setups.
❤️ Disclaimer : This analysis is purely based on my personal opinion and I only trade if the stated triggers are activated .

Others.d 4H Analysis - key Triggers Ahead👋🏻 Hey everyone! How’s it going? Hope you’re all doing well.
❄️ Welcome to Crypto Winter.
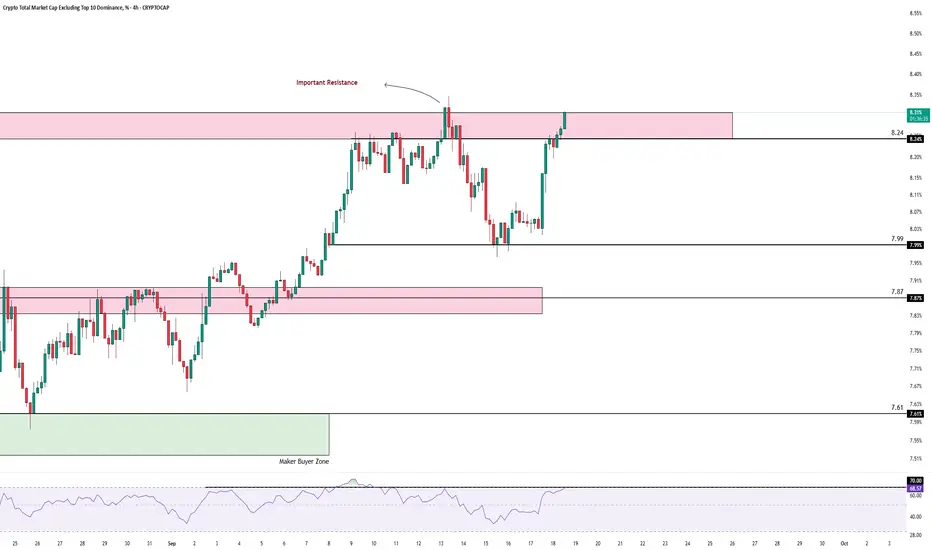
⏰ Today, we’ll be analyzing Others.d and exploring its potential opportunities.
👀 On the 4H timeframe, looking at the Others.D index, we can see that this index moves inversely to Bitcoin dominance (BTC.D) and Tether dominance (USDT.D). It reflects the capital flow into altcoins (excluding BTC and ETH). Currently, it has been consolidating inside a tight box structure. After breaking above the seller’s trigger zone — the top of the box — at 7.87%, it moved upward but got rejected at the 8.3% resistance.
💡 After the rejection, it formed a higher low compared to the previous one, showing respect from buyers. Momentum then picked up quickly, pushing the price back toward the 8.3% resistance with fewer green candles but stronger momentum. We are now retesting this resistance, and a confirmed breakout here could serve as a first small confirmation for a potential altcoin bull run.
🧮 Looking at the RSI oscillator, one critical level stands out: the 70 overbought zone. Considering the recent positive economic data, which fueled capital inflows into equities, this level gains even more weight. It may provide further support for Others.D cap to push higher.
🕯 After breaking out of the box, candle size and volume looked normal, but at the formation of the higher low, buyers strongly respected that level — suddenly the candle size increased sharply, showing FOMO from buyers and fresh capital entering risk assets.
🧠 We now have multiple confirmations for a possible breakout and stabilization above this resistance. If it happens, several altcoins with strong setups should be on the watchlist for entries. A clean breakout could also provide the green light to open long-term futures positions on altcoins, as a stronger rally may follow.
❤️ Disclaimer : This analysis is purely based on my personal opinion and I only trade if the stated triggers are activated .
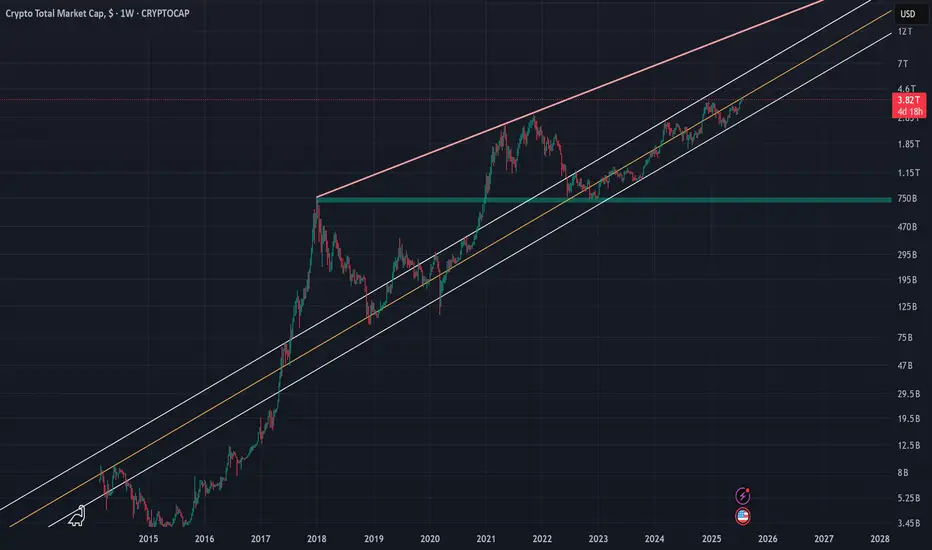
Crypto Total Market Cap (TOTAL) | 1WThe crypto market cap represented by the symbol TOTAL can be considered the most important index for analyzing the cryptocurrency market, although I believe that analyzing Bitcoin itself, given its strong positive correlation with the TOTAL index, would yield similar results. In the attached image, the red line actually indicates the overall resistance level of the symbol, and the drawn parallel channel illustrates the current upward trend of the TOTAL symbol, which is now on the verge of encountering its round resistance at 4 trillion dollars. While we should expect a correction around this level, breaking through the 4 trillion dollar resistance could likely lead to a market cap of 6 to 7 trillion dollars in the next phase. On the other hand, with support at 2.4 trillion dollars based on the 100-week SMA on the weekly timeframe, the 750 billion dollar level—marked by a green zone in the image—can still be considered the most important long-term market support, even before the fifth halving.
I will try to continuously update this analysis of the TOTAL symbol according to market changes and developments. Also, I welcome reading your critiques and comments, so don’t forget to leave a comment!
ETH Charging Familiar Resistance
We’re looking at ETH Cryptocap (left) and ETHUSDT (right), both on the daily timeframe.
ETH Cryptocap has just touched the 0.236 Fib level, and ETHUSDT is only a few dollars away from it.
Since March 2024, this level has consistently acted as resistance — each time price crossed it, it eventually retraced after hovering briefly above.
Will this time be different?
What’s clearly different now is volume : it’s rising along with price.
In the past 10 days, there’s only been one red volume candle, and even that was minor.
Meanwhile, RSI is firmly in the overbought zone.
I don’t know if ETH will go higher or start retracing, but I can prepare for both.
The simple solution: place a trailing take-profit order and let price move.
If it pulls back, I’ll lock in some gains.
If it keeps climbing, I’ll stay with the trend.
For me, everything else is just unnecessary complication.
Always take profits and manage risk.
Interaction is welcome.

TOTALCAP — The Next Trillion Crypto Move: Are You Ready?When people analyse the crypto market, they often default to Bitcoin and for good reason. It’s the one and only, the king. But sometimes, to see the forest instead of just the tree, you need to zoom out and study the broader picture.
That’s where the Crypto Total Market Cap (TOTALCAP) chart comes in. It’s essentially the mirror of Bitcoin, but it offers powerful macro insight — not just price, but scale. Looking at trillions instead of dollars changes how you frame support, resistance, and overall sentiment. Let’s dive in.
🧠 Why TOTALCAP Matters
TOTALCAP aggregates the value of every coin and token — the complete valuation of the entire crypto industry.
And while it often moves in sync with Bitcoin, it carries a different weight.
Shows the “big picture” of institutional and retail money flow
Offers clearly defined round-number zones (Trillions) as psychological S/R
Removes coin-specific anomalies and focuses on collective momentum
In bull and bear markets, these trillion-dollar thresholds act like major checkpoints. Watching how TOTALCAP interacts with these levels can give early signals that BTC or alts alone can’t.
Historical Key Levels & Structure
Let’s break it down by macro phases:
✅ November 2021 — Peak of Last Bull Market:
TOTALCAP peaked exactly at $3 Trillion.
This level acted as a ceiling — once hit, the market reversed sharply.
This marked the top of the 5-wave impulsive move (Elliott Wave theory).
📉 November 2022 — Bear Market Bottom:
TOTALCAP dropped below $1 Trillion, bottoming at $727 Billion.
This was almost a 0.786 fib retracement from peak — similar to BTC’s historical retracements.
The $1T mark was retested as resistance before being reclaimed as support.
📈 2023–2025 — The Bull Awakens:
$1 Trillion flipped into solid support throughout 2023.
A clear sign the macro market structure had shifted bullish.
Once $2T was breached, things moved fast.
🚀 Current State:
The market surged above the previous $3T ceiling.
TOTALCAP has hit a new ATH: $3.73 Trillion
Now, the question is: Is this the start of a new leg higher, or a bull trap before a correction?
🔍 Fibonacci Confluences — Why $3.7T Was Key
The sharp rejection at $3.7T wasn’t random. It aligns with:
1.0 Trend-Based Fib Extension: From 91.24B → 3T high → 727B low = 1.0 = 3.65T ✅ precise hit
1.272 Fib Extension of the macro move
Upper Pitchfork Resistance
Channel Top Rejection
→ All signals converged to mark that level as major resistance
🌀 Elliott Wave Macro Count
Looking at the weekly timeframe, we can see a clear impulsive 5-wave movement from the 2022 lows:
Wave 1: $727B → $1.26T
Wave 2: Correction to $975B ($1T) (support confirmed)
Wave 3: Massive rally toward $2.72T
Wave 4: Pullback toward $1.69T (VWAP retest)
Wave 5: $3.73T ATH
What does this imply?
According to classical Elliott Wave theory, after a full 5-wave move, the market tends to enter an corrective phase.
🔍 Some key levels to watch:
$3T: Historical S/R (was the 2021 top, now acting as a key level)
$2.31T: Recent swing low
$2T: Psychological and structural support
📌 Zone of Interest for Longs: $2.31T–$2T
This zone holds:
Previous consolidation zone from mid-2024
Fib retracement confluence
Likely forming Wave C bottom if this is a full ABC
🎯 Upside Targets — What If We Continue Higher?
Looking ahead:
🔸 1.618–1.666 Fib Extension = $4.42T–$4.53T
🔸 1.618 TBFE from previous cycle = ~$5.45T
📌 Rounded Targets: $4.5T, $5T and $5.5T
These are the next likely macro cycle targets — but only after a healthy correction and consolidation.
☀️ Macro Context & Summer Seasonality
Historically, summer tends to be a weaker period:
Lower volume
Institutional rebalancing
Geopolitical and macroeconomic uncertainty
📚 Educational Insight: TOTALCAP as a Tool
Treat TOTALCAP like the S&P500 of crypto.
Use round trillions as psychological levels: 1T, 2T, 3T, etc.
Always check if BTC’s price is aligned with where TOTALCAP is on the macro structure
Helps judge market strength even when BTC dominance is shifting
It’s especially useful when altcoins pump or dump out of sync with BTC — you can use TOTALCAP to track the real flow of money.
💡 Final Thoughts
We are likely in a corrective phase after a complete 5-wave cycle.
The area between $2.31T and $2T offers high-probability long entries
Watching how TOTALCAP reacts to these levels will help us anticipate the broader market’s next move
Summer slowdown could mean chop — but this also creates opportunities
💬 Let me know your thoughts: Are we entering a deeper correction? Or will TOTALCAP surprise us with a new leg higher?
Don’t forget to zoom out. The charts always tell the story.
_________________________________
💬 If you found this helpful, drop a like and comment!
Want breakdowns of other charts? Leave your requests below.

TOTAL2 - Breaking the Down ChannelThis is the 2Hr chart and I have plotted some green bars pattern suggesting a reversal out of this down channel
The down channel is due for reversal and price is settling at the lower band of the channel
I think the move up will be quick, very quick.
Expecting a day where there is 100% moves across the board for altcoins.
Again the 2Hr chart this is.

TOTAL2 - Big VolumeThe volume on the altcoin market is massive
a lot is being bought up
Expect price up to follow
Weekly timeframe

XRP Market Cap Creates New All Time High; Likely to ContinueImpressive. Market cap in November alone has gone on to gain 326%. XRP went from the number 8 spot back up to the number 3 spot with extreme swiftness.

TOTAL CRYPTO TICKER - moving average linesAll the moving average lines are in order and underneath the price of cryptocurrency, bitcoin too. If so, the signal would mean the price will maintain and continue forth onward to the new year. The potential for the market cap of cryptocurrency to double may be in the cards, the loftiness of trillions of dollars swelling cryptocurrency is a much tougher sell than Bitcoin, ideally. For all those active investors and active social viewers this post is of the utmost simplicity based on the simple method of keeping ideas useful.

CryptoCap - BTC - Bitcoin Idea IIhey guys,
the yearly chart is bullish - main target was the recent ATH at 1.3T.
Quarterly Chart: After the break of the 1.3T Line theres a close below it
-> leaving a bit of doubt about imminent bullish progression or a potential double top forming here. The Inside bar is giving a warning of a possible reversal.
Monthly Chart: Although the demand Line is still intact there is a little divergence on the stochastic
-> there is weakness of 3 months not being able to penetrate highs - but going into a Consolidation.
-> BTC is testing a bullish trendline which, ones it has been broken by a close of the monthly candle, could provide a bearish setup and a possible double top scenario being in place.
I will wait for a break of the Consolidation to think about entering a trade.
Thanks for reading…

CryptoCap - ETH / Ethereum - Idea II - Triangle PlayHey guys,
yearly chart: bullish setup with targets around 435 and 577. (recent ATHs on closing base and by wick )
Quarterly: After a strong Q1 gain we see a trading back below 435 printing an inside bar... : bearish setup at a strong resistance level. Range of this quarter will be monitored closely on the 3D chart.
Monthly: 4 Months of weakness - with the last one not being able to reach the highs of the range.
-> Stochastic is turning down after forming a double top
-> Bullish trendline is still intact. It seems to be the last support before the lower high scenario will be in play. - alternatively looking at the triangle: waiting for a break of this structure and a retest
3D: very interesting. we see a consolidation of course - but there might be a fractal in play if you compare the 3D to the monthly chart.
However, I am seeing a bearish setup with an invalidation above 435. - keeping in mind that the yearly is still pointing up so we could easily be going just up from here.
thanks for reading…

TOTAL 2 Cycles SynchronizationHere is the Cycles Synchronization of Crypto Total Market Cap Excluding BTC (TOTAL 2). At some point, between mid november and mid december 2025, I do expect around 3.5T Market Cap to be the top for the cycle. 1 year later, the Market Cap could be at around 1.5T, I think.
Will follow with interes...


Bearish 5-0 on (Total 3 Excluding - LTC and Stablecoins)There is a Bearish 5-0 visible on the Daily on the Total Market Cap Ex- BTC, ETH, LTC, and the two big USD-based Stable Coins; if it plays out, I think Total 3 will make a new low that will likely take it down to the macro 0.886.
We also have some Hidden Bearish Divergence on the RSI to back it up.

Crypto Total Cap w/ BTC & ETH Adj Realized CapIn this quick idea we have a look at the total crypto market cap with BTC & ETH adjusted realized cap overlayed in the main pane. This chart uses both market and on-chain data.
Total Crypto Market Cap:
The red/green bars displayed
BTC
BTC Adjusted Realized Cap: The light gray line.
BTC Adjusted Market Top Projection: The light red line.
BTC Adjusted Realized Base: The orange line.
ETH
ETH Adjusted Realized Cap: The dark gray line.
ETH Adjusted Market Top Projection: The dark red line.
ETH Adjusted Realized Base: The yellow line.
Below the main pain we have the DB ZPS RSI (length 2) for the total market cap on a 4 month timeframe which shows the overall crypto market cycle.
On the bottom pain we have the DB ZPS RSI (length 2) for the total market cap on a monthly timeframe which shows the local cycles.
The aim of this idea is to show a clear picture of the total crypto cap with comparison to BTC and ETH realized cap timeframes. IMO this chart is interesting as it shows the cap cycles and displays the BTC to ETH cap and tops.
I hope ya'll find it useful! Cheers!

Total Market Ranging Between Two ImbalancesLots of traps either way but notice the big picture. We could easily go way down to finish out the imbalance area below 905 trillion. We sfp'd (swing failure pattern'ed) to the top of the imbalance area already but still seem to gravitate towards the golden pocket. Will update soon.

BTC DOMINANCE Below this level, the alt season starts!BTC Dominance has a clear Support Zone inside 39.70% - 38.90%. This has been holding for almost 2 years.
The white line is the Total Crypto market cap excluding Bitcoin and Ethereum. Mostly negatively correlated to BTC Dom.
A break under the BTC Dominance Support Zone starts the alt season.
Follow us, like the idea and leave a comment below!!
