ALTS ARE GOING TO EXPLODEThis is not a drill, repeat not a drill altcoin season is about to start, when this monthly resistance is broken be prepared for insane gains. This aligns perfectly with the BTC.D chart 2020 your wildest dreams will come true.
Cryptocap

Crypto Total Market Cap Exclude BTC (TOTAL2)Beyond the 67.6148 point, it confirms the transfer of funds.
This week's flow may indicate whether the price will stay above the 67.6148 point and rise above the downtrend line.
Since the funds did not increase exponentially, they can fall below the 67.6148 point at any time.
I expect funds to go well and rise above the downtrend line.
TOTAL2's own inflection date is around November 21.

XRP Dominance (XRP.D)XRP's dominance is again challenging the 5.99 point, which is considered a sign of the uptrend.
It is expected to touch 200MA soon.
XRP's dominance would have to rise above 8.04 to get to the Alt bull market.

Market Cap USDT Dominance (USDT.D)As of October 6th, MACD has been reversed, showing a declining moisturizing effect.
Touching Ichimoku's baseline and rising, touching 20MA again and falling.
This is expected to continue and eventually fall below Ichimoku's baseline.
USDT should maintain its dominance by dropping 1.7 points, and if the price falls below 1.43, then it is expected to gain momentum.

Bitcoin Dominance Update ( BTC.D) i uploaded chart on my channel on sep 18
and now bitcoin is following the chart perfect let's fuck this support and go down we need alts party

Crypto Total Market Cap Exclude BTC (TOTAL2)This is a chart of funds of the entire coin market after minus BTC.
Touch the light blue uptrend line and it is rising.
The day when the downtrend line and the uptrend line meet is around December 4, 2019.
I think it's a chart that tells if the movement of funds is moving from BTC to Alt.
We hope to climb beyond 67.614B to form the basis for the Alt bull market.
Let's see what happens with the transfer of funds on the upcoming BTC inflection day.

Market Cap BTC Dominace (BTC.D)The dominance of BTC is slowly falling.
A decrease in BTC's dominance does not necessarily mean that BTC's price falls.
When the dominance of BTC falls, we need to see where the money goes.
Funds should not move to stablecoins, but should move to altcoins to start the bull market everyone wanted.
BTC's dominance should fall and Alt's dominance will rise until new money comes into the coin market.

Crypto Total Market Cap $ (Total)The funds of the whole coin market touched the light blue upward trend line.
In addition, the 20MA diagram was touched.
We may see if we will cross the uptrend line around October 15, the first inflection day.

Market Cap ETH Dominance (ETH.D)ETH's dominance is rising above the margin line.
Hopefully, it will be well funded and rise to 10.99, leading to the alt rally.

Crypto Total Market Cap (Total)This is the total flow of funds in the coin market.
We should see if there will be a change in the flow of funds around October 15.

Market Cap USDT Dominance (USDT.D)There is a lot of funds in USDT at present.
The direction of the coin market will change depending on where this fund moves.
As USDT dominance falls below 1.7, the coin market is expected to move.
I just hope USDT will not update the maximum price.

Market Cap XRP Dominance (XRP.D)Like XRP chart, XRP Dominance chart is rising.
It is hard to say that XRP's dominance has temporarily increased due to BTC price drops.
After touching the light blue upward trend line, it shows the upward trend and is expected to reach 5.99, the first transition point.
I think the upward trend is from 8.04 and above.

Market Cap ETH Dominance (ETH.D)Dominance is expected to remain above 9.30 and maintain an upward trend above 10.99.

ALTCOIN Market Cap. Impressive Symmetry.This is just a quick reference to where the alt market may be heading after Bitcoin's latest sell off.
To me it is impressive how the market managed to follow a downtrend that symmetrical to the uptrend of January - June.
Do you think it can go all the way down to fill the pattern? Personally I see the next symmetrical Support levels as strong candidates for the start of the next uptrend based on a comparison with the previous Bull Cycle. Also the 1D MA50 should start reversing around 50.50 if it follows the symmetry.

TOTAL Cryptocurrency Market Capitalization | Keeping It Simple!Let's take a look at the TOTAL (Crypto Total Market Cap.) chart, which measures the total cryptocurrency market capitalization (Bitcoin + Altcoins).
Today I want to keep it simple, knowing that simple is best.
We are going to direct our attention to the major support and resistance this index is facing... Let's get started:
1) We have the Major trendline working as resistance (brown). If TOTAL moves above this line, it can easily go higher. The main resistance levels after the trendline are marked with a magenta line.
2) We have the Major support marked with a blue dotted line. This line has been holding TOTAL for the past few months. Breaking below would send the price lower... The dashed blue lines are the main support after.
Finally, we have the flue triangle which is the consolidation space. Within this triangle, the price can move up and down until it reaches the apex and a breakout happens.
Feeling the market
We believe TOTAL can move a bit lower while Bitcoin retraces and altcoins grow to finally grow big when the alts and Bitcoin both move up.
I am expecting to see massive marketwide bullish action in late September or after the 15-18 Sept. 2019.
Where do you think the altcoins market is headed?
Share your charts and thoughts on the comments section below.
This is Alan Masters.
Thanks a lot for your continued support.
Namaste.

Lets see how total market cap changes with bakkt launchTracking total crypto market cap leading up to bakkt deposits and live trading.


Alt Season ahead.. 70% sale across the board Hi all
Here is a new possibility :
Seems like alts are lagging a bit behind BTC, but this is not a problem. See how nicely it is warming up to violently leave the bullish triangle.
At some point BTC will need to take a breather, and retrace. That means all the billions are moving somewhere, and a lot of that will be going into the altcoins.
BTC sure has shown again who is boss. Now people are FUDDING all about altcoins, shitcoins are going to zero. yeah, yeah, yeah. They dont know it, but what they are actually saying is buy alts, buy alts !
Do you remember in jan 2018, when everybody was saying BTC is dying, BTC dominance is falling and will never recover. The fappening. Oh, i mean The flippening, i mean the flippening. I dont know what that other thing i said is, I swear.
Dont listen to FUD like this.
Some rat once said : Be greedy when others are fearful, and fearful when others are greedy. Its natural to feel fear when we see so much money flow from alts and into btc, the point is to not let those emotions run our actions. It can be said even better: When I feel fear, I should act greedy. When I feel greed, I should act fearful. Suck on that insight, rat, I swear its not poison.
This is not financial advice to anyone, as I dont run around giving advice to strangers online. It is advice to my present self, from my near future self, telling myself a little secret, that ALTS are really really a bargain now. I am not telling myself about 20% gains, im telling myself about 100% 200% 300%.
ONE MILLION GAINS !

Altcoins, primed to EXPLODEJust watching the dominance charts on 'shitcoins'
A large wedge pattern has formed as altcoin dominance repeatedly tests the 5-6% level
This coincides with high in 2016, followed by a cupping action and the massive altcoin explosion in 2017.
Are we retesting the previous resistance as the new support level?
Here we see a huge RSI divergence forming - could this be a sign for reversal?
Are we primed for a huge altcoin party?
Fundamentals are quite bearish given the number of scams and failed projects, and slow adoption.
But overall technicals is printing bullish signs. You be the judge :)

FIDELITY BOUGHT THE DIP-Buffett bought the bottom Basil underestimated the top
- USDT Support BTC resistance
- Fidelity Investments
- ETH Futures
- Corporate coins
- BNB - TRX - EOS - XRP - XLM - Inflation perceived deflation devices strong in top rankers
- BCH ABC BCH SV - BCH Wash trade perceived hash war
- Novogratz is Bullish - 11/05/19 Expressing market euphoria on news
- Melted through Liquidity like a hot knife through butter. Big fills low spread
-Volume ATH
- Wide range retail stop run
- Demand zone high enough at 100B to create swift Double bottom scenario
Basil

Alt coin season about to bloom?Looking at the total market cap, excluding Bitcoin, alt coins can be seen approaching the end of a wedge.
My guess though is the Alts are about to take off and very soon.
This same chart, on the weekly shows a very compressed wedge.
Various alt coins are at their geometric and mathematical lows, primed for a breakout.
Breakout could be either before the close of this weekly candle or the next.
Good luck to all!

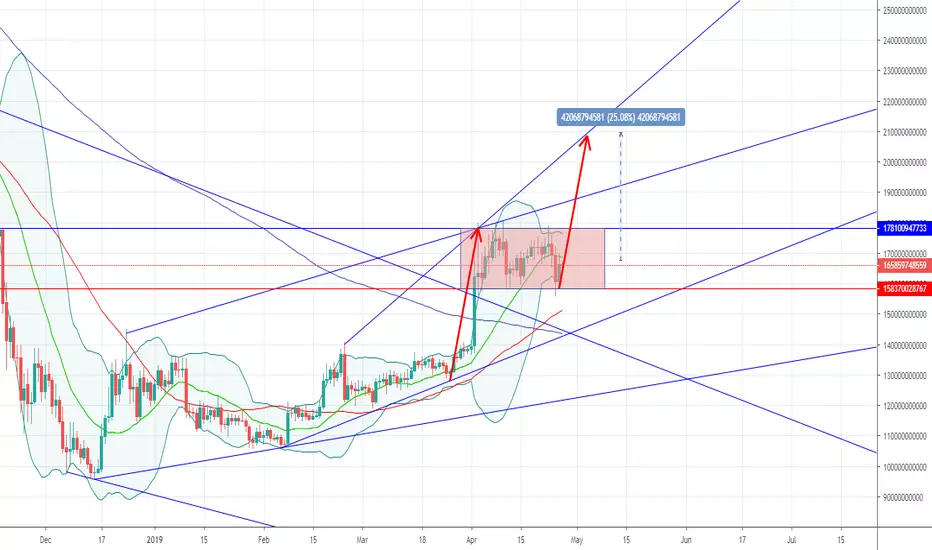
Total Crypto Cap Analytic (27 April)Market Cap stucks inside a Red Box, it nearly forms a Bullish Channel pattern moving in a Uptrend.
My expectation is to increase by 25%
Our plan will fail if any candlesticks close outside and under the box. The bottom of the box is red line
Market Cap can increase as fast as the end of March from 26 March to 2 April. First, Altcoin increased strongly like BTC but after 2 April, was a series of endless RED days until today
A look at the entire cryptomarket marketcap's falling wedgewe can see here on the weekly chart of the entire crypto marketcap that the market is very much so inside a falling wedge...one that seems to reach its apex in the middle of march....but as with most falling wedges a breakout from the wedge tends to happen very soon after 3/4ths of the wedge has completed so a breakout can be anticipated sometime within the next few weeks. we can see the 200 weekly moving average in blue for the cryptomarket has been holding very strong support the past few weeks...if this 200 week simple ma holds then we could breakout of the wedge in the next 2 weeks...if that's the case then the bottom is essentially already in...if it doesn't hold and dips below the next likely target is a double bottom on the horizontal teal trendline we have already touched once. Any dip that could happen below that would likely just be a big bounce up off the bottom trendline of the falling wedge. Once we trigger a break upward from the wedge the bottom of the bear market will almost certainly be in. A breakout fakeout candle followed by capitulation is also a possibility to consider so its wise to make absolutely sure the breakout is validated before jumping to conclusion.
