When Liquidity Dried Up — The True Story Behind the Oct 10 Crash█ We Actually Saw It Coming
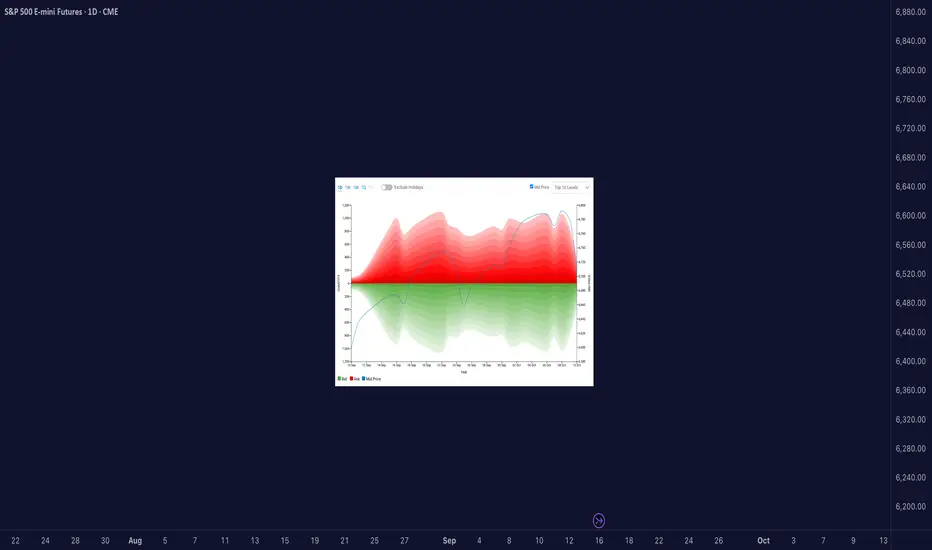
There were clear signs of potential reversals across major markets before the Friday, October 10, 2025 crash. You can see it in the liquidity heatmaps: Gold, Bitcoin, S&P, and other futures all trading above their top 10 liquidity levels.
When that happens, it’s usually a warning flag. Price is moving into areas with less visible liquidity, meaning fewer resting orders available to absorb aggressive buyers. That’s when the market becomes fragile and doesn’t take much to trigger a sharp reversal.
█ When Price Trades Beyond Visible Liquidity
It’s easy to think big moves happen just because of news, but beneath the surface, microstructure signals often show when markets are already vulnerable.
One of the clearest is when the mid-price extends beyond the visible liquidity, above the top few ask levels or below the top few bid levels in the order book.
Suppose price pushes beyond the visible top levels. In that case, it often means that liquidity was consumed faster than it could replenish, either because aggressive orders cleared it out, or market makers pulled their quotes. That’s when we get what’s called a liquidity vacuum.
Research from the Federal Reserve, Bank for International Settlements, and academic studies (Lo & Hall, 2014; Meldrum & Sokolinskiy, 2025) all point to the same thing:
When order book depth is shallow, markets become more fragile. Prices overreact, spreads widen, and shocks travel faster.
█ What the Heatmap Really Shows
Those heatmaps are a visual snapshot of this structure.
The green and red bands show the depth of buy and sell orders — the liquidity zones.
The blue line is the mid-price — the true current market price.
When the blue line (mid-price) moves above the red zone, it means price has traded beyond the top available asks. That can happen because:
Buyers lifted all nearby sell orders (aggressive buying), or
Sellers pulled liquidity (passive withdrawal).
In both cases, the effect is the same, the book thins out, and volatility risk increases.
Heatmaps don’t show everything though. They don’t reveal:
Hidden or iceberg orders deeper in the book,
Off-exchange liquidity or block trades,
Or how quickly the book replenishes in real time.
But as a visual proxy, they’re incredibly useful for spotting moments when price runs ahead of available liquidity, often right before sharp reversals.
█ Why the Crash Hit So Hard
So while the crash came from unexpected news, the speed of that drop wasn’t random. Markets were already fragile. Liquidity across assets was thin. When the shock hit, there weren’t enough resting orders to slow it down.
Gold, Bitcoin, and S&P futures all had their mid-prices trading above visible liquidity, making them more sensitive to aggressive selling; that’s why the market fell almost simultaneously and so fast.
█ How I Handle These Setups
Whenever I see price trading above visible liquidity, I start managing risk differently. I might keep existing longs, but I won’t add new ones. Instead, I scale out gradually and watch for potential short setups if other signals confirm it.
It’s not about predicting crashes, it’s about recognizing when the market’s structure is fragile.
█ Quick Takeaway
When the mid-price trades above visible liquidity, the order book is telling you something simple but powerful:
“There’s not much support up here.”
That’s often when it pays to get defensive, not aggressive.
Access the CME Liquidity tool at this link
-----------------
Disclaimer
The content provided in my scripts, indicators, ideas, algorithms, and systems is for educational and informational purposes only. It does not constitute financial advice, investment recommendations, or a solicitation to buy or sell any financial instruments. I will not accept liability for any loss or damage, including without limitation any loss of profit, which may arise directly or indirectly from the use of or reliance on such information.
All investments involve risk, and the past performance of a security, industry, sector, market, financial product, trading strategy, backtest, or individual's trading does not guarantee future results or returns. Investors are fully responsible for any investment decisions they make. Such decisions should be based solely on an evaluation of their financial circumstances, investment objectives, risk tolerance, and liquidity needs.
Cryptocrash2025
The Crypto Crash: A Brutal Reminder of What MattersLast night, the crypto market went through one of its ugliest moments in history — a true bloodbath.
What began as a reaction to Trump’s tariff announcement quickly turned into a historic liquidation cascade that wiped out over $19 billion in leveraged positions within few hours.
More than 1.6 million traders were liquidated. Bitcoin dropped over 10%, Ethereum and Solana fell even harder, and many small altcoins collapsed by 40–50%, some even more.
It wasn’t just volatility — it was destruction.
Was It Manipulation? Probably.
Everyone was long.
Everyone expected a rally.
Then, as often happens in overleveraged markets, someone pulled the plug. Prices were smashed down violently, liquidations fed liquidations, and what followed looked less like a correction and more like a coordinated sweep.
I’m not the one to shout “manipulation” at every dip — but let’s be honest: this one felt orchestrated.
Still, as they say, all’s fair in love and war . And markets are war . Which means you can’t complain — you have to adapt.
The Real Lesson: Survive First, Profit Later
If there’s one thing this crash reminds us of, how risky leverage is.
Used wisely, it amplifies returns.
Used recklessly, it destroys accounts — fast.
Most traders didn’t got liquidated because they were wrong about direction.
They got liquidated because they were overexposed.
When a 10% drop in Bitcoin wipes out your entire account, the problem isn’t the market — it’s your risk management.
How to Trade Like a Professional
1. Trade with controlled risk.
Never risk more than a small percentage per trade. If you don’t know your stop-loss level before you enter, you’re gambling, not trading.
2. Have a plan.
Every position must have an entry, a target, and an exit plan for when you’re wrong. A trader without a plan becomes prey when the market turns.
3. Avoid leverage on small altcoins.
Alts move fast, lack liquidity, and often get manipulated. Using leverage on them is financial suicide. Stick to spot.
4. Stay realistic.
The market doesn’t owe you a 10x move. Take profits, manage downside, and avoid getting caught in collective optimism.
5. Focus on survival.
Capital preservation is victory in itself. If you can stay in the game after a crash like this, you’ve already beaten 80% of the crowd.
Final Thoughts
Yes, my portfolio is down too. But I’m not panicking — because I wasn’t leveraged, and I had a plan.
Those who treat trading like war — disciplined, strategic, prepared — survive.
Those who treat it like a casino, don’t.
So let this $19B liquidation serve as a brutal reminder:
Don’t trade based on hope, hype, or herd behavior.
Trade with control, clarity, and courage.
Because in markets, like in war — survival always comes before victory.