ETHUSDT potential upside after filling fair value gapjust sharing ideas.
- touched fibo 📈
- tested on support zone 📈
- living in Q4 (uptober) 📈
- will have next 2 interest rates cuts 📈
Cryptocurrency

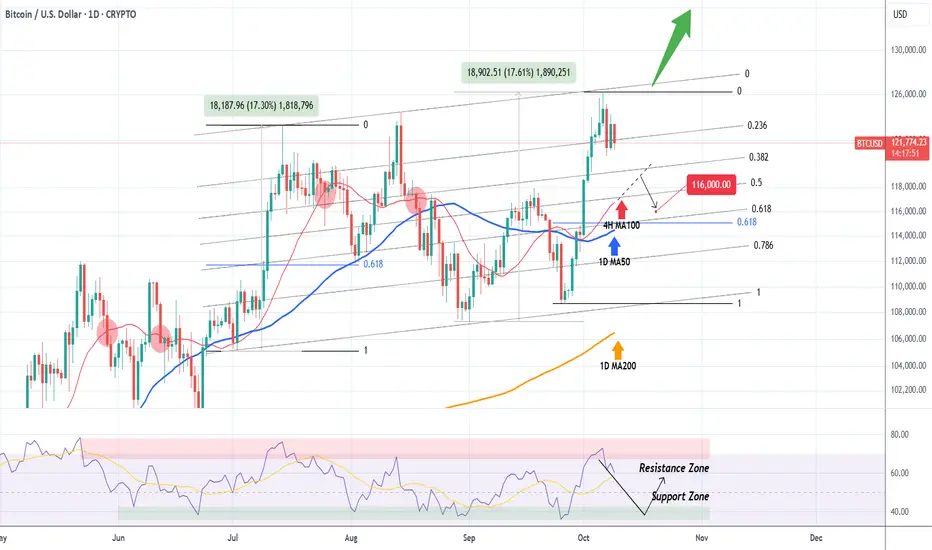
BITCOIN How low can it pull back??Bitcoin (BTCUSD) got rejected on the Higher Highs trend-line we mentioned on our last analysis and is already pulling back. The question is how far can it drop?
Today we expand on that analysis by applying the Fibonacci Channel on the Higher Highs trend-line. Instantly we can see that the Channel Up has two almost perfectly symmetrical Bullish Legs (+17.30% and +17.61% respectively).
The key on this pattern is the 4H MA100 (red trend-line). Every time BTC broke below it since May 29, the decline extended all the way to at least the 1D MA50 (blue trend-line).
Since the 1D RSI also got rejected on its Resistance Zone, we expect a pull-back towards its Support Zone and if the 4H MA100 breaks, further extension towards the 1D MA50. We estimate a potential target to be $116000, which is marginally above the 0.618 Fibonacci retracement level, where the August 02 bounce took place. Needless to say, a break (and 1D candle close) above the Channel's top (Higher Highs trend-line), invalidates any pull-back scenario and, as mentioned previously, constitutes a bullish break-out to a new pattern/ rally.
What do you think will happen next? Feel free to let us know in the comments section below!
-------------------------------------------------------------------------------
** Please LIKE 👍, FOLLOW ✅, SHARE 🙌 and COMMENT ✍ if you enjoy this idea! Also share your ideas and charts in the comments section below! This is best way to keep it relevant, support us, keep the content here free and allow the idea to reach as many people as possible. **
-------------------------------------------------------------------------------
💸💸💸💸💸💸
👇 👇 👇 👇 👇 👇
TradeCityPro | LTCUSDT The Best Trade Setup of the Week!👋 Welcome to TradeCityPro Channel!
Let’s move on to the analysis of the market veteran — Litecoin (LTC) — one of the oldest coins in the crypto market, which right now looks like it could offer a great trading opportunity.
🌐 Overview of Bitcoin
Before starting the analysis, let me remind you that we’ve moved the Bitcoin analysis section to a separate daily report based on your requests, so we can go into more detail about Bitcoin’s condition, price action, and dominance:
🕓 4H Time Frame
After forming higher lows inside the $101.87–$107.14 accumulation box, Litecoin finally broke through resistance and experienced a sharp upward move.
Then, after reaching the $122.74 resistance, the price got rejected and is currently testing the $115.67 support where it might consolidate for a while.
🚀 Long Position Setup:
If the price breaks the $122.74 trigger, we can easily open a long position.
In general, as long as the price stays above $115.67, long positions remain valid.
🔻 Short Position Setup:
For a short position, we first need to see a lower high form within the current range and some signs of seller pressure.
Only then, with a confirmed breakdown below $115.67, could we consider opening a risky short position.
📝 Final Thoughts
Stay calm, trade wisely, and let's capture the market's best opportunities!
This analysis reflects our opinions and is not financial advice.
Share your thoughts in the comments, and don’t forget to share this analysis with your friends! ❤️

118.60-119.50K for BTC BounceMorning folks,
So, the final leg up has happened that we discussed last time, but it was not as strong as we've expected. It means that all time high target around 127K is not done yet.
Meantime, BTC is taking the breath. Since upside momentum looks nice, we consider first support area around 118.6K - 119.50K as potential for long trade. Especially if we get this butterfly pattern.

TradeCityPro | ATOMUSDT Ready for a Sharp Drop!👋 Welcome to TradeCityPro Channel!
Let’s analyze ATOM (Cosmos) — one of the older and more established coins in the market. Personally, I’ve been holding and staking this one for quite a while.
🌐 Overview of Bitcoin
Before we begin, let me remind you that we’ve moved the Bitcoin analysis section to a separate daily report at your request, so we can go into more detail about Bitcoin’s condition, price action, and dominance:
📊 Higher Time Frames
On the higher time frames, ATOM has been ranging for a long period of time and interestingly, it has even formed a smaller range inside its main range.
Currently, it’s oscillating near the bottom support of that larger range, showing weakness.
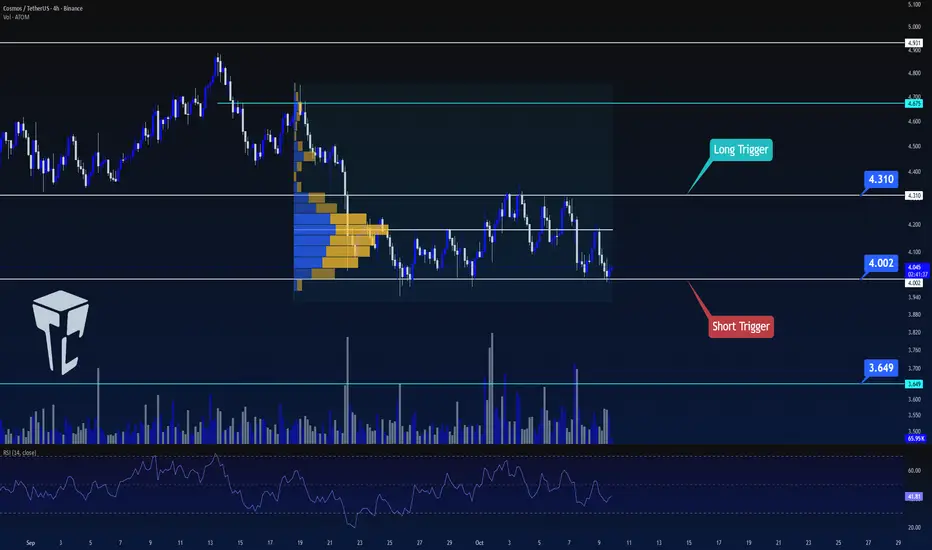
🕓 4H Time Frame
In the 4-hour chart, the price remains stuck inside a range between $4.002 and $4.310.
However, this time it has been rejected from the midline, which increases the likelihood of losing the lower support.
📉 Short Position Setup
If the price breaks below $4.002 with increasing volume and momentum, opening a short position would be completely logical and I’ll personally be taking that short setup as well.
📈 Long Position Setup
For a long position, patience is key.
Other coins like MNT, HYPE, and AVAX currently show stronger bullish potential, but if ATOM breaks above $4.310 and starts forming higher highs and higher lows, we can then begin to shift our bias to bullish.
📝 Final Thoughts
Stay calm, trade wisely, and let's capture the market's best opportunities!
This analysis reflects our opinions and is not financial advice.
Share your thoughts in the comments, and don’t forget to share this analysis with your friends! ❤️
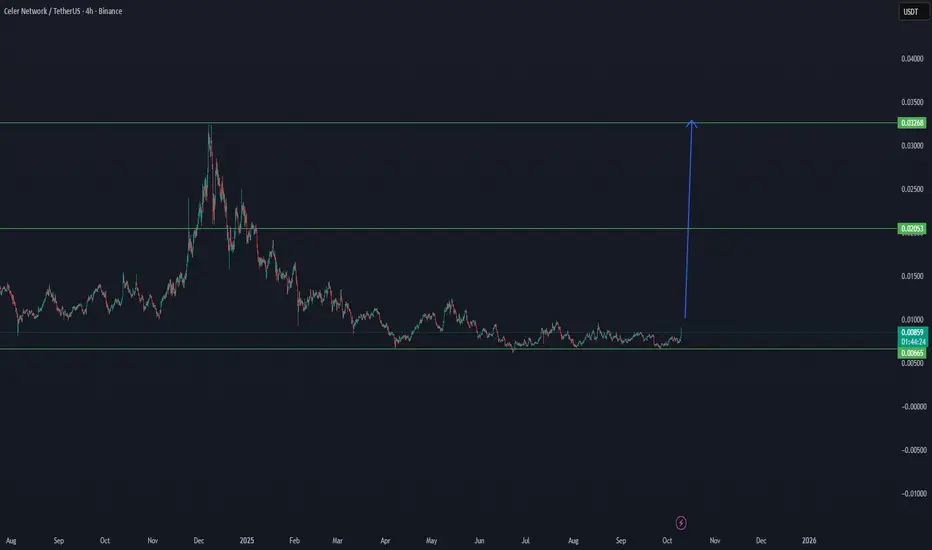
CELR NEW CYCLE ON WAYCELER NETWORK (CELR/USDT) — Cycle Bottom Formed, Reversal Phase Loading 🔄
CELR is showing clear signs of accumulation near the cycle bottom zone between $0.0066 – $0.0088, a range historically known for reversals and strong recovery moves.
📉 Accumulation Base: $0.0066 – $0.0088
🟢 Current Structure: CELR is stabilizing after prolonged downtrend pressure, building strength in a low volatility range — often a signal before a new expansion phase.
📈 Next Major Targets:
First resistance zone: $0.0205
Main cycle target: $0.0326
A breakout confirmation above $0.0100 would likely activate a new bullish cycle, potentially mirroring previous macro moves from similar levels.
Summary:
CELR/USDT is trading in its historical low region, suggesting a high-reward accumulation zone. As momentum returns to mid-cap alts, CELR could be among those leading the next cycle push.
🎯 Targets: $0.0205 → $0.0326
📊 Bias: Bullish Accumulation Phase
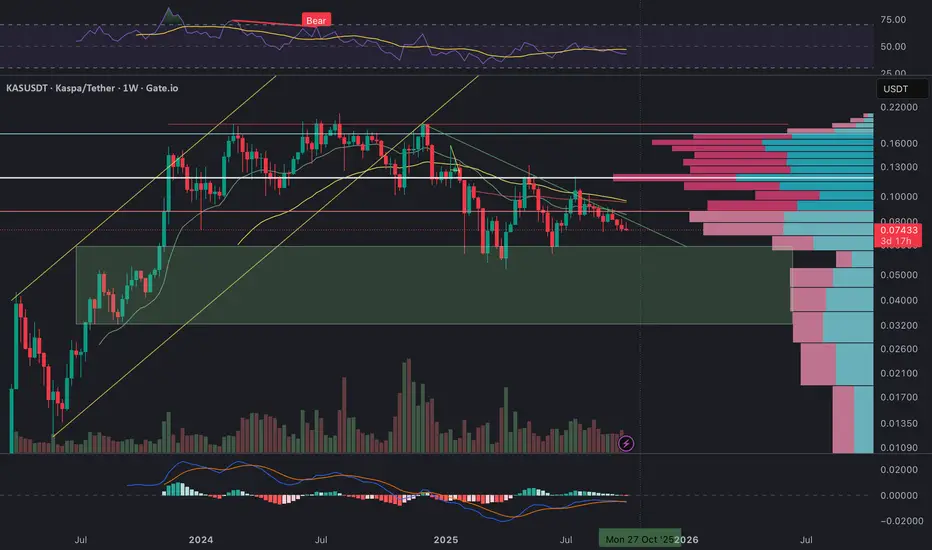
𐤊 $KAS KASPA Weekly Outlook: Testing the Final Line of DefenseKaspa has been consolidating for several months, drifting steadily lower within a well-defined descending channel after breaking down from the 2024 uptrend. Price is now hovering around a crucial support zone between 0.073 and 0.070 USDT, which also coincides with the lower boundary of the major demand region (highlighted in green).
From a structural point of view, KAS remains in a macro corrective phase. Momentum indicators are showing signs of exhaustion on the downside – the RSI is hovering near the 40 level and flattening out, while MACD has started to compress with a potential bullish crossover forming if buyers step in this week.
The Volume Profile clearly shows heavy supply between 0.10 – 0.12 USDT, marking this zone as the key resistance cluster that must be reclaimed to confirm any trend reversal. Until then, rallies into 0.081 – 0.085 are likely to face selling pressure.
Technically, this area around 0.074 USDT represents the “final line of defense” before a deeper retest toward 0.06 – 0.055 (the next historical demand pocket). However, if bulls manage to defend this support and push price back above the descending trendline and the 0.0815 zone, a medium-term reversal toward 0.095 – 0.10 could develop.
In short:
• Trend: Still bearish but approaching exhaustion
• Key Support: 0.073 – 0.070
• Immediate Resistance: 0.0815, then 0.090 – 0.095
• Macro Target (if breakout): 0.10 – 0.12
• Breakdown Target: 0.060 – 0.055
Volume and structure suggest we are near a make-or-break zone. A weekly close below 0.073 would confirm continuation of the downtrend, while a rebound above 0.081 could be the first real signal of accumulation before the next bullish leg.
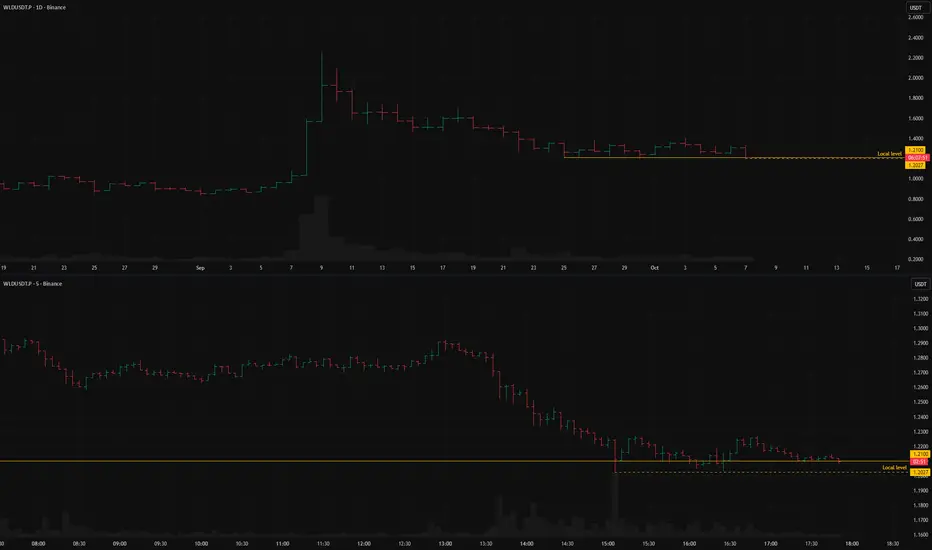
WLDUSDT.P: short setup from daily support at 1.2027While altcoins were rallying and BTC was attempting to break its all-time high, BINANCE:WLDUSDT.P just stood in consolidation, which is a sign of weakness. In my opinion, an asset that has come from above and entered consolidation will continue its move down.
I am providing the analysis now because I see a good pre-breakout base, which I interpret as a readiness for a breakdown.
And although this base is essentially "chopping" the main level (which I usually don't work with), in this case, it has formed a clear local support level just below it: two previous drops stopped at the exact same price point.
This allows me to use this specific local level as a basis to work from.
Key factors for this scenario:
Price void / low liquidity zone beyond level
Asset decoupled from the market (relative strength/weakness vs. BTC)
Volatility contraction on approach
Prolonged consolidation
Repeated precise tests of the level
Factors that contradict this scenario:
Exhaustive move (approaching from afar)
Closing far from the level
Was this analysis helpful? Leave your thoughts in the comments and follow to see more.
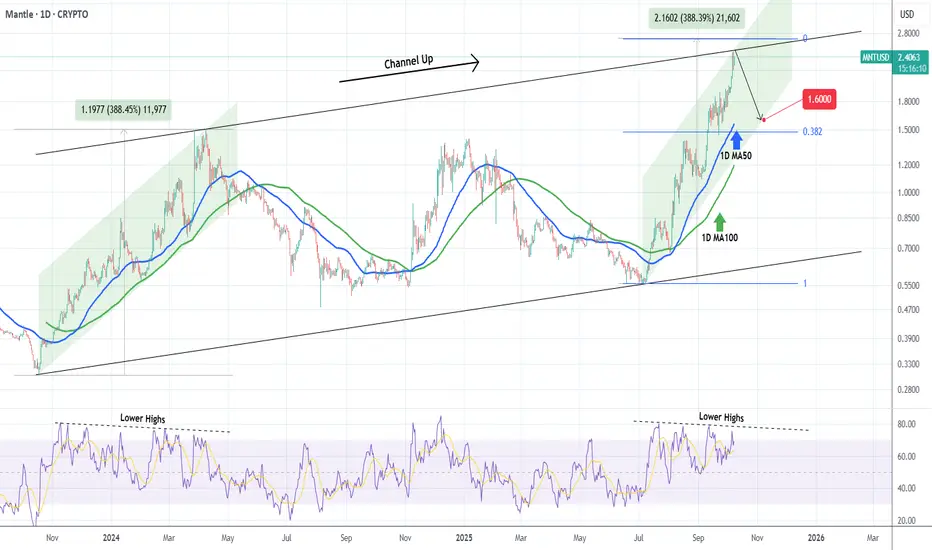
MANTLE Hit the top of its 2-year Channel Up. Correction ahead?Mantle (MNTUSD) has been trading within a Channel Up since its October 18 2023 market bottom and right now the price just hit the top (Higher Highs trend-line) of this pattern.
The current Bullish Leg has almost risen as much as the first one (+388.45%) so technically a pull-back wouldn't be unexpected at this point. Before it resumes the long-term trend and potentially breaks above the Channel Up, we expect the price to test at least its 1D MA100 (green trend-line), which is the typical Support during such Legs, a 1.600.
-------------------------------------------------------------------------------
** Please LIKE 👍, FOLLOW ✅, SHARE 🙌 and COMMENT ✍ if you enjoy this idea! Also share your ideas and charts in the comments section below! This is best way to keep it relevant, support us, keep the content here free and allow the idea to reach as many people as possible. **
-------------------------------------------------------------------------------
💸💸💸💸💸💸
👇 👇 👇 👇 👇 👇
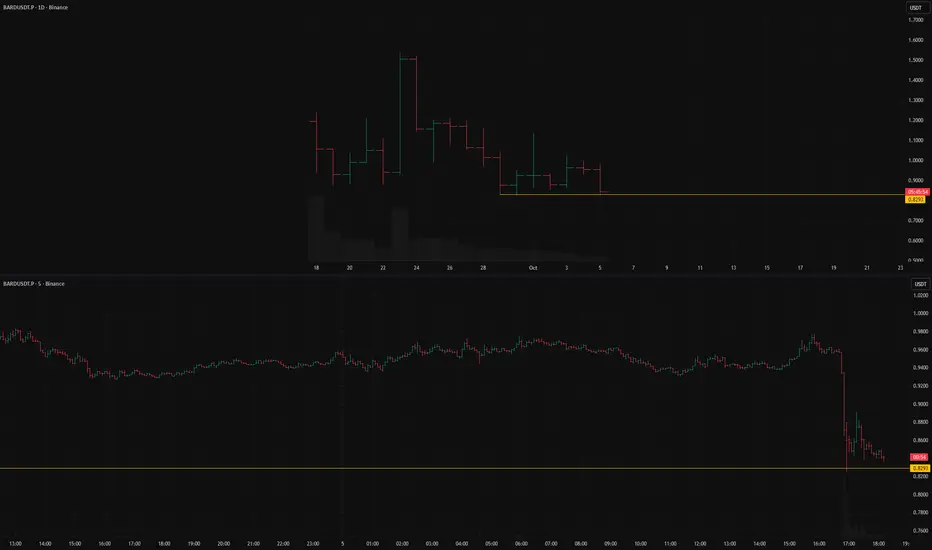
BARDUSDT.P short setup from daily support at 0.8293BINANCE:BARDUSDT.P has cleanly tested the 0.8293 level.
This level is the All-Time Low, which was the stopping point of the drop from the All-Time High.
There is a high probability that we will next see a consolidation followed by a breakdown of this level.
I really like these kinds of setups.
Key factors for this scenario:
Global & local trend alignment
Price void / low liquidity zone beyond level
Volatility contraction on approach
Momentum stall at the level
Immediate retest
No reaction after a false break
Was this analysis helpful? Leave your thoughts in the comments and follow to see more.
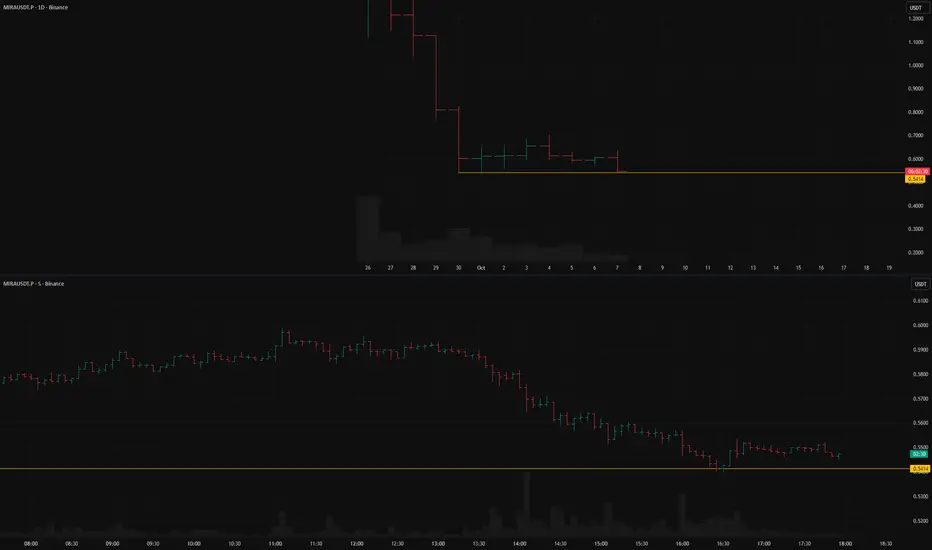
MIRAUSDT.P short setup from daily support at 0.5414BINANCE:MIRAUSDT.P is at its all-time low.
Against the backdrop of a positive market, the asset just stayed in consolidation, not even attempting to rally, which indicates its relative weakness.
Therefore, I am expecting a short from the clear and confirmed level of 0.5414.
Recently, a false breakout occurred, but there is still no proper reaction to it. Usually, the market reacts with a bounce, which would indicate the level is being defended. Instead, I'm seeing only a weak pullback and continued consolidation right above the level, which suggests a higher probability of a breakdown.
Key factors for this scenario:
Global & local trend alignment
Price void / low liquidity zone beyond level
Asset decoupled from the market (relative strength/weakness vs. BTC)
Volatility contraction on approach
Prolonged consolidation
Factors that contradict this scenario:
Closing far from the level
Was this analysis helpful? Leave your thoughts in the comments and follow to see more.
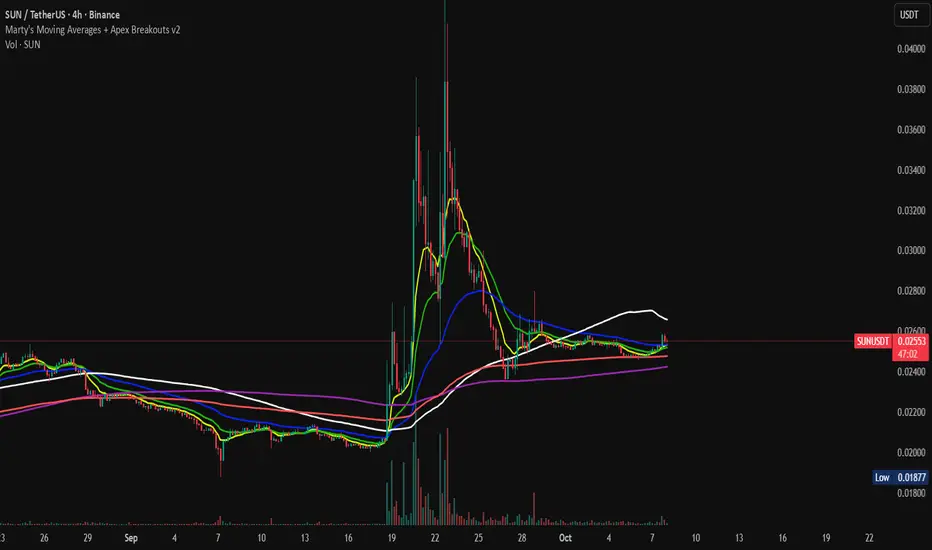
SUNUSDT on the brink of blowing up
On the weekly we are seeing some expansion of the bollinger mass in 3dwave pm heat map indicator. CCI is high, wave-pm is indicating very high levels of compression on all lengths
On the daily wave-pm is showing compression. 3D Wave-pm heat map is showing strength in these bollingers for support for price.
On the lower timeframe, 4hr we are seeing a range and massive compression on 3D Wave-PM indicated by all the blue. Within the green range we are seeing the micro beginnings of an expansion.
We predicted this downturn - page accuracy will spook you out!Hey, guys.....
just wanted to say our analysis of the market is really playing out.
This bearish momentum should continue to 114,228$ very easily. Thereafter, it should continue to 106,607$ to create a new low for the past few months.
we don't think that the bearish price action will stop here though, 92,249$ is the price we expect price to hit within the next 2 months or less.
I think this should be the final aggressive bull move we have in the market for the next few months and the bears should take full charge from here.

BTC/USD: Structure Shift Confirmed - Bearish CHoCH Break"The previous analysis highlighted the Minor and Major CHoCH levels as key lines in the sand for the recent uptrend. The market has now decisively broken BELOW both levels.
This action confirms a Bearish Change of Character in the market structure (on the chart), signaling a failure of the current bullish order flow.
1. Minor CHoCH Break: Confirmed the initial weakness and short-term pullback.
2. Major CHoCH Break: Confirms the structural shift, indicating that the corrective move is likely to be deeper than a simple consolidation.
We should now anticipate a shift in price action: making Lower Highs and Lower Lows. The previous support levels may now act as resistance. Looking for the next key demand zones for a potential bounce, but the immediate bias is now BEARISH."

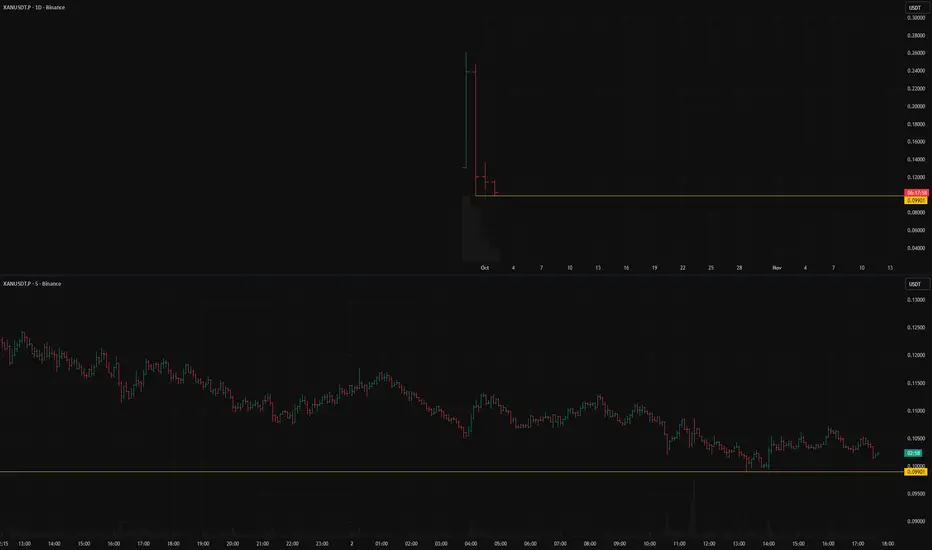
XANUSDT.P: short setup from daily support at 0.0990BINANCE:XANUSDT.P is at its all-time low.
The price recently tested this level cleanly, which confirms its relevance.
All that remains is to wait for one's own entry point.
Key factors for this scenario
Global & local trend alignment
Price void / low liquidity zone beyond level
Asset decoupled from the market (relative strength/weakness vs. BTC)
Volatility contraction on approach
Immediate retest
No reaction after a false break
Was this analysis helpful? Leave your thoughts in the comments and follow to see more.
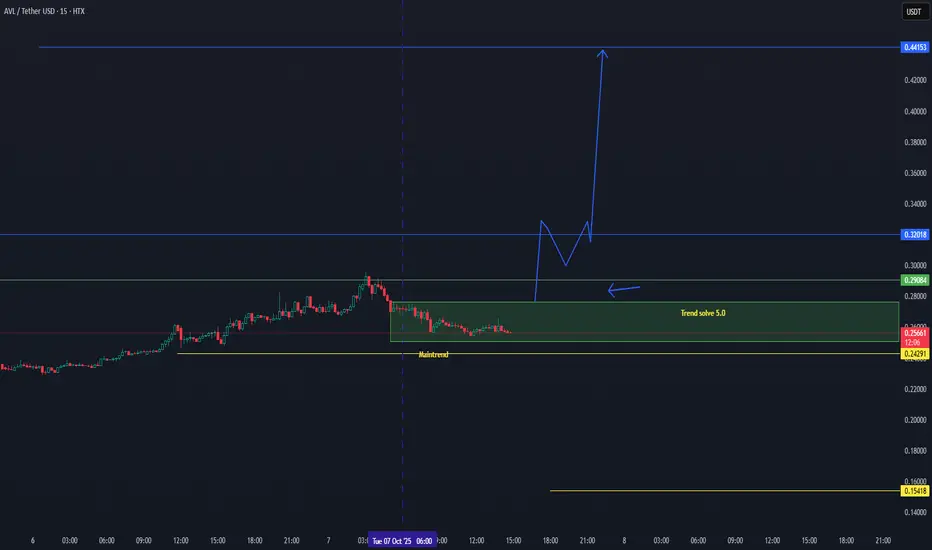
AVL/USDT — In the Solve Zone, Breakout Imminent BEST 2025AVL/USDT — In the Solve Zone, Breakout Imminent 🚀
There is a good chance for 1 time whale candle breakout.
AVL is currently trading inside the “Trend Solve 5.0” zone, showing strong signs of accumulation before a potential breakout. The market is coiling tightly within structure — an indication that momentum is building for a decisive move.
🟢 Main Trend Support: $0.24 — Holding firmly, maintaining bullish structure.
⚙️ Solve Zone Active: Price is consolidating between $0.25–$0.29, a key setup area before expansion.
📈 Breakout Confirmation: A clear move above $0.29 could trigger a strong bullish wave toward the next major resistance at $0.44.
🔄 Pattern Structure: Price forming a potential M-to-V recovery, often signaling a sharp upside continuation once confirmed.
Technical Outlook:
✅ Main Trend: Active and healthy
⚙️ Current Phase: Solve Zone accumulation
🎯 Breakout Target: $0.44
🧭 Invalidation: Below $0.24 (main trend break)
Summary:
AVL remains in a critical technical position — the Solve Zone is nearly complete, suggesting a breakout can occur at any moment. Momentum indicators and price structure both support a potential upside expansion once $0.29 is cleared.
📊 Bias: Bullish
📈 Focus Level: $0.29 Breakout
🎯 Next Major Target: $0.44
BITCOIN This is the last Resistance standing.Bitcoin (BTCUSD) got rejected (and is currently pulling back) on the Higher Highs trend-line that started on July 14. This is technically the last Resistance before a complete technical bullish break-out that will take the market to a new pattern out of this 3-month consolidation phase.
Until that happens, there are high probabilities to extend this pull-back all the way to the 0.382 Fibonacci extension ($119.5k), which is the minimum level that all similar corrections within these 3 months pulled back to.
As you can see such similar corrections have all been on 4H RSI Bearish Divergences, which have been Lower Highs against BTC's Higher Highs, typical indicator of a Top.
So what do you think will happen next, pull-back or break-out? Feel free to let us know in the comments section below!
-------------------------------------------------------------------------------
** Please LIKE 👍, FOLLOW ✅, SHARE 🙌 and COMMENT ✍ if you enjoy this idea! Also share your ideas and charts in the comments section below! This is best way to keep it relevant, support us, keep the content here free and allow the idea to reach as many people as possible. **
-------------------------------------------------------------------------------
💸💸💸💸💸💸
👇 👇 👇 👇 👇 👇

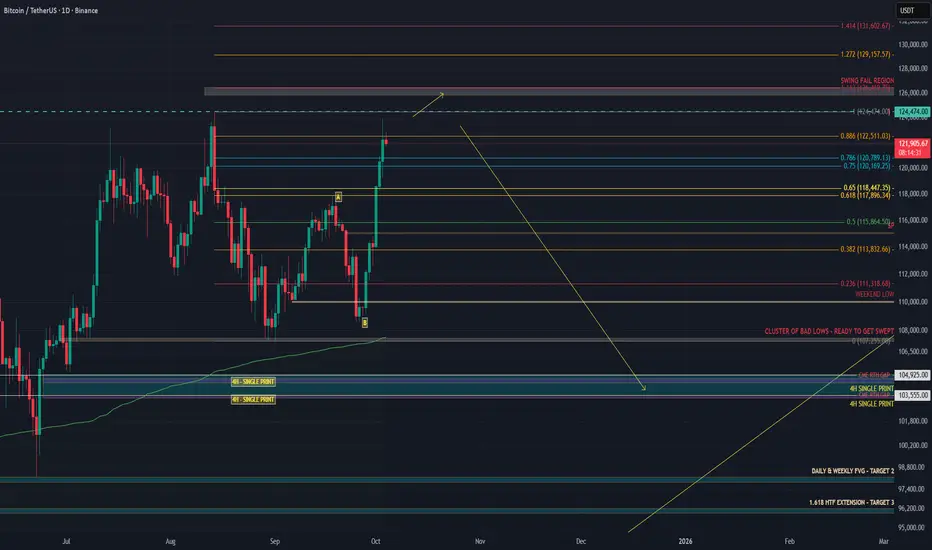
BITCOIN’S FINAL TRAP – THE SENTIMENT SWITCH IS COMING FASTIn my last BTC post I said a dump was likely based on data, and that thesis still stands. If anything, it’s even stronger now. .
On 13 August, CME made a high at 123,590.
That high was weak, no excess, flat TPO top, unfinished auction.
Binance topped at 124,474, Coinbase at 124,522.
CME opened with a gap down, leaving that poor high unrepaired with unfinished business and clean liquidity sitting above.
From 26 September, BTC started grinding up.
I expected a run of the 18 September high and a reversal around 118–119K, but price extended the move to the 1.618 extension. See my last analysis.
Structure was weak, spot CVD flat, futures CVD ripping, open interest climbing.
That shows perps were driving it, not real spot demand.
This week CME finally cleaned it up.
CME ripped through 125,025, taking out the August high at 123,590.
That level matched the old highs on Binance and Coinbase almost perfectly.
CME swept the old poor high left behind by spot and perps, completing the auction.
This is typical CME behavior, it hunts untested reference points during RTH and often reverses right after.
Flow data confirms the setup:
Spot CVD down means real buyers not following.
Stablecoin CVD pushing up means overleveraged longs chasing.
Coin-margined CVD rolling means profit taking or hedge flow.
Open interest flat at the top means trapped longs with no squeeze left.
The move looks like a leveraged markup driven by perps, cleaned up by CME liquidity, and now hanging on air.
CME repaired the August inefficiency, swept the prior spot high, and left another weak high with no excess, a textbook sign of distribution.
There’s still a chance we see one more SFP around 126K before momentum flips, but unless spot demand picks up aggressively, that should be the final liquidity grab.
My targets are 104K and 99K if 104K fails to hold, with potential for an even deeper drop beyond that level.
BTC HOLDS LEVELS FOR MORE..BTC/USDT — Main Trend Holds Strong at $112K, Confirmation Near
Bitcoin is currently trading just below the low time frame zone around $124.5K, showing slight resistance before a potential confirmation breakout. Despite this minor pullback, the main trend remains firmly intact around $112K, which continues to act as the key structural support.
⚙️ Main trend updated to $112K: This level defines Bitcoin’s long-term bullish structure — as long as BTC stays above it, momentum remains positive.
📉 Below low time frame: BTC is temporarily consolidating under local resistance, but proximity to this level suggests a potential re-test and confirmation soon.
🚀 Upside target: Once the low time frame confirms, Bitcoin could aim for the next resistance zone near $132K.
Technical Outlook:
🟢 Main Trend (Support): $112K
🟡 Low Time Frame Resistance: $124.5K
🎯 Next Target: $132K (upon confirmation)
Summary:
BTC remains structurally bullish above the $112K main trend. While still slightly below the short-term confirmation zone, it’s positioned well for a potential continuation — provided support holds and price regains momentum above $124.5K.
📊 Bias: Cautiously Bullish
📈 Key Levels: Support $112K | Resistance $124.5K | Target $132K

AVL Technical Setup Signals Full Bullish Activation — 07-10-2025AVL/USDT — Cycle Activated, Bullish Structure Targeting $0.55 🚀
AVL has officially confirmed activation across all key phases — cycle, main trend, and low time frame — signaling strong bullish momentum building up. The breakout structure now positions AVL for a potential multi-target move.
✅ Cycle = ON: The broader market cycle has restarted, marking the beginning of a new accumulation-to-expansion phase.
✅ Main trend support: Price continues to hold firmly above the main trend zone near $0.24, confirming strong structural support.
✅ Breakout level tested: AVL is testing the $0.29–$0.30 breakout zone, a key trigger for continuation toward higher targets.
✅ Open space above: Once price clears $0.30, resistance remains light up to the $0.50–$0.55 region.
Technical Targets:
🎯 Target A: $0.32
🎯 Target B: $0.44
🎯 Target C (main goal): $0.50–$0.55
Outlook:
Momentum is aligned across all timeframes, and the activation of the full cycle indicates AVL could be entering its next major bullish phase. As long as price remains above $0.24, the bias stays strongly bullish toward the open space above.
📊 Bias: Bullish
⚙️ Structure: Cycle Activated → Breakout Confirmation
📈 Expecting: Strong expansion move toward $0.50–$0.55

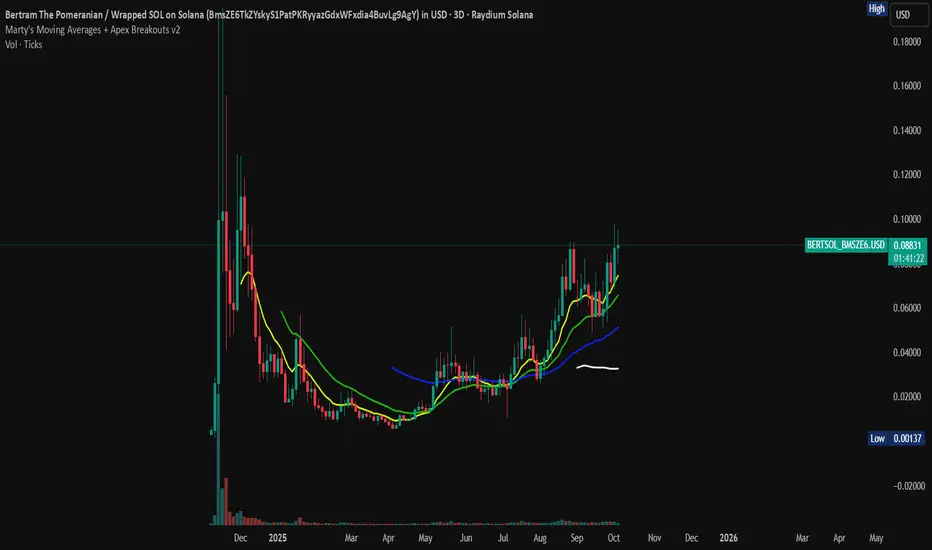
BERT getting ready for parabolic moveBERT is above the major metrics, and looks like it's arming for a parabolic move.
Clear trend, good weather on the 12hr chart with compressionary force active on major period lengths. I would not expect a swing low for a better entry as the price is peeling up at the moment.
On the 4hr chart we are seeing tremendous compression. A very large move is possible within the next couple of days. Although I'd say it depends on the major cryptos bring more inflows into the ecosystem. But Bitcoin is certainly poised for its melt up.
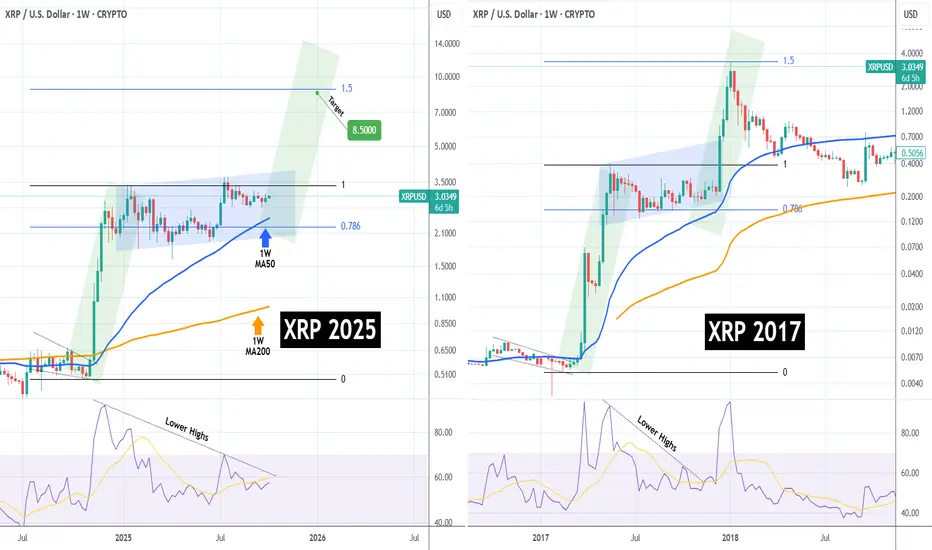
XRPUSD getting ready for its NOW-or-NEVER moment to $8.500XRP (XRPUSD) has been trading sideways since the July 14 2025 High in a growth pattern that resembles 2017. As it approaches the 1W MA50 (blue trend-line), the market gets closer to its now-or-never moment as the 1W MA50 is expected to hold and provide a bullish boost similar to December 11 2017, which made the price rally to its 1.5 Fibonacci extension.
With even the 1W RSI sequences among the two fractals also looking identical, we can see XRP peaking around $8.500 (Fib 1.5 ext), if this model repetition is completed.
-------------------------------------------------------------------------------
** Please LIKE 👍, FOLLOW ✅, SHARE 🙌 and COMMENT ✍ if you enjoy this idea! Also share your ideas and charts in the comments section below! This is best way to keep it relevant, support us, keep the content here free and allow the idea to reach as many people as possible. **
-------------------------------------------------------------------------------
💸💸💸💸💸💸
👇 👇 👇 👇 👇 👇
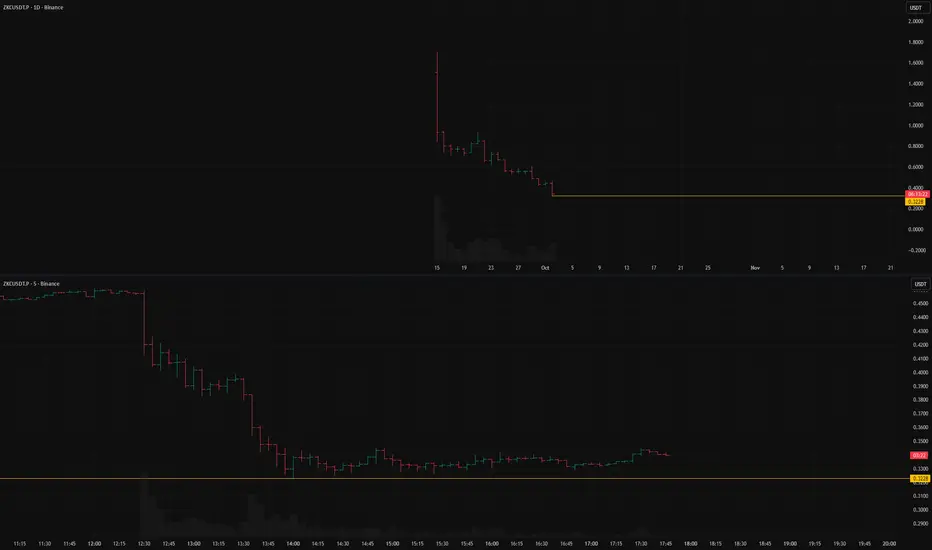
ZKCUSDT: short setup from daily support at 0.3228BINANCE:ZKCUSDT.P has been falling almost continuously since its listing, with short pauses.
Right now, after another downward impulse, I see a pause. This consolidation could last for a day or for several—it's impossible to predict.
However, a clear tendency is visible on the chart: drop → consolidation → drop.
Key factors for this scenario
Global & local trend alignment
Price void / low liquidity zone beyond level
Asset decoupled from the market (relative strength/weakness vs. BTC)
Was this analysis helpful? Leave your thoughts in the comments and follow to see more.