FET ANALYSIS📊#FET Analysis
✅There is a formation of Descending triangle pattern on daily chart🧐
Pattern signals potential bullish movement incoming after the breakout of the pattern
👀Current Price: $0.600
🚀 Target Price: $0.700
⚡️What to do ?
👀Keep an eye on #FET price action and volume. We can trade according to the chart and make some profits⚡️⚡️
#FET #Cryptocurrency #TechnicalAnalysis #DYOR
Cryptocurrency

BTC STILL IN TREND FOR MORE.. UPDATE 04-10-2025📊 Market Update
Bitcoin (BTC):
Bitcoin is maintaining its main upward trend, which continues to define the overall bullish structure. At the moment, BTC is trading in a new lower time-frame zone and needs to hold above $121.6K to confirm a green (bullish) structure on the lower time frame.
Bitcoin is positive until now

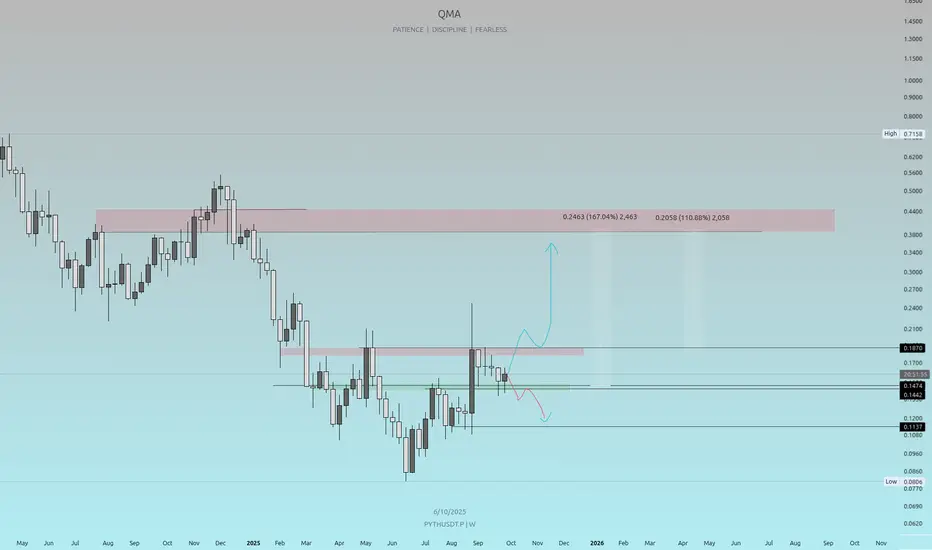
PYTHUSDT Weekly Analysis Is PYTH breaking out for a strong move up or gearing for a correction? This analysis identifies key levels to watch for high-probability entries and exits.
Price Levels to Watch:
Resistance Zone: $0.44–$0.50 (major supply area)
Intermediate Resistance: $0.1870
Current Price Support: $0.1445
Support Zone: $0.1137
Scenarios:
🔵 Bullish: Break and hold above $0.1870 could trigger a move to $0.44+. Possible gains over 100%!
🔴 Bearish: Failure to hold $0.1445 support may lead to retest of $0.0860 region.
Why This Setup?
Clear supply/demand zones highlight significant trader interest.
Weekly timeframe support/resistance for swing trading opportunities.
Focus on patient, disciplined entries with risk management
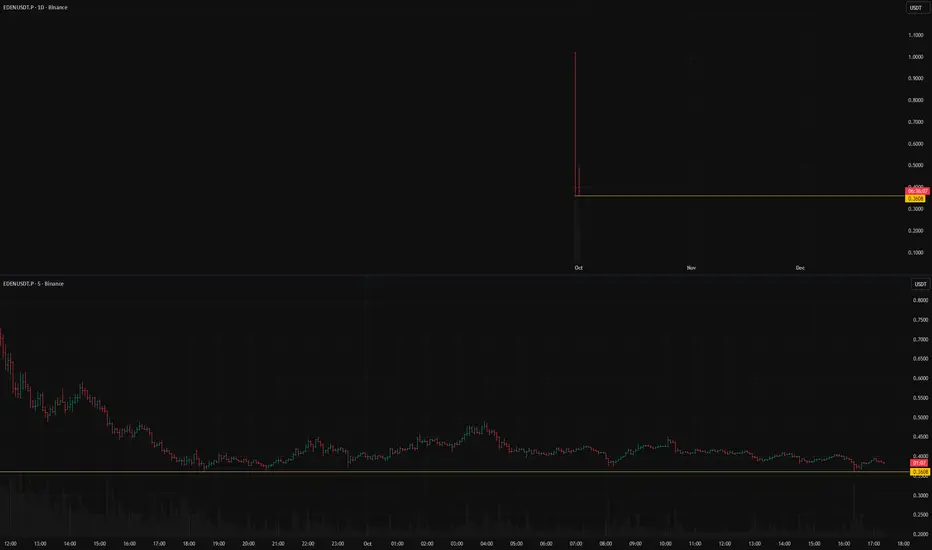
EDENUSDT.P short setup from daily support at 0.3608After its listing, BINANCE:EDENUSDT.P has been moving down and has currently stopped at a level that has already been clearly confirmed.
At the moment, we have a combination of favorable factors for a short: a downtrend, an absence of strong buyers, good volatility, and consolidation.
All that remains is to wait for YOUR OWN entry point according to your trading system.
An important condition is that volatility does not increase as the price approaches the level.
Key factors for this scenario
Global & local trend alignment
Price void / low liquidity zone beyond level
Volatility contraction on approach
Prolonged consolidation
Was this analysis helpful? Leave your thoughts in the comments and follow to see more.
BTC vs. The Broader Market: A Dangerous Powerful Wave is Coming Today, we're taking a deep dive into the two most important charts in the crypto space: Bitcoin (BTC/USDT) and the Total Crypto Market Cap (TOTAL). Using an Elliott Wave framework on the weekly timeframe, we can see a clear bullish structure taking shape. However, some underlying weaknesses in key indicators warrant a cautious approach. Let's break it down.
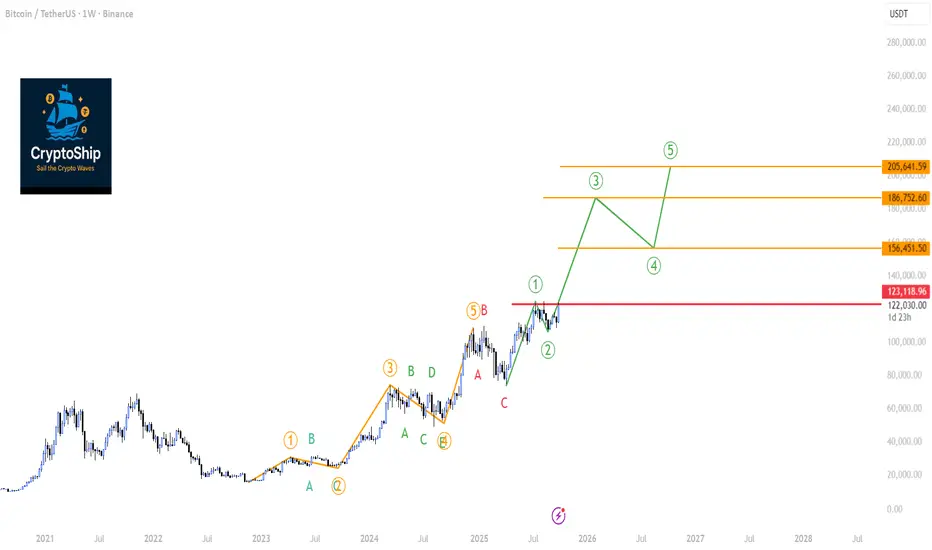
1. Bitcoin (BTC/USDT): The Path to a new All-time high Hinges on a Key Level
As we can see on the weekly chart, Bitcoin appears to have completed a major five-wave impulse cycle which topped out around the $108,000 mark. This was followed by a necessary ABC corrective phase.
The exciting part is what comes next. We are potentially witnessing the beginning of a brand new five-wave impulse.
Wave (1): Appears to have started from the $74,000 low and peaked near $124,000.
Wave (2): A healthy correction followed, finding support around $107,000.
If this count is valid, we are now in the early stages of Wave (3), which is typically the most powerful and extended wave in an impulse sequence.
The Critical Condition:
For this bullish count to remain the primary scenario, the current weekly candle must NOT close below $123,000. A weekly close below this crucial level would risk invalidating the start of this new impulse, suggesting that we may still be within a more complex corrective structure (such as a regular flat correction Check the article).
Also during wave (3) the Weekly RSI must go beyond "80" showing strong momentum ( if it fails to do so then it's a caution signal to be strongly considered because a reversal could happen at any time!)
Indicator Analysis:
Bearish Divergences: We must note the lingering bearish divergences on both the RSI and MACD. These signals are suspicious and suggest that momentum is not fully confirming the recent price highs. They need to be monitored closely.
Volatility Coiling: The Bollinger Band Width Percentile (BBWP) is showing significant contraction. This coiling of the bands indicates that weekly volatility is decreasing, which often precedes a massive price expansion in the coming weeks or months, However the lack of BBWP exhaustion (spectrum crossing 90%) remains a bullish sign combined with the contraction
Trend Strength: The ADX is rising on the weekly chart, confirming that a strong trend is in progress.
Volume: On-Balance Volume (OBV) and general volume profiles appear adequate for now.
2. Total Crypto Market Cap (TOTAL): The Broader Market Picture
The Total Crypto Market Cap chart tells a very similar story, reinforcing our Bitcoin analysis. The bullish phase began in sync with BTC back in November 2022.
The current Elliott Wave structure for the entire market is as follows:
Wave (1): Completed in March 2024.
Wave (2): Corrected into May 2024.
Wave (3): Finshed on March 2024
Wave (5): Finshed on December 2024
Currently the Total market cap chart is closely alligned with BTC chart which confrims the BTC leadership is intact. The current Elliot count of TOTAL market cap indicated wave (1) started April 2025 but curretly wave 2 showing caution signals
A Significant Red Flag - The Volume Divergence:
While the price structure remains bullish, there's a concerning signal under the hood. On the weekly RSI, we see a double bottom pattern, which is typically bullish. However, looking at the On-Balance Volume (OBV) during the same period, the OBV printed a lower low.
This is a classic bearish divergence between price/momentum and volume. It indicates that the recent push higher is not being supported by genuine, strong volume, suggesting conviction is weak.
Alternative Scenario:
If this volume weakness persists, we might see Wave (2) extenstion to around $3.23 Trillion. This would lead to a deeper Wave (2) correction, From that support, Wave 3 could launch that would still likely reach our ultimate ATH.
Conclusion: Bullish Outlook with a Note of Caution
Bringing both analyses together, the macro view for the crypto market remains decisively bullish. The Elliott Wave structures on both BTC and the TOTAL chart point towards significantly higher valuation, the lack of BBWP exhaustion on weekly charts of BTC & Total market cap remains a strong bullish indication combined with the BBWP expansion.
However, the market is showing signs of fatigue. The bearish divergences on Bitcoin's indicators and the critical volume divergence on the TOTAL chart cannot be ignored. This suggests that while the overall destination is uptrend, the journey might include a corrective dip before the next explosive leg higher.
Key Takeaways:
Overall Bias: Bullish.
Key Level for BTC: Watch the weekly close relative to $123,000. This is our line in the sand for the current impulsive structure.
Key Concern: The lack of strong volume confirming the market's recent move up warrants caution.
Volatility: Brace for a significant expansion in price movement. The compressed BBWP on both charts suggests a major move is brewing.
Stay vigilant and manage your risk accordingly. The next few weekly closes will be critical in determining whether we blast off directly or take a detour first.
Why bother playing fair?This is a very unique instrument to trade.
The standard: professional, delta neutral market makers run the game.
Here directional takers are in control.
~2 billion USD daily volume
~3 billion market cap (15 billion fully diluted)
~3% liquidity: 1 million USD
~90% controlled supply
They have their own algorithms abusing level 3 data (stoploss/liquidation prices)
With unlimited buy/sell power, abusing god mode positions (exempt from liquidation, margin limits and requirements)
That and the super thin liquidity
Causing maximum pain on leverage traders.
There is barely any liquidity on their own books.
Market makers are not participating, exchanges are not participating.
Operating on the principle that most traders will not realize their profits
And use their liquidation price as a stop loss.
They make around 15% (!!!) of trade value per liquidation, by far the highest yield for liquidation of any exchange. (1$ price liquidation price gets filled at 0.85$)
And from my research, it seems they are handled by their own liquidators, bypassing maker orders on the books completely.
Push price into liquidations, let go, leave no liquidity for profitable positions to exit
Repeat.
The scheme is on par with FTX and LUNA.
Will it fail the same way? It could.
If it does, who will take the fall?
Their anonymous founder?
Trade with extreme caution.

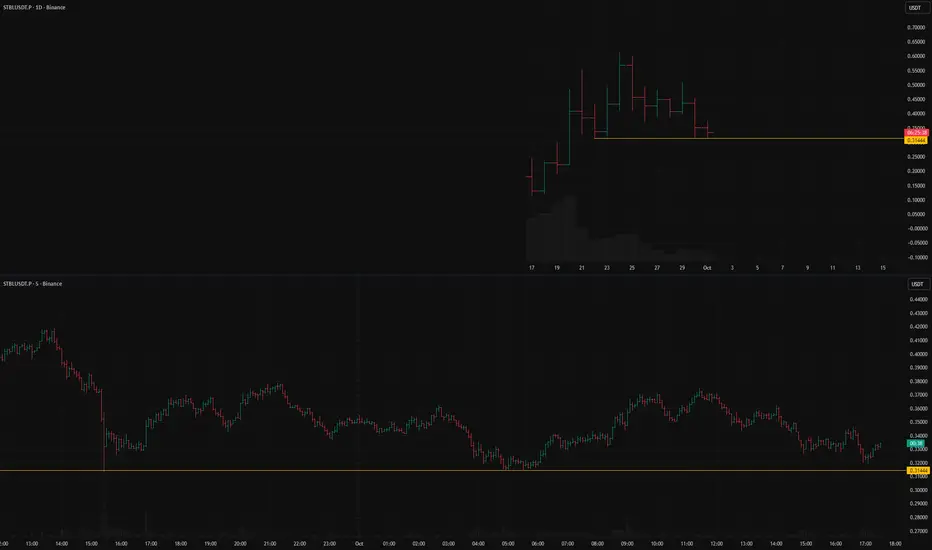
STBLUSDT.P short setup from daily support at 0.31444For the second day in a row, BINANCE:STBLUSDT.P is confirming the strength of the level with clean tests.
Below this level, there are no nearby obstacles that could complicate the asset's fall.
Therefore, it is worth waiting for your own entry point, while carefully monitoring the volatility, as always.
Key factors for this scenario
Price void / low liquidity zone beyond level
Volatility contraction on approach
Immediate retest
Prolonged consolidation
Repeated precise tests of the level
Was this analysis helpful? Leave your thoughts in the comments and follow to see more.
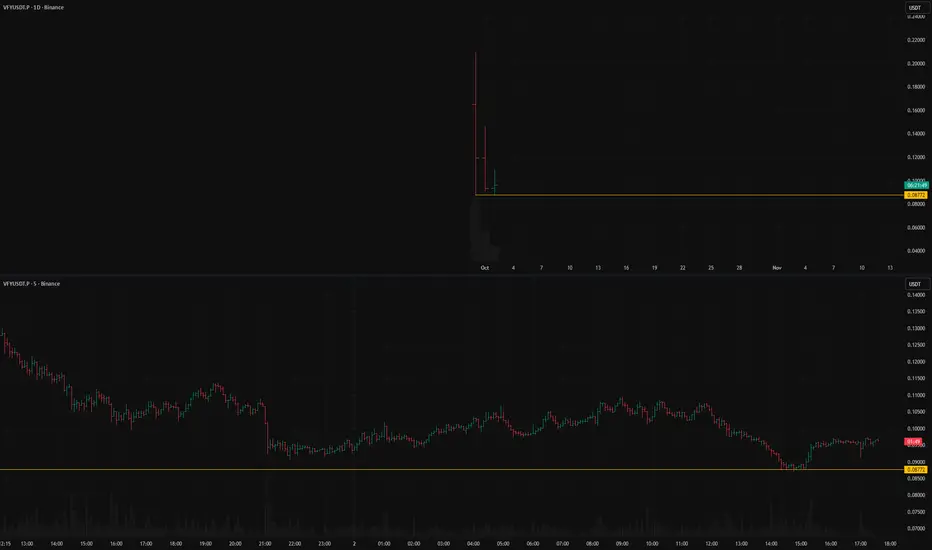
VFYUSDT.P: short setup from daily support at 0.08772BINANCE:VFYUSDT.P has a strong level—its All-Time Low.
Below it, there are no support levels that could slow the decline, so the fall could be very sharp.
Today, there was a good test of the level: the price came right up to it, consolidated on low volatility, confirming it cleanly, and then made a weak pullback.
This weak pullback signals an absence of buyers who might "save" the asset, which is why there could be a good short opportunity here.
Key factors for this scenario
Global & local trend
Price void / low liquidity zone beyond level
Asset decoupled from the market (relative strength/weakness vs. BTC)
Volatility contraction on approach
Immediate retest
Prolonged consolidation
No reaction after a false break Was this analysis helpful? Leave your thoughts in the comments and follow to see more.
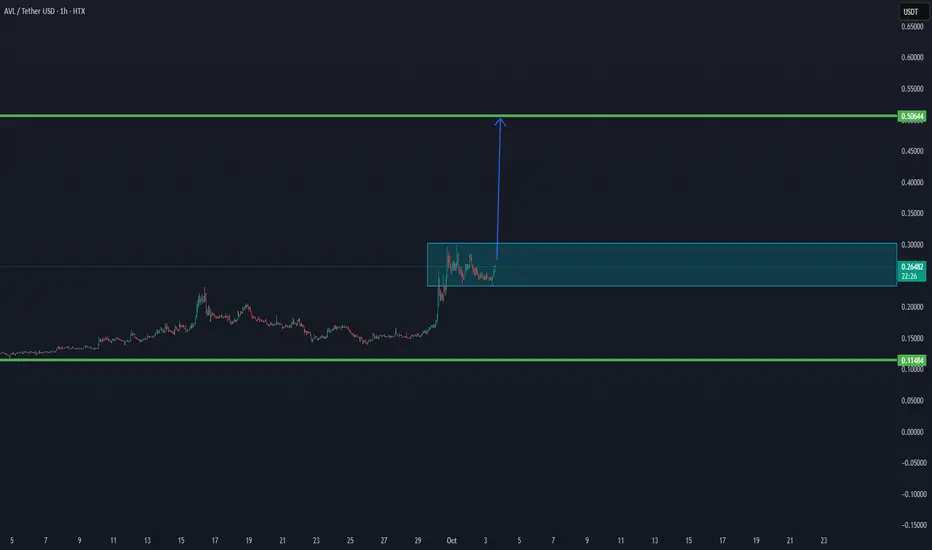
AVL/USDT IS ABLE TO BREAK IN THE COMING TIME TO $0,50✅ AVL has confirmed above both the low time frame and the main trend, showing strong bullish structure.
📈 With this setup, the chart is signaling a potential continuation move toward the $0.50 zone – the next major resistance.
Current support zone is holding well, which adds strength to the bullish case.
As long as AVL stays above the trend confirmations, momentum remains in favor of a breakout.
⚡ Outlook: Structure is positive, and upside potential toward $0.50 is active.
Will Bitcoin go up?
Hi my dears
Bitcoin seems to be on an upward trajectory. I think we should expect high prices for Bitcoin this week.
What do you think? Be sure to tell me

ETH/USDT – Bear Market Rally Into Q4Ethereum has staged a bear market rally as we move into the beginning of the last quarter of the year. After finding strong support around $3,826–$3,866, price recovered sharply and is now consolidating near the $4,480–$4,500 resistance zone.
• Resistance Zone (Supply): $4,487 – $4,561
• Support Zone (Demand): $3,826 – $3,866
• Current Price: $4,479
The structure shows that sellers are likely to step back in at this level, suggesting another weekend of selling pressure. If ETH fails to break and hold above the $4,560 level, downside momentum could retest the $3,800 area.
📉 Bearish Case: Rejection from resistance → continuation lower toward $3,826–$3,866.
📈 Bullish Case: Break and daily close above $4,561 → opens room for $4,700+ continuation.

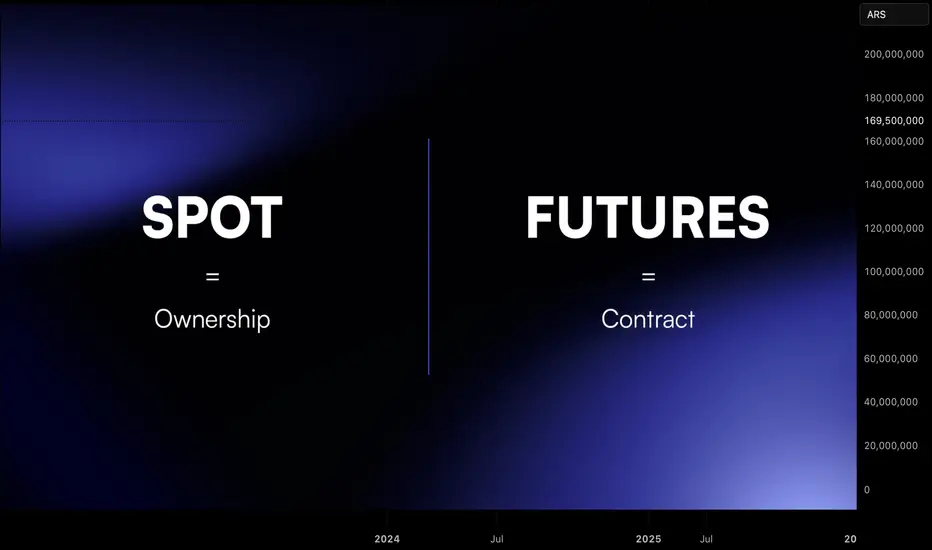
Futures vs Spot: What Traders Need to Know1. Introduction
In crypto, two of the most common ways to trade are spot markets and futures markets.
Both can be profitable, but they operate differently and knowing the differences is critical for survival.
Spot trading is straightforward: you buy the asset, you own it.
Futures trading is more complex: you speculate on the asset’s price without actually owning it.
This guide explains the differences, benefits, and risks of each so you can decide which suits your style.
2. What Is Spot Trading?
Spot trading is simple. You buy the asset, you own it.
There is no leverage. You pay the full price.
Profit and loss move one-to-one with the asset’s price.
Pros
Simple to understand.
No liquidation risk.
Can benefit from staking or long-term custody.
Cons
Limited upside with small capital.
Cannot profit when the market falls.
3. What Is Futures Trading?
Futures are contracts. You do not own the asset, only exposure to its price.
They allow leverage, often up to 10x or more.
You can go long to profit from rising markets or short to profit from falling ones.
Contracts can have expiry dates or be perpetual.
Pros
Flexibility to trade both directions.
Efficient capital use with leverage.
Useful for hedging spot positions.
Cons
Liquidation risk.
Complex funding fees on perpetuals.
Temptation to overtrade.
4. Key Differences: Spot vs Futures
Spot = You own the asset.
Futures = You own a contract.
Spot = No leverage.
Futures = High leverage possible.
Spot = Profits only when price rises.
Futures = Profits when price rises or falls.
Spot = Best for beginners and investors.
Futures = Best for experienced traders and hedgers.
Spot = simplicity. Futures = flexibility, but higher risk.
5. Why Futures Can Be Risky
Leverage is attractive, but it cuts both ways:
A 10 percent drop with 10x leverage equals a 100 percent account loss.
Liquidations close positions automatically if collateral is too low.
6. When to Use Spot vs Futures
Use spot if you want to own crypto long-term.
Use spot if you prefer simplicity and no liquidation stress.
Use futures if you want to hedge your holdings.
Use futures if you need market exposure with limited capital.
Use futures only if you have strict discipline and risk control.
7. Combining Spot and Futures
Many professionals use both:
Hold spot ETH as a long-term investment.
Use futures shorts to hedge during downturns.
This balances long-term conviction with short-term protection.
Think of it like insurance: futures protect spot positions when markets get volatile.
8. Risk Management Is the Deciding Factor
Whether you trade spot or futures, risk management decides survival:
In spot: limit allocation per asset.
In futures: control leverage, set stop losses, and manage liquidation risk.
In both: size positions by account % risk.
Without a risk plan, futures become gambling and even spot can lead to poor results.
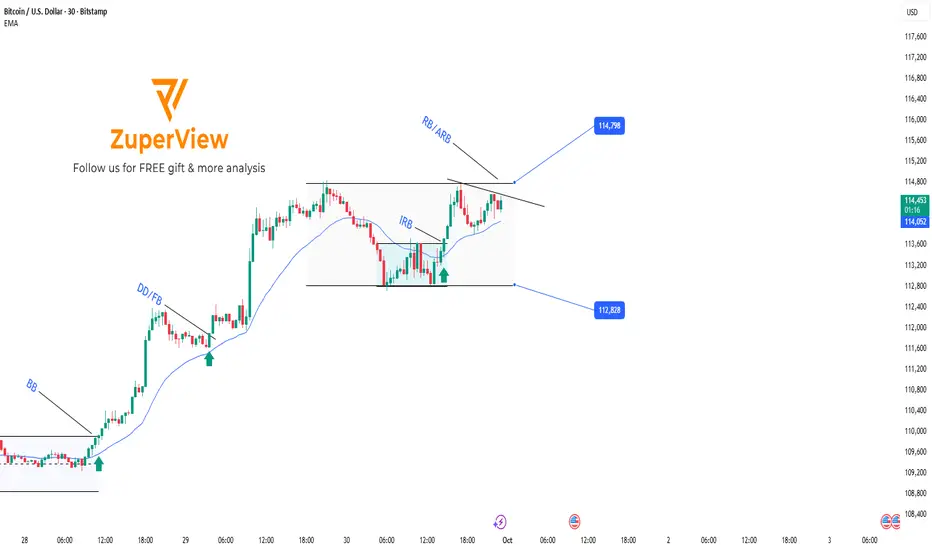
BTCUSD: Weekly reviewThis week, BITSTAMP:BTCUSD recorded a strong rally, moving from 109,900 → 120,800, equivalent to about +10,900 USD (+9.9%).
After last week’s sharp decline, the market clearly reversed into an uptrend as price broke out and held firmly above the EMA.
Today is Friday, and the market may experience strong volatility due to the Non-Farm Employment Change (NFP) report – an event that often has a major impact on price movement and trading strategies during the day.
Key Setups of the Week
1. BITSTAMP:BTCUSD Review – September 29
After a sharp drop, BTC rebounded, broke out of the range, and held above the EMA.
This was an early signal confirming a trend reversal from bearish to bullish.
2. BTC Review – September 30
After breaking out of the larger range and rallying strongly, the plan was to wait for a pullback toward the EMA.
Price formed a diagonal wave and gave confirmation signals through DD (Double Doji) / FB (First Breakout).
The entry was triggered, and the market rallied nicely, hitting the target as expected.
3. BTC Review – October 1
After the rally, BTC retraced and closed below the EMA.
At this point, the short-term trend was unclear → staying out and waiting for more market data to avoid unnecessary risk.
4. BTC Review – October 2
On the following day, price recovered and consolidated right at the upper boundary of the range.
EMA pressed tightly, creating a momentum compression zone and setting up for the next breakout.
The plan was to wait for RB/ARB confirmation, then Buy following the breakout.
This setup worked out successfully, BTC broke out strongly and continued to hit the target.
5. BTC Review – October 3
The main bullish trend continued, showing no signs of weakness.
The plan: wait for a pullback to the EMA, confirm a FB/SB (Second Breakout) signal, then Buy in line with the uptrend.
The scenario played out accurately, delivering another profitable setup.
Conclusion
Trend of the week: Clearly bullish.
Buy setups around EMA and breakout strategies performed effectively, resulting in a consistent winning streak.
Caution for today: With NFP on the schedule, unusual volatility may occur. Traders should manage risk carefully and patiently wait for clear confirmation signals before entering the market.
You can refer to my previous analysis here:
Please like and comment below to support our traders. Your reactions motivate us to do more analysis in the future 🙏✨
Daniel Miller @ ZuperView

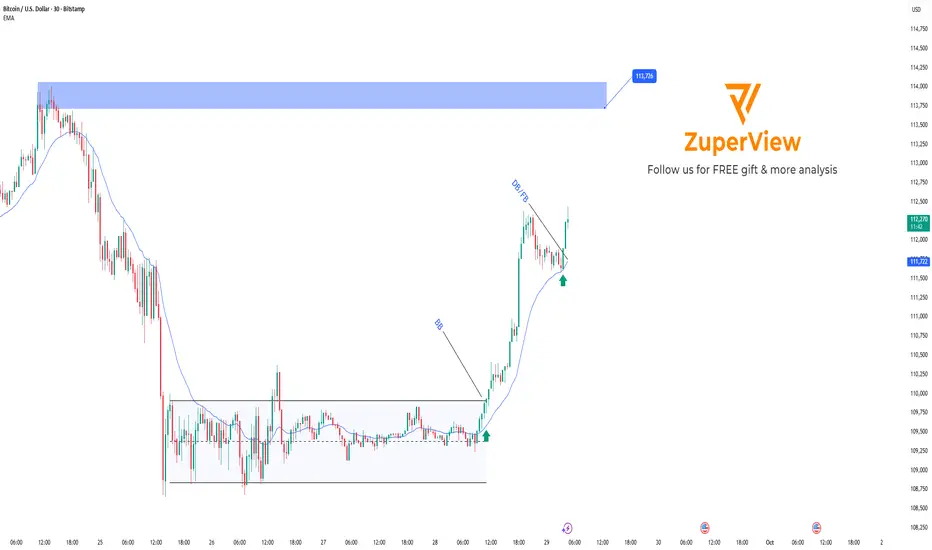
BTC escapes consolidation, shifting into an uptrend
Price has broken out of the sideway range 108,500 – 109,800, shifting from bearish to bullish.
After the BB (Block Breakout), BTC surged to 112,500 – 113,000 before consolidating.
Currently, price is trading far from the EMA (around 111,100), implying a possible pullback.
Strategy:
Wait for price to retrace toward EMA (111,000 – 111,200) or consolidate in this zone.
If patterns such as DD (Double Doji) or FB (First Breakout) form within 111,000 – 111,500, consider long entries.
Please like and comment to support our traders. Your feedback motivates us to produce more analysis in the future 🙏✨
BTC breakout trading setupBITSTAMP:BTCUSD is currently consolidating within the 112,828–114,798 sideway range.
Earlier, the market broke out from a smaller accumulation inside the larger range, generating an IRB (Inside Range Break) signal, pushing price back toward the upper boundary.
Price is now forming a momentum consolidation, indicating potential for another breakout.
2 Possible Scenarios
1. RB (Range Break)
Price compresses further with EMA pressing tightly.
A strong breakout directly above the range top may occur with momentum.
2. ARB (Advance Range Break)
After breaking above the range, instead of continuing higher immediately, price may stall.
A new consolidation forms just above the broken range, with EMA pressing upward.
This setup may signal a continuation of the previous breakout move.
You can refer to my previous analysis here:
Please like and comment below to support our traders. Your reactions motivate us to do more analysis in the future 🙏✨
Daniel Miller @ ZuperView
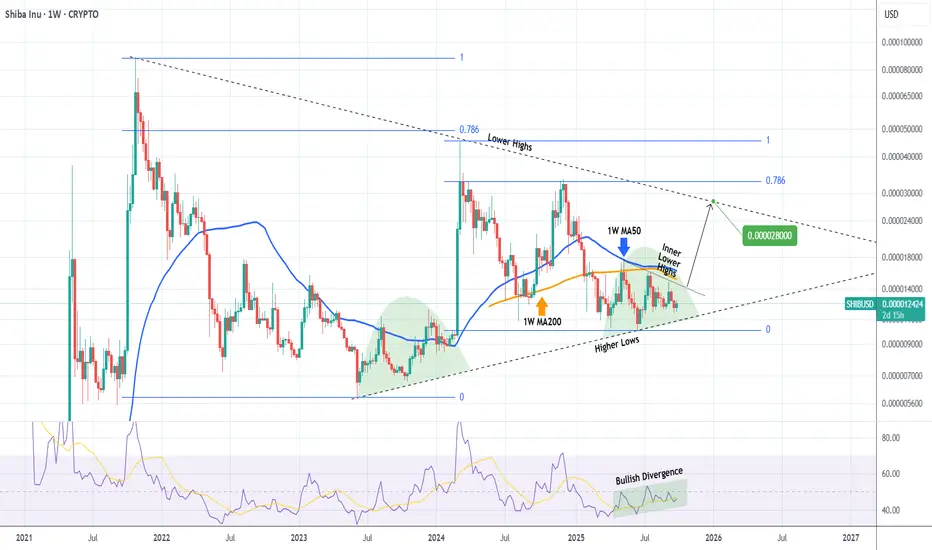
SHIBA Strong break-out expected, targeting 0.000028!Shiba Inu (SHIBUSD) has been trading within a Triangle pattern since the October 25 2021 Top of its previous Bull Cycle. The successive Lower Highs of the current Cycle have failed to make a new All Time High (ATH) and have 'trapped' the price action below its 1W MA50 (blue trend-line), is a similar Accumulation Phase on the Higher Lows like June 2023 - January 2024.
However, the 1W RSI has been rising within a Channel Up, showcasing a technical Bullish Divergence. If the price breaks above the Inner Lower Highs trend-line, it will be a first Buy Signal with confirmation coming above the 1W MA50. In that case, we expect at least a 0.000028 test of the Triangle's top (Lower Highs), still a conservative target given that the 2024 rally almost hit its 0.786 Fibonacci retracement level.
-------------------------------------------------------------------------------
** Please LIKE 👍, FOLLOW ✅, SHARE 🙌 and COMMENT ✍ if you enjoy this idea! Also share your ideas and charts in the comments section below! This is best way to keep it relevant, support us, keep the content here free and allow the idea to reach as many people as possible. **
-------------------------------------------------------------------------------
💸💸💸💸💸💸
👇 👇 👇 👇 👇 👇
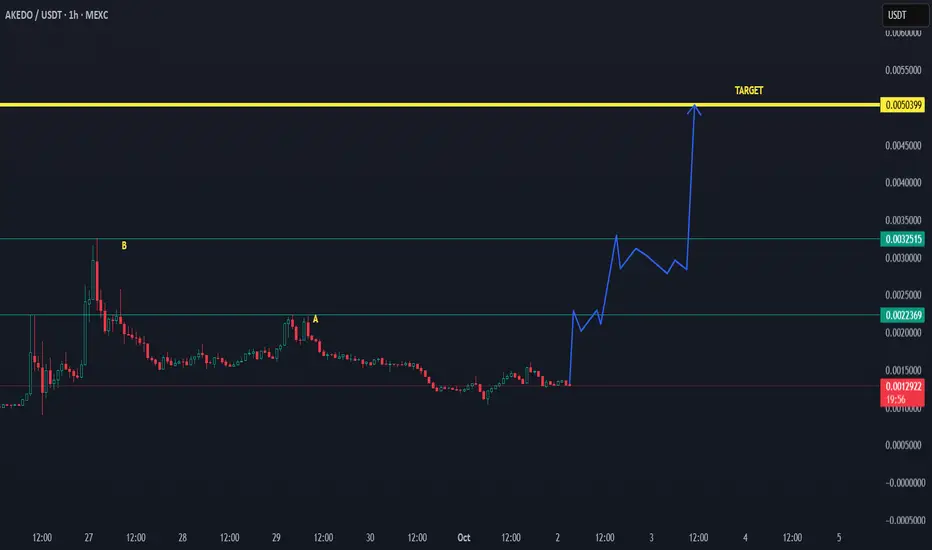
AKE ON WAY TO THE TARGET $0,005 AND THE NEW ATH - UP: 03-10-2025✅ AKEDO has confirmed above the low time frame zone around 0.00160, showing strong support holding.
📈 This setup increases the probability of a breakout move:
First target zone: 0.00326 (yellow line)
Main target: 0.00500 USDT
As long as the coin remains above the confirmation zone, momentum is bullish and the breakout can happen at any time.
⚡ Outlook: Structure is aligned for continuation toward the higher targets, with strong upside potential if volume follows.

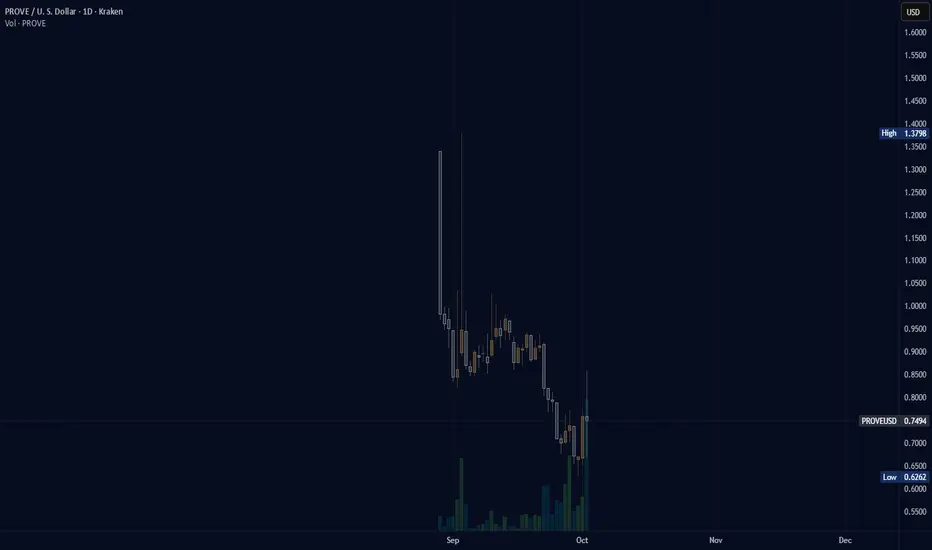
(PROVE) succinct "listed to kraken"When I was doing the end of month tally I did notice a few companies that were listed on Coinbase that were not available on Kraken. The next day I noticed PROVE was on Kraken. Did it slip by unnoticed inpublicly based on the new listings page of kraken or did I not write it down at the time. I check new listings for Kraken daily, practically, and even if a day or two goes by when I miss checking I usually catch up quickly.
BITCOIN Are we going to see 'UPTOBER' this time??Bitcoin (BTCUSD) has historically seen incredible rallies during the month of October and even more so those Octobers of the last years of Bull Cycles, like the one we are at now. Those rally phases have been very accurately called 'Uptober' rallies.
More specifically, the last three such Octobers (2021, 2017 and 2013) have been massively bullish, all starting after September corrections (Channel Down patterns). In 2013, October reached the 2.382 Fibonacci extension from September's correction, in 2017 and 2021 it reached the 1.786 Fibonacci ext.
As a result, if 'Uptober' is repeated again, this historic price actions gives us an optimistic Target at $132k (Fib 2.382) and a less optimistic one at $125.5k (Fib 1.786).
Do you think we will get such Uptober one more time? Feel free to let us know in the comments section below!
-------------------------------------------------------------------------------
** Please LIKE 👍, FOLLOW ✅, SHARE 🙌 and COMMENT ✍ if you enjoy this idea! Also share your ideas and charts in the comments section below! This is best way to keep it relevant, support us, keep the content here free and allow the idea to reach as many people as possible. **
-------------------------------------------------------------------------------
💸💸💸💸💸💸
👇 👇 👇 👇 👇 👇

AKE/USDT STARTING TO MAKE A HISTORY.. UPDATE 02-10-2025📊AKEDO/USDT Trading Update
Price has been consolidating after a long decline, forming a potential cycle bottom.
The chart shows step-by-step breakout levels:
First resistance at 0.00223 USDT
Next confirmation level at 0.00325 USDT
If momentum continues and these levels flip into support, the structure supports a push toward the main target of $0.005.
✅ Outlook: As long as price stays stable and buyers hold the base, the chance of a strong breakout remains high. The pattern suggests a possible cycle rally with over 3x upside potential.
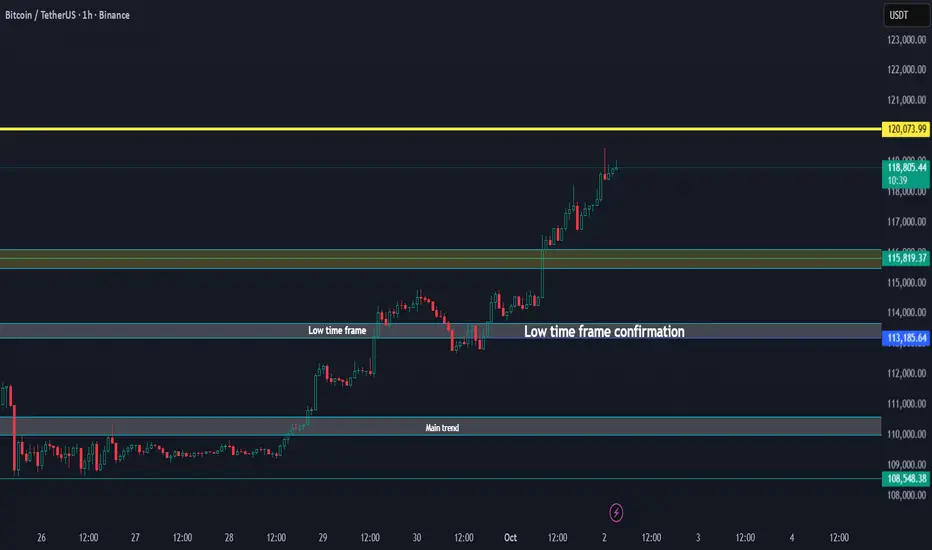
BTC Above All Key Levels, Trend Points Higher Update 02-10-2025🚀 Bitcoin / USDT Update
Bitcoin has broken above all key levels, showing strong momentum.
Main trend has been secured.
Low time frame is confirmed and holding.
Price is currently pushing into new zones with upside pressure.
If this strength continues, BTC could extend toward the 120K region, and a new trend could unlock further upside potential beyond that.
✅ As long as Bitcoin stays above the confirmation zone (~113K support), momentum remains bullish.
CRONOS Giant Bull Flag can lead it to 0.85000 just like in 2021.Cronos (CROUSD) has been trading within a Bullish Megaphone through the entirety of its current Bull Cycle. Ahead of its first 1W Golden Cross, the pattern draws many similarities with the Bullish Megaphone of the previous Cycle.
More specifically, it appears we are inside a Bull Flag similar to April - May 2021, which after testing and holding the 1W MA100 (green trend-line), it rebounded and peaked just above the 1.618 Fibonacci extension.
As you can see the Fibonacci structure between the two Megaphones is quite similar, giving high probabilities of a continuation. As a result, as long as the 1W MA00 holds, we expect Cronos to dip some more and then rebound to 0.85000 (Fib 1.618 ext).
-------------------------------------------------------------------------------
** Please LIKE 👍, FOLLOW ✅, SHARE 🙌 and COMMENT ✍ if you enjoy this idea! Also share your ideas and charts in the comments section below! This is best way to keep it relevant, support us, keep the content here free and allow the idea to reach as many people as possible. **
-------------------------------------------------------------------------------
💸💸💸💸💸💸
👇 👇 👇 👇 👇 👇

BTCUSDTHello Traders! 👋
What are your thoughts on Bitcoin?
Bitcoin continues to move within a valid ascending channel. After a recent correction, price successfully broke above the descending trendline and reclaimed a key resistance area.
Currently, the previous high near the 120,000 level is acting as a resistance barrier. A short-term pullback toward the broken structure is expected. If this area holds as support, the price is likely to resume its upward move and attempt to break the previous high.
As long as the price holds above the support zone and the bottom of the ascending channel — and does not break below the previous low — this bullish scenario remains valid.
The medium-term outlook remains positive, and pullbacks may offer new buying opportunities.
What do you think? Will Bitcoin break above the previous high, or is a deeper correction ahead?
Don’t forget to like and share your thoughts in the comments! ❤️
