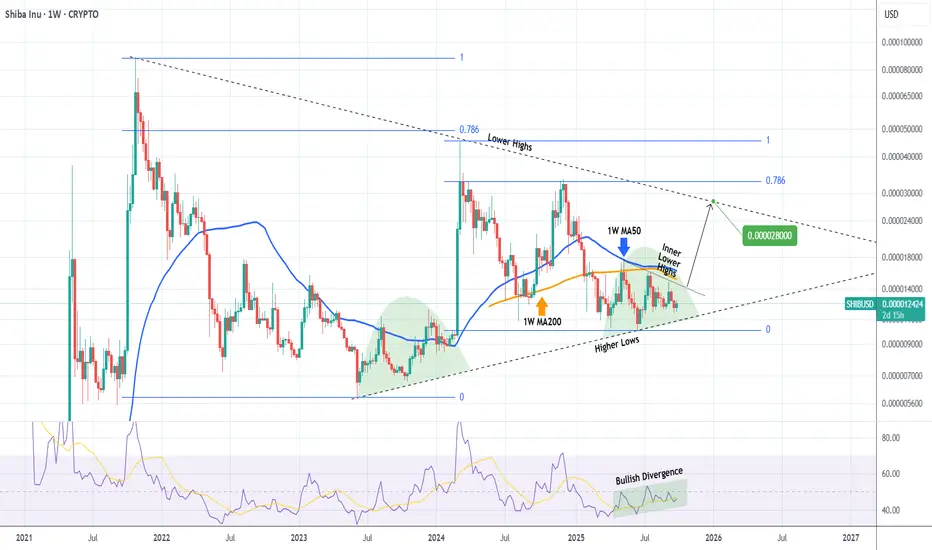
SHIBA Strong break-out expected, targeting 0.000028!Shiba Inu (SHIBUSD) has been trading within a Triangle pattern since the October 25 2021 Top of its previous Bull Cycle. The successive Lower Highs of the current Cycle have failed to make a new All Time High (ATH) and have 'trapped' the price action below its 1W MA50 (blue trend-line), is a similar Accumulation Phase on the Higher Lows like June 2023 - January 2024.
However, the 1W RSI has been rising within a Channel Up, showcasing a technical Bullish Divergence. If the price breaks above the Inner Lower Highs trend-line, it will be a first Buy Signal with confirmation coming above the 1W MA50. In that case, we expect at least a 0.000028 test of the Triangle's top (Lower Highs), still a conservative target given that the 2024 rally almost hit its 0.786 Fibonacci retracement level.
-------------------------------------------------------------------------------
** Please LIKE 👍, FOLLOW ✅, SHARE 🙌 and COMMENT ✍ if you enjoy this idea! Also share your ideas and charts in the comments section below! This is best way to keep it relevant, support us, keep the content here free and allow the idea to reach as many people as possible. **
-------------------------------------------------------------------------------
💸💸💸💸💸💸
👇 👇 👇 👇 👇 👇
Cryptocurrency
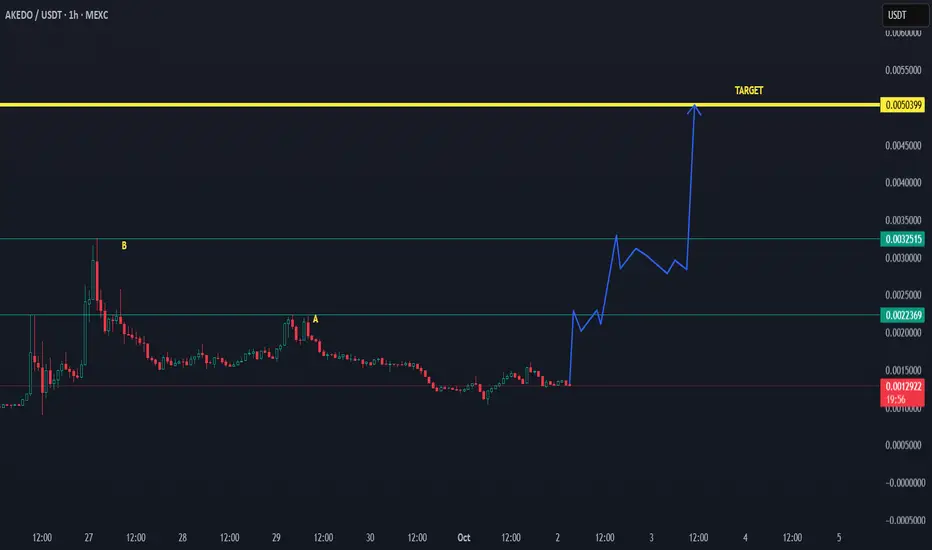
AKE ON WAY TO THE TARGET $0,005 AND THE NEW ATH - UP: 03-10-2025✅ AKEDO has confirmed above the low time frame zone around 0.00160, showing strong support holding.
📈 This setup increases the probability of a breakout move:
First target zone: 0.00326 (yellow line)
Main target: 0.00500 USDT
As long as the coin remains above the confirmation zone, momentum is bullish and the breakout can happen at any time.
⚡ Outlook: Structure is aligned for continuation toward the higher targets, with strong upside potential if volume follows.

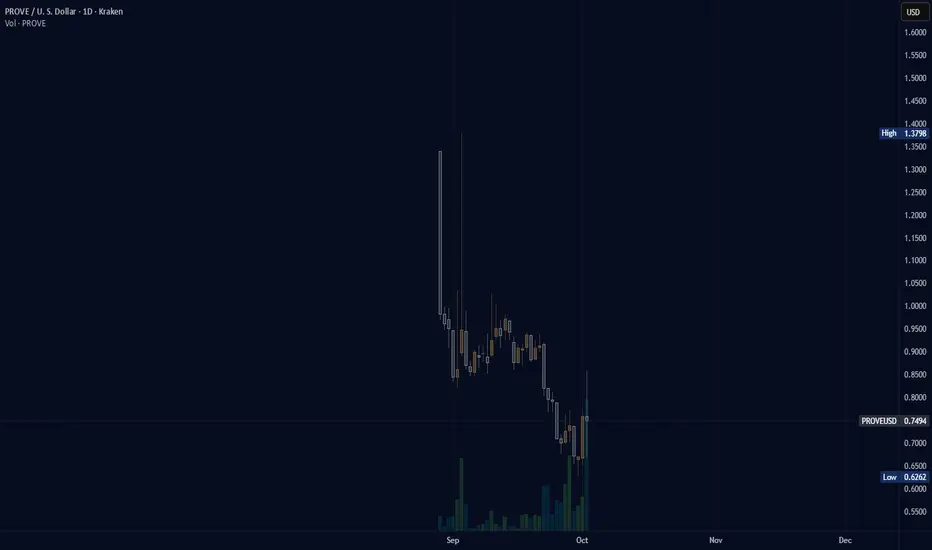
(PROVE) succinct "listed to kraken"When I was doing the end of month tally I did notice a few companies that were listed on Coinbase that were not available on Kraken. The next day I noticed PROVE was on Kraken. Did it slip by unnoticed inpublicly based on the new listings page of kraken or did I not write it down at the time. I check new listings for Kraken daily, practically, and even if a day or two goes by when I miss checking I usually catch up quickly.
BITCOIN Are we going to see 'UPTOBER' this time??Bitcoin (BTCUSD) has historically seen incredible rallies during the month of October and even more so those Octobers of the last years of Bull Cycles, like the one we are at now. Those rally phases have been very accurately called 'Uptober' rallies.
More specifically, the last three such Octobers (2021, 2017 and 2013) have been massively bullish, all starting after September corrections (Channel Down patterns). In 2013, October reached the 2.382 Fibonacci extension from September's correction, in 2017 and 2021 it reached the 1.786 Fibonacci ext.
As a result, if 'Uptober' is repeated again, this historic price actions gives us an optimistic Target at $132k (Fib 2.382) and a less optimistic one at $125.5k (Fib 1.786).
Do you think we will get such Uptober one more time? Feel free to let us know in the comments section below!
-------------------------------------------------------------------------------
** Please LIKE 👍, FOLLOW ✅, SHARE 🙌 and COMMENT ✍ if you enjoy this idea! Also share your ideas and charts in the comments section below! This is best way to keep it relevant, support us, keep the content here free and allow the idea to reach as many people as possible. **
-------------------------------------------------------------------------------
💸💸💸💸💸💸
👇 👇 👇 👇 👇 👇

AKE/USDT STARTING TO MAKE A HISTORY.. UPDATE 02-10-2025📊AKEDO/USDT Trading Update
Price has been consolidating after a long decline, forming a potential cycle bottom.
The chart shows step-by-step breakout levels:
First resistance at 0.00223 USDT
Next confirmation level at 0.00325 USDT
If momentum continues and these levels flip into support, the structure supports a push toward the main target of $0.005.
✅ Outlook: As long as price stays stable and buyers hold the base, the chance of a strong breakout remains high. The pattern suggests a possible cycle rally with over 3x upside potential.
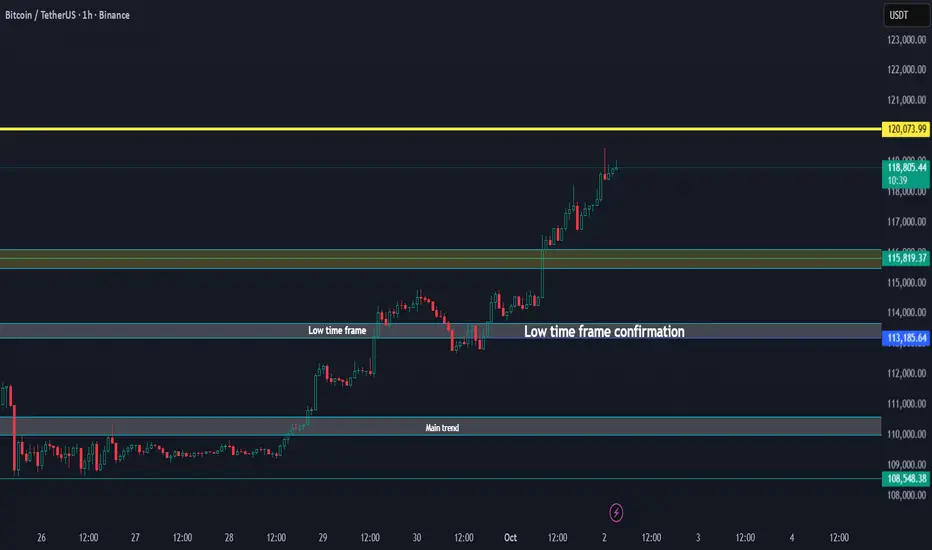
BTC Above All Key Levels, Trend Points Higher Update 02-10-2025🚀 Bitcoin / USDT Update
Bitcoin has broken above all key levels, showing strong momentum.
Main trend has been secured.
Low time frame is confirmed and holding.
Price is currently pushing into new zones with upside pressure.
If this strength continues, BTC could extend toward the 120K region, and a new trend could unlock further upside potential beyond that.
✅ As long as Bitcoin stays above the confirmation zone (~113K support), momentum remains bullish.
CRONOS Giant Bull Flag can lead it to 0.85000 just like in 2021.Cronos (CROUSD) has been trading within a Bullish Megaphone through the entirety of its current Bull Cycle. Ahead of its first 1W Golden Cross, the pattern draws many similarities with the Bullish Megaphone of the previous Cycle.
More specifically, it appears we are inside a Bull Flag similar to April - May 2021, which after testing and holding the 1W MA100 (green trend-line), it rebounded and peaked just above the 1.618 Fibonacci extension.
As you can see the Fibonacci structure between the two Megaphones is quite similar, giving high probabilities of a continuation. As a result, as long as the 1W MA00 holds, we expect Cronos to dip some more and then rebound to 0.85000 (Fib 1.618 ext).
-------------------------------------------------------------------------------
** Please LIKE 👍, FOLLOW ✅, SHARE 🙌 and COMMENT ✍ if you enjoy this idea! Also share your ideas and charts in the comments section below! This is best way to keep it relevant, support us, keep the content here free and allow the idea to reach as many people as possible. **
-------------------------------------------------------------------------------
💸💸💸💸💸💸
👇 👇 👇 👇 👇 👇

BTCUSDTHello Traders! 👋
What are your thoughts on Bitcoin?
Bitcoin continues to move within a valid ascending channel. After a recent correction, price successfully broke above the descending trendline and reclaimed a key resistance area.
Currently, the previous high near the 120,000 level is acting as a resistance barrier. A short-term pullback toward the broken structure is expected. If this area holds as support, the price is likely to resume its upward move and attempt to break the previous high.
As long as the price holds above the support zone and the bottom of the ascending channel — and does not break below the previous low — this bullish scenario remains valid.
The medium-term outlook remains positive, and pullbacks may offer new buying opportunities.
What do you think? Will Bitcoin break above the previous high, or is a deeper correction ahead?
Don’t forget to like and share your thoughts in the comments! ❤️

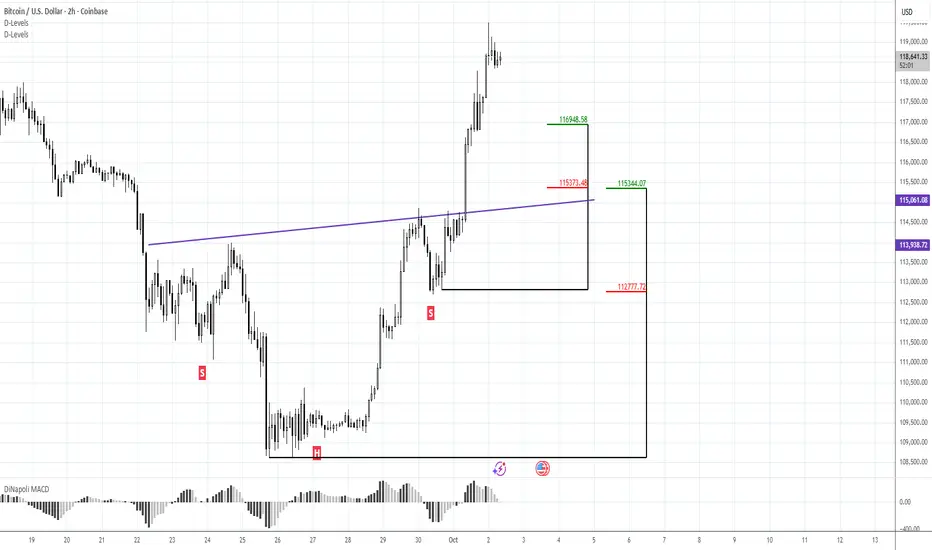
Next Upside BTC target is 126-127.30K. Beware of OverboughtMorning folks,
So BTC not has just formed big H&S but already completed it. But it is not a reason for upset. We consider 126-127.30K as the next upside target, based on weekly butterfly scenario .
Still, due to very fast action market hits overbought on daily chart. We prefer to wait for tactical pullback, somewhere to 117K or or even 115.3K support levels before thinking about long entry.
I mark this idea as" bearish" because of retracement expectations, but overall context is bullish of course...
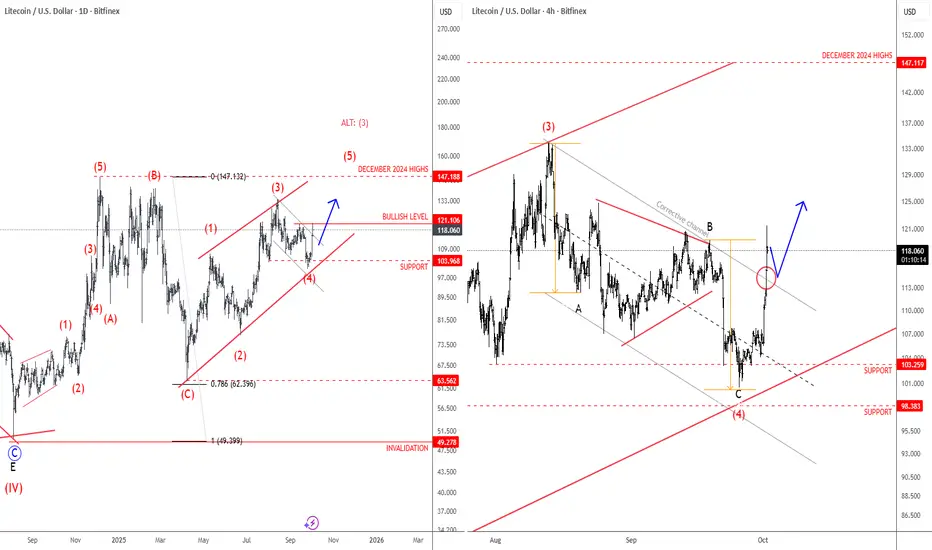
Litecoin Is Still Eyeing December 2024 HighsLitecoin turned lower recently, but we believe this is just another corrective retracement within a broader bullish trend, which has been showing higher swing lows since the rebound from the 78.6% Fibonacci level back in April. We expect that retracement down from the December highs will be fully retraced, meaning there’s room for a push up toward 147 as illustrated on a daily chart. It can be looking for wave (5) of a diagonal pattern, or alternatively, maybe even wave (3) if it extends decisively above upper diagonal line and goes for 200 area. In the 4-hour chart, we got a sharp rebound from projected support and back above channel resistance line after we noticed an ABC correction, so bulls are back, and we may easily see more gains toward December 2024 highs, just watch out for short-term pullbacks.
BTC consolidates after a significant price spikeBITSTAMP:BTCUSD price has had a slight correction after the previous increase.
Yesterday, the price broke the trendline and the EMA approached, creating a momentum accumulation zone before a strong break - as planned to buy.
Currently, BTC is correcting after the increase, just cutting down the EMA, showing that buying power is weakening, the short-term trend may turn down.
There is no clear signal to enter the order. Continue to observe the price reaction around the EMA and wait for a clear setup before taking action.
You can refer to my previous analysis here:
Please like and comment to support our traders. Your feedback motivates us to produce more analysis in the future 🙏✨

BITCOIN making a bullish break-out similar to July'sBitcoin (BTCUSD) just broke above the Lower Highs trend-line of its August 14 All Time High (ATH). This was implemented after a bottom on the 5-month Higher Lows trend-line as well as the 1D RSI Support.
The last time all those conditions were fulfilled was on the July 02 Lower Highs break-out, after which BTC completed a +25.33% rally from the Low, almost touching its 1.786 Fibonacci extension.
Ahead of another 4H Golden Cross, just like then, we expect Bitcoin to make another +25.33% Bullish Leg and reach at least $136000 on the medium-term.
Do you think that's reasonable to expect within October? Feel free to let us know in the comments section below!
-------------------------------------------------------------------------------
** Please LIKE 👍, FOLLOW ✅, SHARE 🙌 and COMMENT ✍ if you enjoy this idea! Also share your ideas and charts in the comments section below! This is best way to keep it relevant, support us, keep the content here free and allow the idea to reach as many people as possible. **
-------------------------------------------------------------------------------
💸💸💸💸💸💸
👇 👇 👇 👇 👇 👇

AKE ON WAY TO MAIN TREND - UPDATE 30-10-2025📊 AKEDO/USDT Update
The coin is now trading above the low time frame zone (0.00129 – 0.00133), showing strength after the recent recovery.
If momentum continues, the next key area is the main trend zone (0.00170 – 0.00190).
Once price enters and holds this main trend, there’s open space above with potential continuation toward 0.00259.
As long as AKEDO stays above the low time frame, bias remains positive for a push toward the main trend.
✅ Outlook: Strong chance of continuation if main trend is reclaimed.

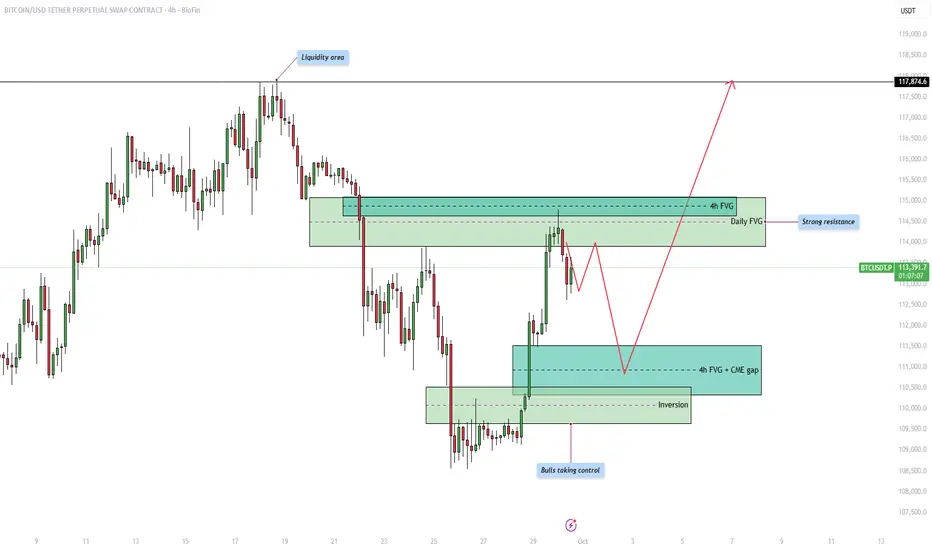
Bitcoin - Shortterm correction in the bullish trend!Introduction
The Bitcoin price action is currently moving within a structured range where both liquidity and fair value gaps (FVGs) are playing an important role in shaping potential market direction. By analyzing the chart, we can identify key areas of liquidity, resistance, and support that traders are likely to pay close attention to in the coming days. Understanding how price reacts around these zones will help anticipate whether bulls can maintain control or if bears will attempt to reclaim lost ground.
Upside liquidity
At the top of the range, we can see a clear liquidity area where price previously reversed. This liquidity pool represents buy-side liquidity, and the market could be drawn towards it as price seeks to sweep the highs. Liquidity is often targeted by the market before making a significant move in the opposite direction, which makes this area important to watch closely.
Resistance from the 4h and daily FVG
Before price can reach higher liquidity levels, it must contend with a strong resistance zone that overlaps with both the 4-hour and the daily fair value gap. This confluence strengthens the resistance, making it more likely that price will struggle to break through immediately. Traders will be watching for signs of rejection within this area, which could cause short-term pullbacks before any potential breakout.
4h FVG and CME gap support
On the downside, the 4-hour fair value gap aligns with the CME gap, providing a strong support level. This zone acts as an attractive area for price to retrace into before continuing higher. It is common for the market to return to such imbalances to fill inefficiencies, so a temporary dip into this support could serve as a healthy retracement before bulls attempt to push price further upward.
Bullish inversion
Another critical development is the inversion zone, where previous resistance has now flipped into support. This shift highlights that bulls are taking control of the market structure, strengthening the overall bullish outlook. As long as this inversion level holds, buyers are likely to defend it aggressively, reducing the probability of a deeper breakdown.
Final thoughts
Overall, the market remains in a bullish posture with upside liquidity acting as a magnet, but significant resistance awaits at the overlapping 4h and daily FVG. Short-term pullbacks into the 4h FVG and CME gap support are likely before the next major move upward. If the bullish inversion continues to hold, we could see a strong push towards the higher liquidity zones, potentially targeting levels beyond 117,000. The coming days will be crucial in determining whether bulls can maintain this control or if resistance proves too strong.
-------------------------
Thanks for your support. If you enjoyed this analysis, make sure to follow me so you don't miss the next one. And if you found it helpful, feel free to drop a like 👍 and leave a comment 💬, I’d love to hear your thoughts!
FINALLY LIGHT CONFIRMS THE LOW TIME FRAME - BREAK UP $1.40Based on trend analysis, the chart shows a confirmed low-timeframe activation. This setup suggests that ALPINE could, with time, break above the $1.40 level and potentially move toward the main target around $2.
The trend is going in waves, we expect there will come a moment when this token will go out the normal trend of waves and against BTC to break up the $1.40

XLMUSD getting ready for an explosive break-out.Stellar (XLMUSD) has been trading within a Descending Triangle since the July 18 High and currently is ranging within its Support level and the 1D MA50 (blue trend-line).
A similar Ascending Triangle back in May - June, rallied aggressively to its 2.0 Fibonacci extension (the July 18 High) after breaking above both its Lower Highs trend-line and the 1D MA50. Even the 1D RSI sequences among the two fractals are similar.
As a result, if the price breaks above the 1D MA50 - Lower Highs trend-line, we will turn bullish, targeting 0.78000 (Fib 2.0 ext).
-------------------------------------------------------------------------------
** Please LIKE 👍, FOLLOW ✅, SHARE 🙌 and COMMENT ✍ if you enjoy this idea! Also share your ideas and charts in the comments section below! This is best way to keep it relevant, support us, keep the content here free and allow the idea to reach as many people as possible. **
-------------------------------------------------------------------------------
💸💸💸💸💸💸
👇 👇 👇 👇 👇 👇

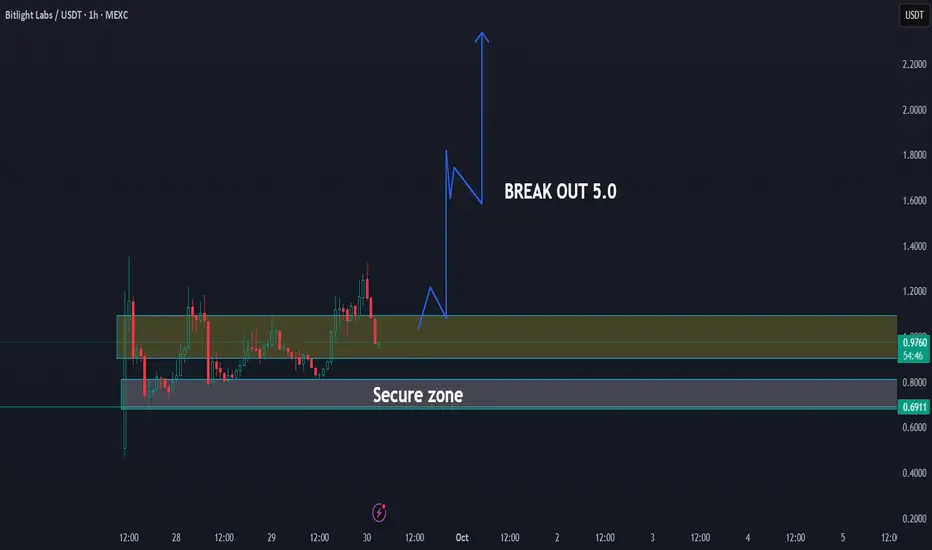
LIGHT CAN BREAKOUT AS MYX did before - UPDATE 30-09-2025LIGHT / USDT Trading Update
🔹 The coin is currently consolidating inside the secure zone, showing strong accumulation signs.
📊 As long as price holds this area, the probability of a major breakout remains high.
🚀 Similar to MYX, once momentum builds, this setup has the potential to break out toward the $2.00 level.
🔑 Key breakout confirmation will come once price clears the resistance zone.
📌 Summary:
Light is forming a strong base, and as long as the secure zone holds, the chart suggests a high chance for breakout, with the first major target set at $2.00.
Bitcoin HOLDING THE MAIN TREND.. UPDATE 30-09-2025BTC/USDT Update
🔻 Bitcoin is currently trading below the low time frame zone, showing short-term weakness.
✅ However, BTC is still holding the main trend, which keeps the bigger picture positive.
📊 As long as the main trend support (around $110K) is defended, the market structure remains intact.
🚀 A rebound from this area could bring BTC back into the low time frame range and open the way toward $115K+.
📌 Summary:
BTC lost the low time frame, but the fact that it’s holding the main trend is a key positive signal. This level is crucial for maintaining the bullish outlook.

BITCOIN Did the 1W MA20 just save the day??On one of our recent analyses we talked about the importance of the 1W MA20 (red trend-line) for Bitcoin (BTCUSD) and the continuation of its non-stop bullish trend since the April 07 2025 Low.
As mentioned then, BTC was likely to extend the trend as long as the 1W candles keep closing above the 1W MA20. The three times a candle didn't, since June 2023, the price declined more to hit (or come very close to) the 1W MA50 (blue trend-line).
Last week was again a successful 1W candle close above the 1W MA50, third time in a month (since August 25) to do so. Technically that solidifies it as a Support and as long as it holds, Bitcoin has more probabilities to repeat at least a +96.38% rally ('weakest' rally it had on this Bull Cycle) and test $145000.
So do you think the 1W MA50 just saved the day and a new rally is ahead of us? Feel free to let us know in the comments section below!
-------------------------------------------------------------------------------
** Please LIKE 👍, FOLLOW ✅, SHARE 🙌 and COMMENT ✍ if you enjoy this idea! Also share your ideas and charts in the comments section below! This is best way to keep it relevant, support us, keep the content here free and allow the idea to reach as many people as possible. **
-------------------------------------------------------------------------------
💸💸💸💸💸💸
👇 👇 👇 👇 👇 👇

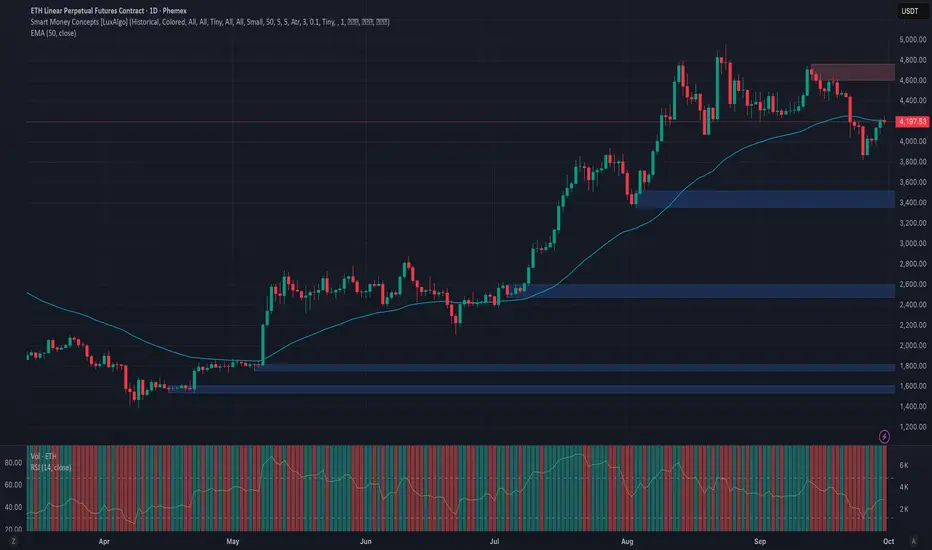
Phemex Analysis #107: Pro Tips for Trading Ethereum (ETH)Ethereum (ETH) has pushed back into the spotlight after shaking off early‑summer weakness and reclaiming the psychological $4,000 handle. With price now hovering near $4,200, buyers have stepped back in and the daily chart shows a clean sequence of higher lows—story beats that often precede a decisive move. The question on every trader’s mind: does ETH press higher from here, or does it need one more reset before the next leg?
Possible Scenarios
1) Bullish Breakout — momentum carries above nearby supply
If ETH can extend above the immediate supply zone (watch the $4,300–$4,350 band) on rising volume, a trend continuation opens toward $4,500 and a stretch into $4,800.
Pro Tips:
Entry: Look for a strong daily close through $4,350 or a break‑and‑retest that holds as support.
Risk: Initial stop below the breakout zone (~$4,000), then trail under higher lows.
Profit‑taking: Scale out into $4,500 and $4,800 while leaving a runner if momentum expands.
2) Range & Accumulation — base building above $4,000
ETH may continue to coil between $4,000 support and $4,350 resistance while the market digests macro cues and liquidity rotates across majors.
Pro Tips:
Plan the box: Accumulate near $4,000, lighten up into $4,300–$4,350.
Avoid the middle: Wait for edges; don’t chase mid‑range noise.
Watch volume: Expansion at range edges often telegraphs the break direction.
3) Bearish Pullback — liquidity sweep into deeper supports
Failure to hold $4,000 on heavy sell volume invites a deeper flush toward $3,750 and, in a heavier risk‑off tape, $3,500.
Pro Tips:
Defense first: Cut risk on a decisive daily close below $4,000.
DCA with discipline: Long‑term bulls can consider staggered bids only after stabilization (shrinking candles, waning sell volume, higher‑low attempts) near $3,750 / $3,500.
Re‑entry tells: Look for momentum divergences or a strong reclaim of $4,000 to re‑engage.
Conclusion
ETH sits at a pivotal zone with a clear if/then map:
If $4,350 breaks and holds → ride the trend toward $4,500–$4,800.
If the range persists → harvest the $4,000–$4,350 box with tight risk.
If $4,000 fails → wait for stabilization at $3,750 / $3,500 before redeploying.
Anchored by deep liquidity, relentless builder activity, and a maturing staking and L2 ecosystem, Ethereum remains the market’s bellwether. Trade the levels, respect the tape, and let structure—not emotion—drive your decisions.
🔥 Tips:
Armed Your Trading Arsenal with advanced tools like multiple watchlists, basket orders, and real-time strategy adjustments at Phemex. Our USDT-based scaled orders give you precise control over your risk, while iceberg orders provide stealthy execution.
Disclaimer: This is NOT financial or investment advice. Please conduct your own research (DYOR). Phemex is not responsible, directly or indirectly, for any damage or loss incurred or claimed to be caused by or in association with the use of or reliance on any content, goods, or services mentioned in this article.
Will Ripple (XRP) continue to sell XRP – Distribution Pattern & Elliott Wave Roadmap
We’ve now tapped this support line five times. The structure looks like another Lower High (LH) forming inside a distribution pattern.
• Bullish scenario: If price breaks above the LH structure, we could see continuation toward a new all-time high.
• Bearish scenario: If lower highs persist, I don’t expect a sixth touch of this support. Instead, a decisive break lower would confirm the top of Wave (5) and start a larger correction.
That correction should complete as a 3-wave structure, setting up the Super Cycle Wave (1) top. From there, leg 2 develops before a true leg 3 rally begins. Based on my count, that rally zone could emerge from $0.05 – $0.14.
This chart is part of my overall Elliott Wave view (see my first post). I’ll update that main chart when a minor leg one within this corrective phase is confirmed.
⚠️ CRYPTO:XRPUSD Stay tuned—updates will follow as CRYPTO:XRPUSD defines its path.

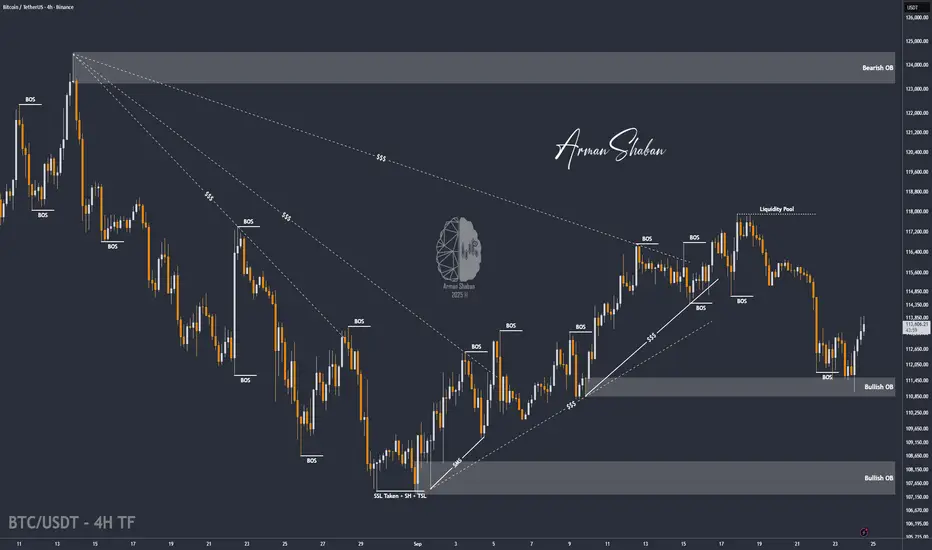
BTC/USDT | BTC Bounce After $111K Dip – Liquidity Gap in FocusBy analyzing the Bitcoin chart on the 4-hour timeframe, we can see that after a heavy correction down to $111,000, the price found demand again and is now trading around $113,600.
I expect Bitcoin to continue rising to fill the liquidity gap, with the first target at $114,150. Other targets and scenarios will be shared tomorrow!
Please support me with your likes and comments to motivate me to share more analysis with you and share your opinion about the possible trend of this chart with me !
Best Regards , Arman Shaban
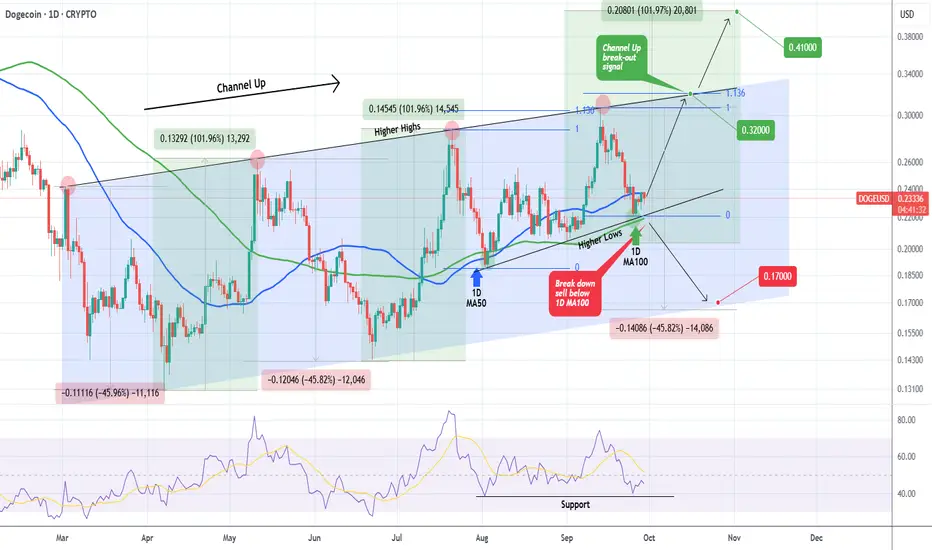
DOGE This is how to trade it in October.Dogecoin (DOGEUSD) has been trading within a Channel Up since March but recently has found a new Support on the Higher Lows trend-line that started on the August 03 Low. This price action has been additionally supported by the 1D MA100 (green trend-line).
As long as the 1D MA100 holds, October should see at least Doge testing the top (Higher Highs trend-line) of the pattern. Given that the previous Higher Lows rebound peaked on the 1.136 Fibonacci extension, our Target will be 0.3200.
If the Higher Highs trend-line breaks (1D candle close above it), extend buying to a total +101.96% rise from the bottom, targeting 0.41000.
If however the 1D MA100 breaks (candle close below it), we expect the Channel Up to go for a full pricing of a Higher Low bottom, on a similar -45.82% decline to both previous Bearish Legs, targeting 0.17000.
As a result, the current price action, which has Doge sitting just above the 1D MA100, offers a great reward on the lowest possible risk.
-------------------------------------------------------------------------------
** Please LIKE 👍, FOLLOW ✅, SHARE 🙌 and COMMENT ✍ if you enjoy this idea! Also share your ideas and charts in the comments section below! This is best way to keep it relevant, support us, keep the content here free and allow the idea to reach as many people as possible. **
-------------------------------------------------------------------------------
💸💸💸💸💸💸
👇 👇 👇 👇 👇 👇