Ethereum reached to our target
Ethereum reached to $3400 that we talked about since weeks ago, but now the daily RSI is at overbought area and we might see a correction.
Cryptocurrency

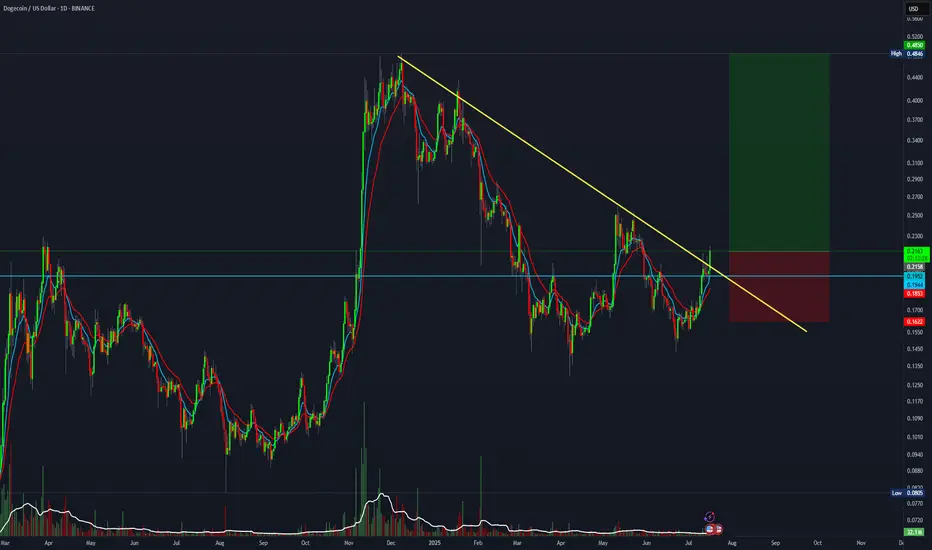
5:1 R:R for Dogecoin.DOGE is breaking out from the trendline. This setup offers a 5:1 R:R
Entry: 0.216
Stop Loss: 0.162
Target: 0.48
HBAR Is About to Melt Faces!I see a powerful reversal coming on HBAR due to a breakout from this falling wedge pattern. A new high above the $0.35 resistance should be coming soon. I’m bullish!
As always, stay profitable.
– Dalin Anderson

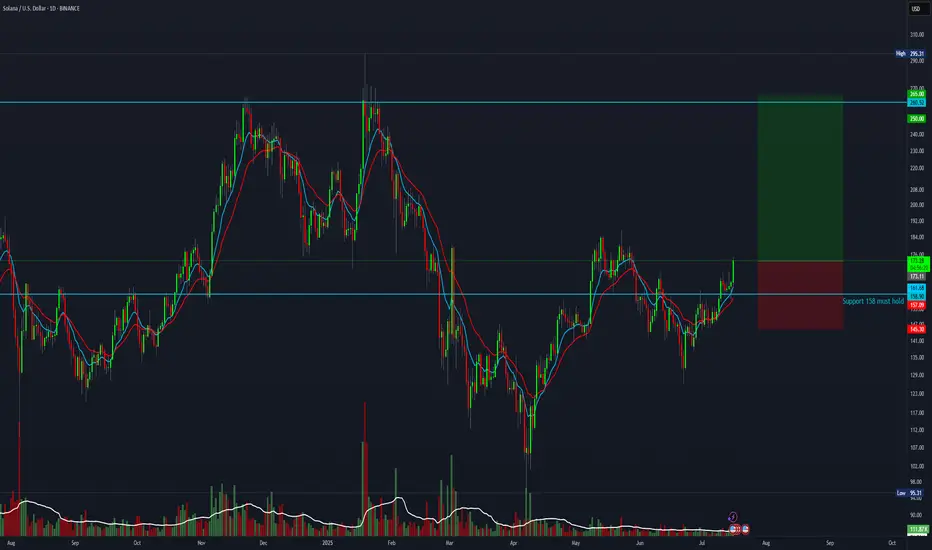
SOL trade setup with a 3.3:1 risk-to-reward ratioThis trade setup offers a 3.3:1 R:R
Entry: 174
Stop Loss: 145
Target: 265
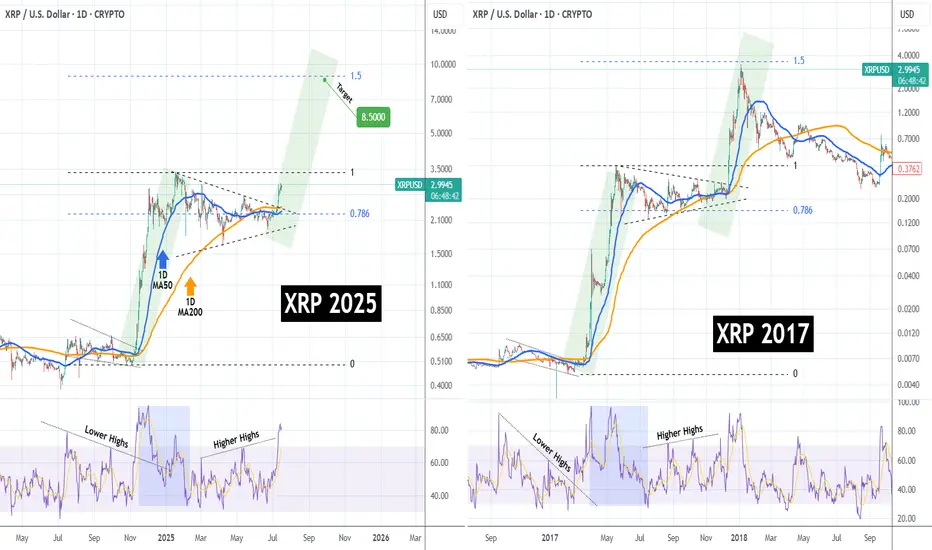
XRPUSD Has it started the mega rally to $8.500??XRP (XRPUSD) has been trading within a Triangle pattern for the past 6 months (January - July 2025) and only recently, it broke to the upside. Ahead of a pending 1D Golden Cross, this pattern is no different than the one of the previous Cycle from May - December 2017.
That setup resulted into the final Parabolic Rally of the Cycle that peaked just below the 1.5 Fibonacci extension. As you can see, both fractals are identical even from their starts, both initiated after a Falling Wedge that produced the first Parabolic Rally (green), which transitioned into the Triangle we described. Even their 1D RSI sequences are similar.
As a result, it is more than probable to see XRP hit $8.500 (Fib 1.5 ext), by the end of the year.
-------------------------------------------------------------------------------
** Please LIKE 👍, FOLLOW ✅, SHARE 🙌 and COMMENT ✍ if you enjoy this idea! Also share your ideas and charts in the comments section below! This is best way to keep it relevant, support us, keep the content here free and allow the idea to reach as many people as possible. **
-------------------------------------------------------------------------------
💸💸💸💸💸💸
👇 👇 👇 👇 👇 👇
Ethereum's Road to $7500 – Strategic Entries & Profit Optimizati🔵 Entry Zone: My first position is placed at $2225.5, aligning with a strong support level, while a secondary entry at $1857.5 serves as an additional safeguard against unexpected market swings—lowering my average purchase price and protecting capital.
💰 Profit-Taking Strategy: For low-risk traders, securing a 40% profit from the first entry is a prudent move to lock in gains early. However, my long-term target remains ambitious.
🚀 Main Target: Based on valuation models and fundamental news, Ethereum’s upside potential points toward $7500. However, I personally plan to secure 90% of my holdings at $6000, ensuring strong profit realization while leaving room for further upside.
This setup balances risk management, smart positioning, and strategic profit optimization. Let’s see how ETH’s trajectory unfolds!
Entry1: 2225.5
Entry 2: 1857.5
If your second entry is successful, you are required to withdraw 50 to 70 percent of your capital to maintain your capital. I will definitely update this setup.

BITCOIN Should we still trust the Stock to Flow model??It sure worked perfectly during Bitcoin's (BTCUSD) first Cycles, but the Stock-to-Flow model has greatly diverged from the current price action since March 2024.
Right now the model sits at around $750000, which is vastly above the current market price of $119000. It's been trading sideways actually since June 2024 and all of the times that it was ranging, Bitcoin eventually caught up and closed the gap.
It has always been a 'story' of divergence and convergence but it sure seems unrealistic to catch up this time, especially during if this Cycle continues to follow the 4-year model.
So what do you think? Should we still trust what seems more and more like an 'obsolete' model as mass adoption kicks in? Feel free to let us know in the comments section below!
-------------------------------------------------------------------------------
** Please LIKE 👍, FOLLOW ✅, SHARE 🙌 and COMMENT ✍ if you enjoy this idea! Also share your ideas and charts in the comments section below! This is best way to keep it relevant, support us, keep the content here free and allow the idea to reach as many people as possible. **
-------------------------------------------------------------------------------
💸💸💸💸💸💸
👇 👇 👇 👇 👇 👇

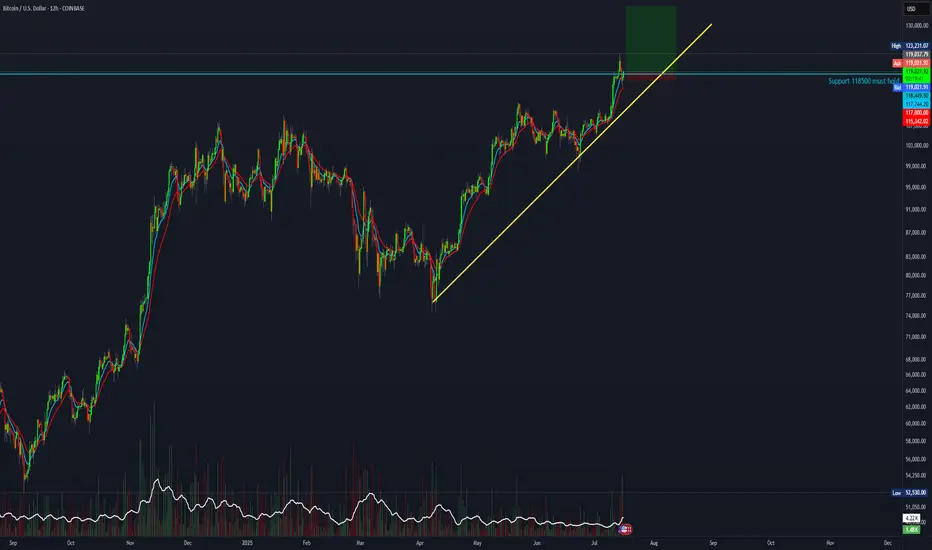
7:1 R:R setup for BTCIt looks like BTC has completed its pullback and is now continuing its uptrend. This trade setup offers a 7:1 R:R with a target of 135K
Entry: 118,900
Stop Loss: 117,000
Target: 135,000
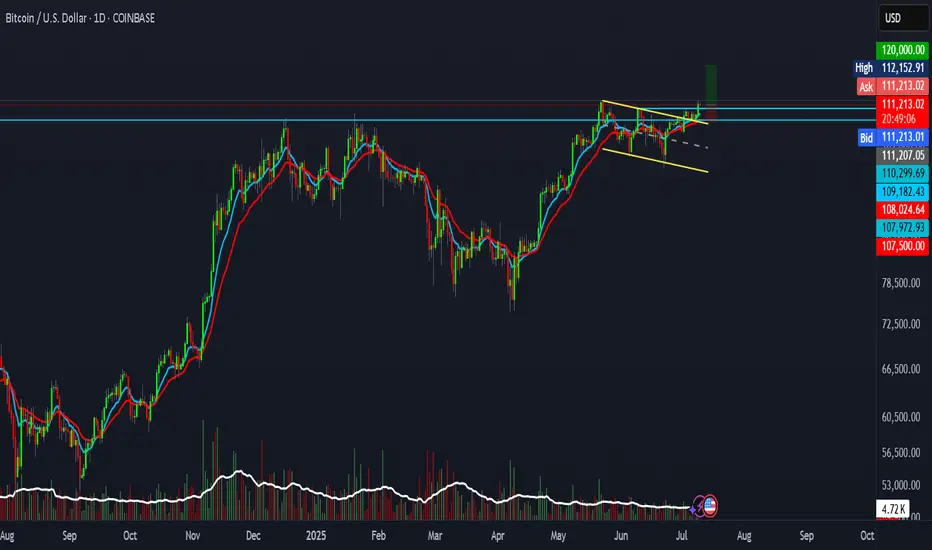
BTC setup with 2R R:R.BTC is showing signs of a real breakout.
This setup offers a 2:1 risk-reward ratio.
Entry: 111,207
Stop Loss: 107,500
Target: 120,000
Not financial advice.
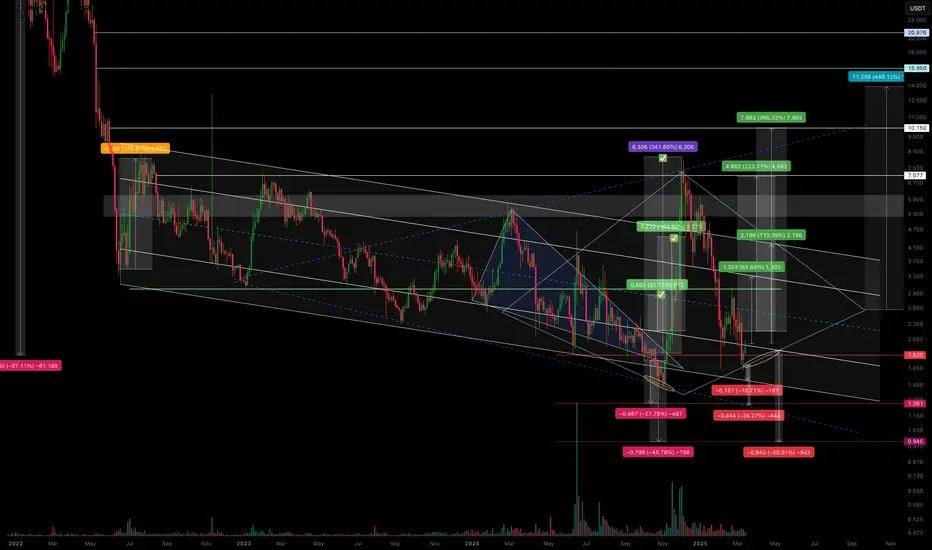
CVX/USDT – Is the scenario repeating? Continuing to work.The previous trading idea has played out with 3 out of 4 marked zones reached.
We saw a false breakout from the descending channel, followed by a pullback in line with the overall market—returning to the channel’s support zone.
I’ve noticed a potential formation of either a diamond pattern or an expanding triangle, but we’ll see how it plays out further.
Regarding declines and support zones:
-10.71% drop to the support of the descending channel.
-26.27% drop to the anticipated support of the expanding triangle.
-50% drop, likely as a squeeze under extremely negative news.
Regarding growth and resistance zones:
+65% rise to the resistance of the internal channel.
+110% rise to the resistance of the external channel (and if a diamond pattern forms, then its boundary).
+246% rise as a second attempt to break out of the descending channel.
+440% rise as a potential realization of diamond pattern pricing (if it forms).
All of this should be factored into your trading strategy, even the less likely scenarios.
I'll share the execution of the previous trading idea in my TG. I've also marked it on the chart.
Bitcoin to 128kThere is a strong support between 113k to 115k for Bitcoin, as you see that is the 61% of the Fibonacci, and it is just the start for the rally.

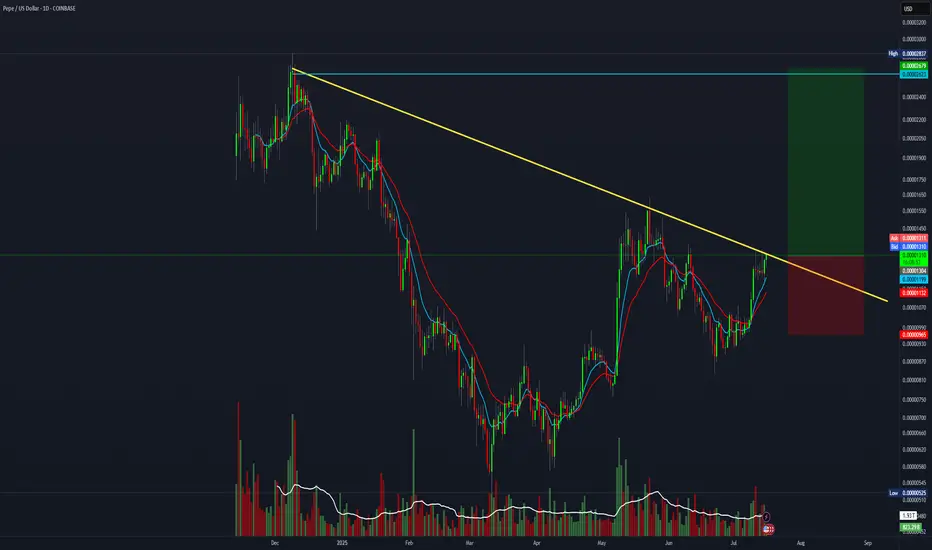
4:1 R:R trade setup for PEPEAre you a fan of memes? This trade setup offers a 4:1 R:R
Entry: 0.00001308
Stop Loss: 0.000009649
Target: 0.00002679
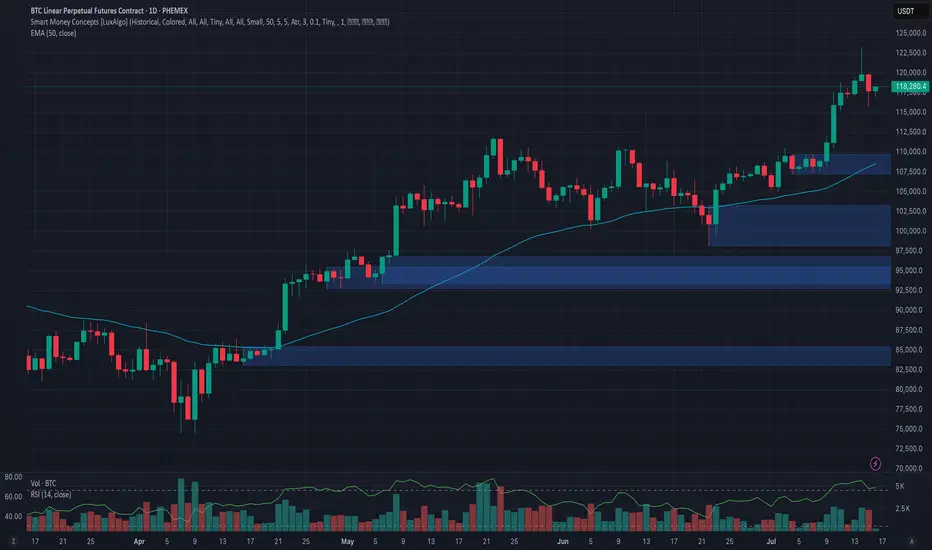
Phemex Analysis #97: What's Next for Bitcoin, After $123k?!Bitcoin ( PHEMEX:BTCUSDT.P ) recently made history by hitting an all-time high of $123,251 on July 14, 2025. However, enthusiasm was quickly tempered as BTC retraced by approximately 6%, dropping sharply to around $115,696 on July 15. Currently, the price has partially recovered and is trading at about $118,200.
With the market sentiment at a pivotal juncture following this volatile movement, traders and investors are carefully considering their next steps. Let's dive into several possible scenarios that might unfold in the coming days.
Possible Scenarios
1. Bullish Continuation (Breakout Above $123k)
If Bitcoin quickly regains bullish momentum, it may retest and surpass its recent high at $123,251. Breaking decisively above this resistance could trigger another strong rally, driven by renewed market optimism and potential institutional inflows.
Pro Tips:
Entry Strategy: Look to open or add to existing positions upon confirmation of a clear breakout above $123,251, especially if accompanied by high trading volume.
Profit Targets: Key resistance zones for profit-taking after a breakout include psychological levels at $128,000, and the significant milestone at $130,000.
Risk Management: Use protective stop-loss orders placed below the recent low around $115,000 to manage downside risks effectively.
2. Extended Consolidation (Range-Bound Scenario)
Bitcoin could enter a period of price consolidation, fluctuating between support at approximately $115,000 and resistance near $123,000. This scenario often occurs when the market awaits clearer directional cues.
Pro Tips:
Range Trading: Employ a grid-trading strategy, placing buy orders near support ($115,000–$116,000) and sell orders around resistance ($122,000–$123,000) to maximize profits from short-term volatility.
Monitoring Indicators: Keep an eye on declining trading volume, which often signals the potential for an upcoming breakout or breakdown.
3. Bearish Pullback (Correction Scenario)
Given the rapid recent surge to all-time highs, a deeper market correction remains possible. If BTC decisively breaks below support at $115,000 with strong selling pressure, further declines towards $107,218 or even $98,132 could ensue, especially if accompanied by negative broader market sentiment.
Pro Tips:
Short Opportunities: Experienced traders might explore short positions if BTC convincingly breaks below the $115,000 support level.
Accumulation Strategy: Long-term investors can strategically accumulate positions around significant lower support levels such as $107,218 and $98,132, provided price stabilization signals are evident.
Conclusion
Bitcoin is currently at a crucial technical and psychological level after hitting its latest all-time high. Traders should closely monitor the outlined scenarios—particularly watching key resistance at $123,251 and essential support at $115,000. By utilizing disciplined risk management, proactive profit-taking strategies, and careful market analysis, investors can effectively navigate BTC’s ongoing volatility and strategically position themselves for the next significant move.
🔥 Tips:
Armed Your Trading Arsenal with advanced tools like multiple watchlists, basket orders, and real-time strategy adjustments at Phemex. Our USDT-based scaled orders give you precise control over your risk, while iceberg orders provide stealthy execution.
Disclaimer: This is NOT financial or investment advice. Please conduct your own research (DYOR). Phemex is not responsible, directly or indirectly, for any damage or loss incurred or claimed to be caused by or in association with the use of or reliance on any content, goods, or services mentioned in this article.
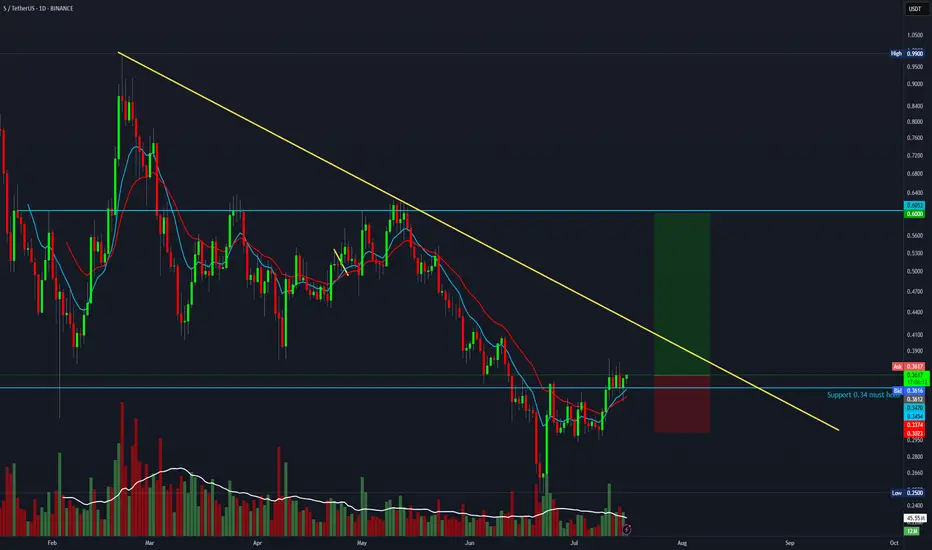
Trade setup with a 4:1 R:R for S (formerly FTM)BTC is likely about to continue its move toward 135K — if you're a bull, this is a solid setup with a 4:1 R:R.
Entry: 0.36
Stop Loss: 0.30
Target: 0.60
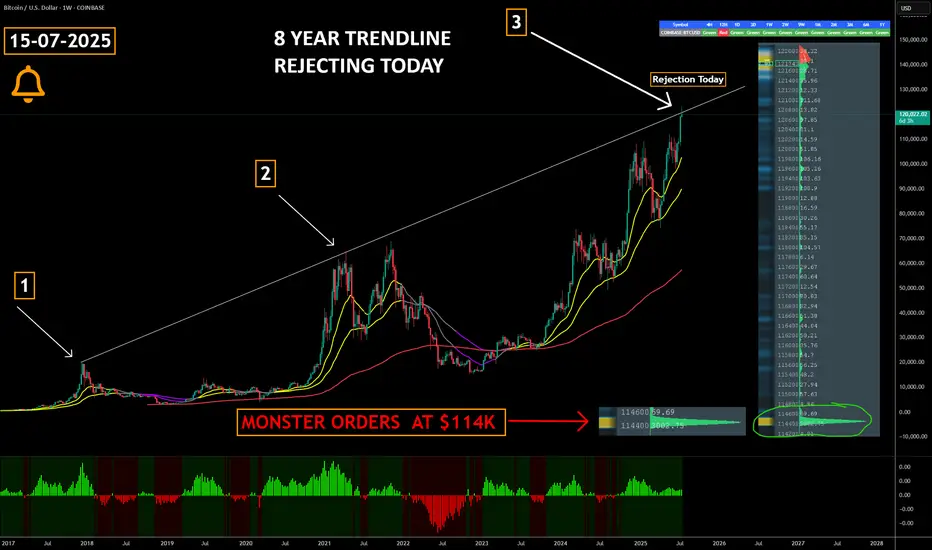
Did Bitcoin Just TOP OUT ??????
COINBASE:BTCUSD has just collided with an 8-year rising trendline that capped the market’s last two cyclical peaks—historically, this level has triggered multi-month corrections and Bear Markets.
Triple-test significance : a third touch of a long-term trendline ➜ heightened odds of a reaction; failure to break cleanly often confirms a major top.
Watch for confirmation signals —weekly bearish RSI divergence, waning volume, or rejection wicks can validate a reversal scenario.
Breakout = regime change : a decisive close and hold above the line flips it to support, opening the door to fresh price discovery and potential parabolic upside.
Large Orders at $114k create a visible demand wall in the order book, signalling that whales / institutions are ready to absorb a dip and accumulate at that level.
Risk-management alert : consider tightening stops, reducing leverage, or hedging until trendline fate is resolved.
The buy pressure has been relentless but this is always worth paying attention to
Marty Boots | 17-Year Trader — smash that , hit LIKE & SUBSCRIBE, and share your views in the comments below so we can make better trades & grow together!
BITCOIN Will it go lower?Bitcoin (BTCUSD) pulled back rather aggressively yesterday after marginally breaking above $123000 and making a new All Time High (ATH).
We've mentioned before the similarities of this Bullish Leg to the April - May structure and so far the current pull-back having already touched the 0.236 Fibonacci retracement level, resembles the late April pull-back.
However, besides the 0.236 Fib, that pull-back also hit its 4H MA50 and rebounded, so that's a condition that hasn't been fulfilled. If it does, we are potentially looking for a Low around the $115k mark. Notice also how both fractals are supported by a Higher Lows trend-line exactly on their respective 4H MA100 (green trend-line) levels.
If BTC continues to replicate this pattern, we expect to see $140000 (+43.05% from the bottom) by early August.
Will the Support levels hold and push it that high? Feel free to let us know in the comments section below!
-------------------------------------------------------------------------------
** Please LIKE 👍, FOLLOW ✅, SHARE 🙌 and COMMENT ✍ if you enjoy this idea! Also share your ideas and charts in the comments section below! This is best way to keep it relevant, support us, keep the content here free and allow the idea to reach as many people as possible. **
-------------------------------------------------------------------------------
💸💸💸💸💸💸
👇 👇 👇 👇 👇 👇

SANDBOX RALLY..Since 2021, SAND has been quiet but now holds strong support at $0.22. I believe a rally to $2.70 is likely in the coming months.
(ITS NOT A FINANCIAL ADVISE)

An 8.8:1 risk-to-reward trade setup for AVAX.A small pullback is likely at this point. This setup offers an 8.8:1 risk-to-reward ratio with a target of 50.
Entry at 20.8,
Stop loss at 17.50
Target at 50.

Sperax: Bullish pennant.Sperax is consolidating in a bullish pennant pattern after a strong recovery rally off the March lows. Price action has tightened between ascending support and descending resistance, forming a textbook continuation setup. Volume has decreased during this compression, which is often a precursor to explosive movement.
Fundamental Catalysts (Despite GENIUS Act Stalling):
Retail DeFi Narrative is Still Alive – While the GENIUS Act failed in the Senate, the momentum for regulatory clarity in the DeFi space continues. Future bills or executive actions could unlock capital flows to protocols like Sperax.
Deflationary Pressure —Over 13% of the total SPA supply has been burned, with more tokens locked and lost. The actual circulating supply is meaningfully lower than the total supply shown on aggregators.
SIP-70 has been passed , shifting SPA emissions from an automatic release model to a DAO-controlled emission schedule. This marks a significant milestone towards sustainable tokenomics and the preservation of long-term value.
Long-Term Accumulation – Wallet data and order books suggest that whales and long-term holders quietly accumulate during this sideways range.
Sperax remains a low-cap token with outsized potential in the next altseason if it secures even one meaningful partnership or fiat on-ramp.

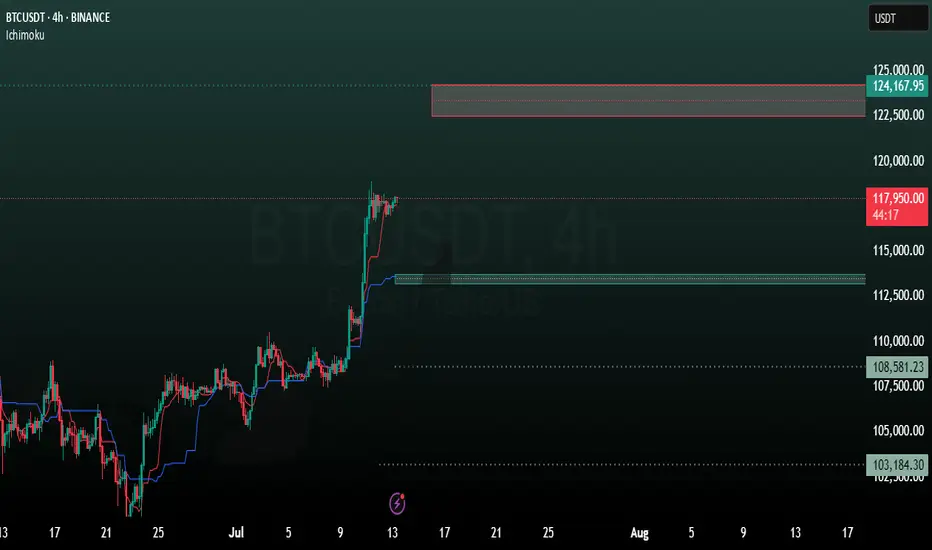
BTC 4H analysisBased on our previous analysis, BTC trend is still bullish. It reacts to our mentioned support level (98699) and moving to new resistance levels.
ICHIMOKU shows these levels as resistance:
122500
124000
137000
And these as support:
113788
113181
108581
"Ethereum Is The New Bitcoin" - Tom Lee ETH / Stablecoins Are the ChatGPT of Crypto
Stablecoins are exploding in adoption — just like ChatGPT took over AI and Ethereum is the engine driving that revolution. In this post, we break down 10 reasons why Tom Lee is extremely bullish on Ethereum and why it could be the single most important digital asset in the future of finance . If you're sleeping on ETH, this might be your wake-up call.
Top 10 Bullish Points from Tom Lee on Ethereum:
• Ethereum is the backbone of stablecoins , which Tom Lee compares to the “ChatGPT of crypto” due to their viral adoption and massive utility.
• Over 51% of all stablecoins operate on Ethereum , contributing to around 30% of the network’s total fees.
• Ethereum network fees could 10x as stablecoin usage grows from $250 billion to $2 trillion.
• Ethereum is positioned to lead the tokenization of real-world assets , including stocks and real estate.
• ETH could reach $10,000 if asset tokenization becomes a mainstream financial practice.
• Ethereum has a regulatory edge in the U.S. , making it the preferred platform for compliant financial innovation.
• A $250 million ETH treasury strategy is underway , aiming to use Ethereum as a long-term reserve asset.
• Institutions will buy and stake ETH to secure stablecoin networks, making ETH the “next Bitcoin.”
• Ethereum dominates the crypto ecosystem , with nearly 60% of activity including DeFi, NFTs, and dApps built on its chain.
• HODL ETH for long-term growth , as its utility, demand, and institutional support continue to rise.
Conclusion:
Ethereum isn’t just a Layer 1 blockchain — it’s becoming the core financial infrastructure for the digital age . As stablecoins expand and institutions enter, ETH could be the most asymmetric opportunity in crypto right now.
📢 Drop a like, leave your thoughts in the comments, and don’t forget to follow for more powerful macro + crypto insights. 👍👍

Bitcoin Fractal, increase to $116k Hi Everyone☕👋
BINANCE:BTCUSDT
Been such a long time since I posted. Today I'm looking at BTCUSDT, and I'm looking at the previous all time high cycle and what we were seeing (the pattern aka fractal).
Here's why we're likely going a little higher.
First correction of -32%
Followed by first peak, ATH
Correction, then the second peak and the REAL ath. Which is where we likely are:
Interesting to note that the previous time, the second ath was NOT THAT MUCH HIGHER. This should be considered to manage expectations in terms of how high we can go. Anything above +6% is a bonus.

BITCOIN High after High going for the Cycle Top!Bitcoin (BTCUSD) made a new All Time High (ATH) today, just north of $123000 and shows absolutely no signs of stopping there!
The brilliantly structured 2.5-year Channel Up (blue) that has been dominating the entirety of the current Bull Cycle since the November 2022 market bottom, has been on its latest Bullish Leg since the April 07 2025 rebound on the 1W MA50 (blue trend-line).
The 1W MA50 has been the Cycle's natural Support level since the March 13 2023 bullish break-out, never broken after, just like it has been for the 2019 - 2021 Bull Cycle (excluding of course the Black Swan event of the March 2020 COVID crash).
In fact the similarities of the whole 2022 - 2025 Cycle are strong with the 2018 - 2021 Cycle. Similar Bear Cycles of -80% on average, followed by strong Lower Highs break-outs and subsequent consolidations within the 0.786 - 0.618 Fibonacci range, takes us to today with the April 2025 1W MA50 bounce resembling the July 2021 one.
Eventually, that Bullish Leg led to the Cycle's Top a little above the 1.618 Fibonacci extension. The market seems to be only one step away of completing that past pattern and if it does, BTC may hit $170000 before the Cycle peaks.
Do you think that is a likely scenario after today's new fresh ATH? Feel free to let us know in the comments section below!
-------------------------------------------------------------------------------
** Please LIKE 👍, FOLLOW ✅, SHARE 🙌 and COMMENT ✍ if you enjoy this idea! Also share your ideas and charts in the comments section below! This is best way to keep it relevant, support us, keep the content here free and allow the idea to reach as many people as possible. **
-------------------------------------------------------------------------------
💸💸💸💸💸💸
👇 👇 👇 👇 👇 👇
