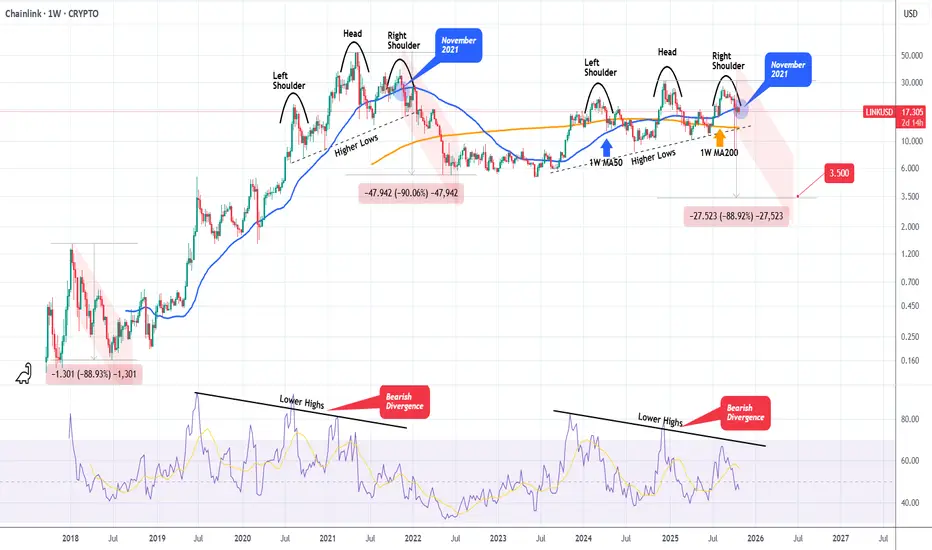
LINKUSD Massive Head and Shoulders starting the new Bear Cycle. Chainlink (LINKUSD) has been steadily rising within a Channel Up during this Bull Cycle but on the recent August 18 2025 High, it failed to make a Higher High and got rejected instead.
The Channel Up seems to have transitioned into a Head and Shoulders (H&S) pattern, while the 1W RSI has been on a Bearish Divergence (Lower Highs trend-line against the price's Higher Highs).
We saw a similar H&S forming at the end of the previous Bull Cycle (2021), which essentially paved the way to the 2022 Bear Cycle. Symmetrically it appears to also work quite well as right now we are on a similar spot (1W MA50, blue trend-line) as November 2021.
The two Bear Cycles of LINK declined by -88.90% and -90.00% respectively. As a result, if history repeats, we are looking at a potential bottom at at least $3.500 (-88.90%).
Do you think that's a realistic expectation?
-------------------------------------------------------------------------------
** Please LIKE 👍, FOLLOW ✅, SHARE 🙌 and COMMENT ✍ if you enjoy this idea! Also share your ideas and charts in the comments section below! This is best way to keep it relevant, support us, keep the content here free and allow the idea to reach as many people as possible. **
-------------------------------------------------------------------------------
💸💸💸💸💸💸
👇 👇 👇 👇 👇 👇
Cryptocurrency
USDCAD possible fall!USDCAD could be falling today getting into NY session. Waiting for confirmation aa it has been struggling passing the zone it is at.

BITCOIN RALLY STARTEDI believe now after bitcoin re-tested the trendline which is a great support, the rally for November & December is on the way

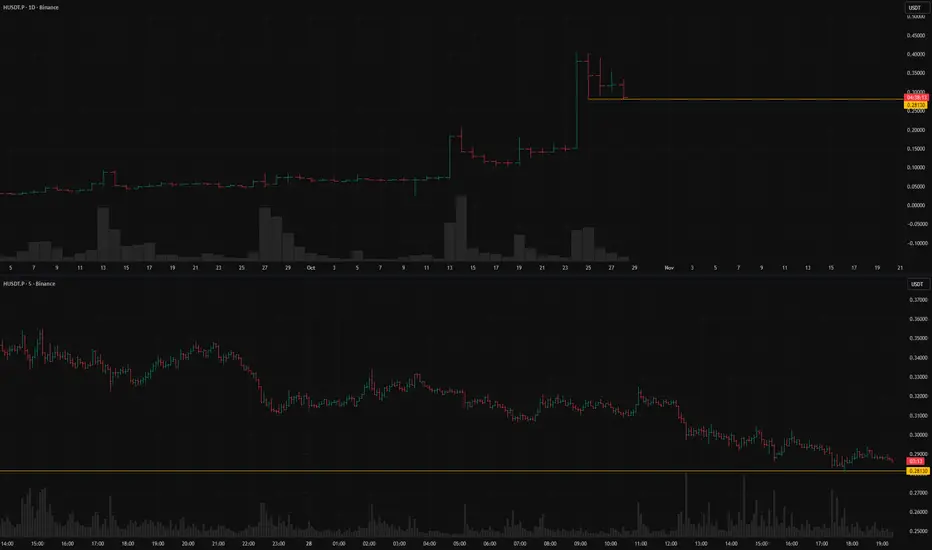
HUSDT.P: short setup from daily support at 0.28130BINANCE:HUSDT.P confirmed the level today with a precise touch. What stands out is the lack of a corrective move after confirming the level formed three days ago — the price has effectively “stuck” to the level, forming a pre-breakout base. This kind of behavior often indicates potential readiness for a breakout.
Key factors for this scenario:
Price void / low liquidity zone beyond level
Volatility contraction on approach
Immediate retest
No reaction after a false break
Was this analysis helpful? Leave your thoughts in the comments and follow to see more.
Bitcoin - Liquidity grab signals further downside!Bitcoin (BTC) is currently in a crucial phase within a broader consolidation structure. After a strong upward move, the price has encountered significant resistance and is showing signs of weakening buying pressure. On the daily chart, it is clear that the price has re-entered the triangle structure after a brief breakout above resistance.
Liquidity Grab
Around $116,000, a clear liquidity sweep can be observed. Above this level, many stop orders and short-position liquidity were clustered. After this liquidity was taken, the price reversed sharply downward — indicating that large market players likely used this move to take profits or open short positions.
Fake-Out from the Triangle Pattern
The breakout above the triangle structure turned out to be a fake-out. Instead of holding above the trendline for confirmation, the price quickly fell back within the formation. This indicates buyer weakness and strengthens the bearish scenario. A fake-out above a consolidation pattern often leads to a move in the opposite direction — toward the lower boundary of the structure.
Daily FVG
The current candle is positioned within an important daily Fair Value Gap (FVG). If the daily close remains as it is, this bullish FVG will convert into a bearish FVG, meaning the area will now act as resistance. This suggests that bears are taking control and further downward price action is likely.
Target
After an upward fake-out that collects liquidity, price often moves to the opposite side of the pattern. In this case, that would be the lower side of the triangle. A drop toward $103,000–$104,000 is therefore the most likely scenario. This zone aligns with previous structural support and can serve as a logical target area.
Conclusion
Bitcoin is showing clear signs of exhaustion near the top of the range. The liquidity grab and fake-out from the triangle reinforce the bearish outlook. With the daily FVG flipping bearish and bullish momentum fading, a move down toward the $103,000–$104,000 zone appears to be the most probable next step — unless BTC unexpectedly manages to close above the FVG.
-------------------------
Thanks for your support. If you enjoyed this analysis, make sure to follow me so you don't miss the next one. And if you found it helpful, feel free to drop a like 👍 and leave a comment 💬, I’d love to hear your thoughts!

BITCOIN Has this huge Bearish Divergence started the Bear Cycle?Bitcoin (BTCUSD) continues to be under heavy pressure in the past 4 weeks since the October 06 All Time High (ATH) and finds itself battling to hold the 1W MA50 (blue trend-line) as Support. That trend-line has been basically the Support of this Bull Cycle since March 2023, and acted as the most optimal long-term buy level.
** Has the Bull Cycle ended? **
However this Bull Cycle may have very well come to an end already as the 1W RSI has been long exhibiting the same kind of bearish pattern (Lower Highs trend-line), while also having completed the 4-year Cycle, that all previous Bull Cycles formed on their respective tops. This is a huge Bearish Divergence formation as it goes against the price's Higher Highs, indicating trend exhaustion.
As you can see that 1 RSI Lower Highs trend-line formed the November 2021, December 2017 and December 2013 Cycle Tops. Even worse, the current Lower Highs trend-line has been going on since the March 11 2024 High. If BTC closes a 1W candle below its 1W MA50, it has greater probabilities to confirm the start of the new Bear Cycle as all previous ones did on such break-out.
** If yes, how much can it drop? **
Now, it might not be too relevant at this time yet, but as far as how low the Bear Cycle can go to before it bottoms, there are three potential levels of interest where long-term investors can Dollar Cost Average (DCA).
The January 2015 Bear Cycle bottom was formed on the 1W MA200 (orange trend-line). Then the December 2018 Bear Cycle bottom was formed on the 1W MA200 and the 0.382 Fibonacci retracement level from the previous bottom. The last Bear Cycle has its bottom below the 1W MA200 and on the next Fib in line, the 0.5 level. The decline on each Bear Cycle that followed decelerated and was less than the previous (-86.70% to -84.19% to -77.22%).
If the new Bear Cycle has already started then the first level for a potential bottom is again the 0.382 Fib around $58000 where contact may potentially be made with the 1W MA200 as well. If it follows the previous Bear Cycle and bottoms on the 0.5 Fib, it will also be below the 1W MA200 around $45000. If on the other hand it goes a Fib level further, as the last two Cycles did, we are looking at the 0.618 Fib as a potential strong bottom candidate around $35000. That will also be a -70.76% decline from the Top, which will be -7% less than the previous Bear Cycle, which is also the difference that the 2022 Bear Cycle had from the 2018 one.
So what do you think? Has the Bull Cycle ended already and if yes, how low can the new Bear Cycle go? Feel free to let us know in the comments section below!
-------------------------------------------------------------------------------
** Please LIKE 👍, FOLLOW ✅, SHARE 🙌 and COMMENT ✍ if you enjoy this idea! Also share your ideas and charts in the comments section below! This is best way to keep it relevant, support us, keep the content here free and allow the idea to reach as many people as possible. **
-------------------------------------------------------------------------------
💸💸💸💸💸💸
👇 👇 👇 👇 👇 👇

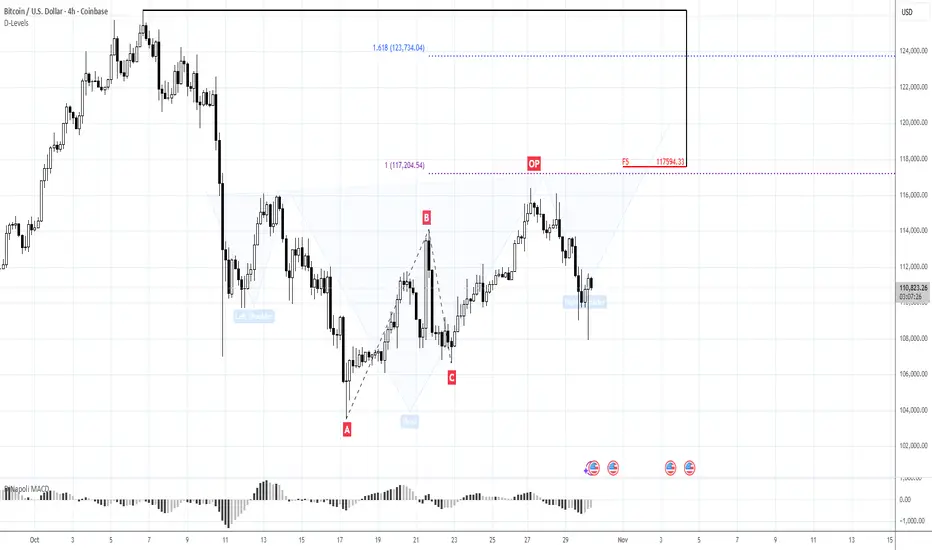
BTC HAS TO START UPSIDE ACTION ... OR IT DOESN'T START IT AT ALLMorning folks,
So, we've got a H&S that we suggested. Great. Besides, price is already at the right arm's bottom - its time to make a decision, whether you're in or not. Also we could use this small 30-min H&S to minimize the risk.
The logic is simple. Upside action has to start right from here, or it will not happen at all and BTC will fall back to 100K lows.
BTC/USDT | BTC Update – Testing the $112K Barrier!By analyzing the #Bitcoin chart on the 12-hour timeframe, we can see that after finding strong support near $103,500 , BTC has continued its recovery and recently reached $111,700 . The key question now is whether the price can break decisively above the $112K resistance zone.
The $103K–$105K range still acts as a major demand area , while the $109K–$112K zone remains short-term resistance . A confirmed breakout above $112K could open the door toward $113,800, $116,000, and $119,600 , while rejection from this zone might trigger another pullback before continuation.
Overall, the structure remains neutral-to-bullish , and volatility is still high — you guys should stay alert for a confirmed breakout before the next big move develops.
Please support me with your likes and comments to motivate me to share more analysis with you and share your opinion about the possible trend of this chart with me !
Best Regards , Arman Shaban

BTC Still in Breakdown ZoneBTC Still in Breakdown Zone ⚠️
Bitcoin remains inside the breakdown structure, consolidating under pressure after failing to reclaim the upper range near $116K.
The current setup continues to show bearish volume behavior, suggesting that the market is still in a controlled downtrend phase.
📉 Current outlook:
Breakdown zone spans $116K – $110K.
Price continues to trade mid-range around $113K, with limited bullish momentum.
The breakdown volume indicates ongoing distribution — sellers remain active.
📊 Observation:
BTC is holding slightly above $112.5K, but without strong buying confirmation.
If this consolidation breaks lower, the next liquidity target sits around $110K, marking the bottom of the breakdown zone.
💬 Summary:
BTC is still in the breakdown phase, with selling pressure dominating short-term structure.
Until price reclaims $116K with volume, risk remains tilted toward the $110K region.

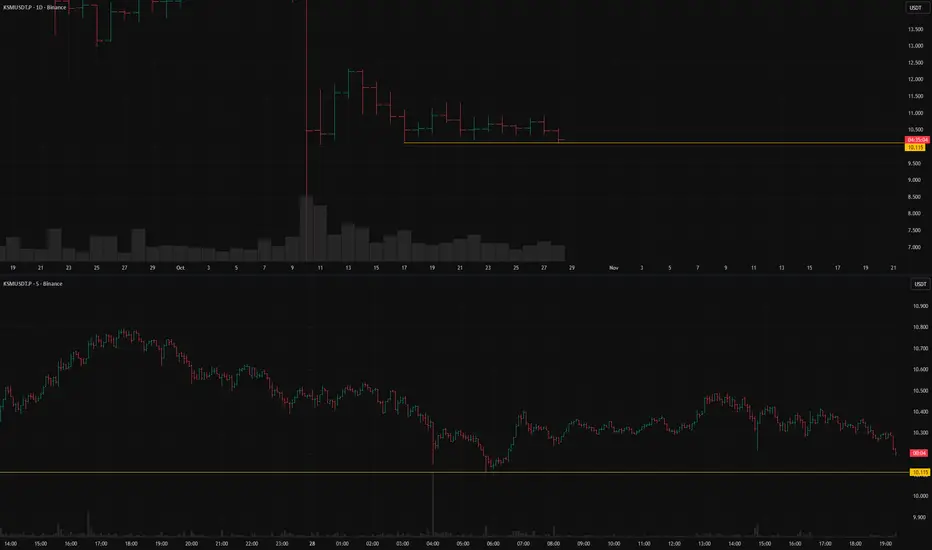
KSMUSDT.P: short setup from daily support at 10.115BINANCE:KSMUSDT.P remains in consolidation, clearly confirming the level — no false breakouts or sweeps, just consistent touches and short pullbacks. The asset has held this structure for nearly two weeks and will eventually break out. In my view, the likely scenario is a short below 10.115.
Today, the asset has already tested the level once and is gradually approaching it again. Maintaining low volatility during this approach will be important.
Key factors for this scenario:
Global & local trend alignment
Volatility contraction on approach
Prolonged consolidation
Was this analysis helpful? Leave your thoughts in the comments and follow to see more.
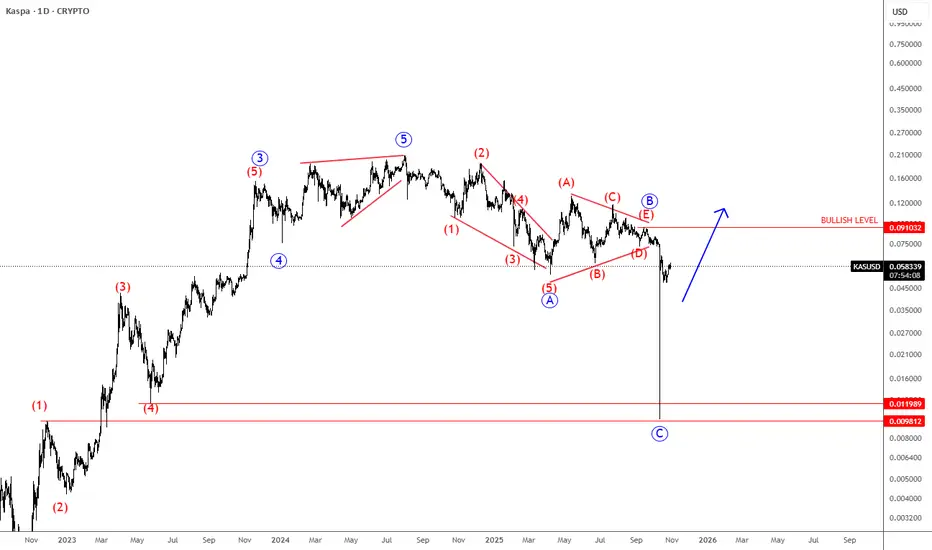
Kaspa Completes A Correction After A Huge SpikeKaspa Completes A Correction After A Huge Spike that can be supportive, as we see a corrective structure within the uptrend by Elliott wave theory.
Kaspa is a proof-of-work (PoW) cryptocurrency that uses the novel GHOSTDAG protocol (a block-DAG consensus rather than a single linear chain) to allow many blocks to be produced more rapidly and co-exist. It was launched without an ICO / pre-mine (fair launch) and positions itself as more scalable than many PoW chains. Because of this, it has attracted interest as a “next-gen PoW” or “fast chain” alternative.
Kaspa’s sell-off appears of a combination of leveraged long liquidations intensifying a move down, weak macro/altcoin sentiment and structural risks (adoption/supply concentration). Despite a massive price drop, sparking fear and pessimism across the market, such deep pullbacks often create opportunity rather than signal failure. Despite the volatility, Kaspa’s fundamentals remain solid. Its innovative GHOSTDAG technology, fair launch, and strong network activity continue to set it apart. When fear dominates and sentiment turns overly negative, it can actually be a supportive setup for long-term investors looking to accumulate quality projects at discounted levels.
From Elliott wave perspective, KASUSD(Kaspa) spiked down out of a wave B triangle pattern into wave C, so it’s a higher degree ABC correction. It still looks promising for the future, and we may still see some rally in the current bullish cycle. Bullish confirmation is above 0.091 area.
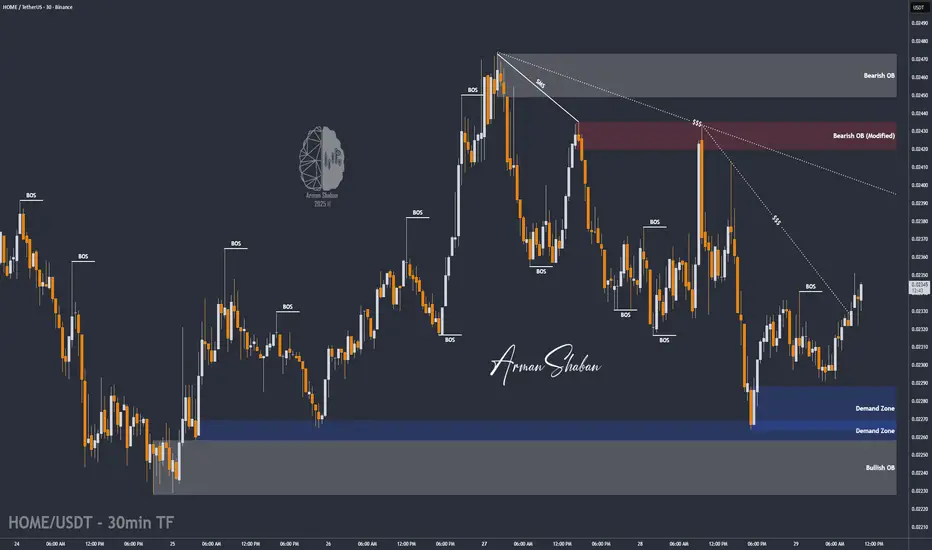
HOME/USDT | $HOME Ready to Pump – Watch $0.0232 Breakout!By analyzing the BME:HOME chart on the 30-minute timeframe, we can see that after a correction down to $0.02265, the price found strong buying interest and is now trading around $0.02338.
If the price manages to hold above $0.02320, we can expect a strong bullish move from this token.
The key demand zone lies between $0.02265–$0.02288, and the next targets for this potential rally are $0.02350, $0.02375, $0.02410, $0.02435, and $0.02450.
Please support me with your likes and comments to motivate me to share more analysis with you and share your opinion about the possible trend of this chart with me !
Best Regards , Arman Shaban
CARDANO Last chance to keep the Bull Cycle running.Cardano (ADAUSD) has been trading within a Channel Up every since its December 26 2022 Bear Cycle bottom. That was also the time the 1W RSI has been at its lowest (hitting 30.00). The most recent bullish signal has been the 1W Golden Cross, its first ever.
Following this however, the price failed to break above the Lower Highs trend-line of the pattern's previous Higher High and got rejected back to its bottom (Higher Lows trend-line), which momentarily got broken on the October 10 flash crash. Still, the market instantly recovered and more importantly the 1W RSI found Support on its own 3-year Higher Lows Zone, which has been the most effective buy entry of the Bull Cycle.
As long as the price stays inside the Channel Up, the Bull Cycle remains alive. The confirmation of further upside, thus a new Bullish Leg, only comes technically if the price breaks above the Lower Highs trend-line again. If it does, we expect a Higher High on the 1.382 Fibonacci extension (every Higher High seems to decline, 1.786 to 1.5 Fib) at $1.900. A 1W candle closing below its 1W MA200 (orange trend-line), most likely confirms the new Bear Cycle.
-------------------------------------------------------------------------------
** Please LIKE 👍, FOLLOW ✅, SHARE 🙌 and COMMENT ✍ if you enjoy this idea! Also share your ideas and charts in the comments section below! This is best way to keep it relevant, support us, keep the content here free and allow the idea to reach as many people as possible. **
-------------------------------------------------------------------------------
💸💸💸💸💸💸
👇 👇 👇 👇 👇 👇

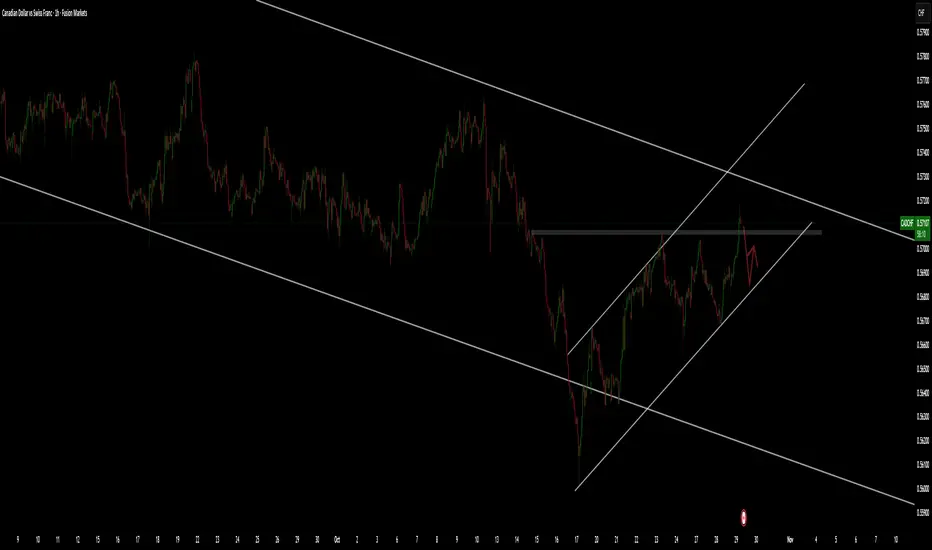
CADCHF pullback.CADCHF has been moving nicely within the channel. But overall it is in the DownTrend and now going for a pull back. If breaks the small channel a possible fall.
GBPCHF climbing back UP!GBPCHF is regaining strength in the London session. Waiting for it to reach RESISTANCE zone and see if it will BreakOut and conquer.


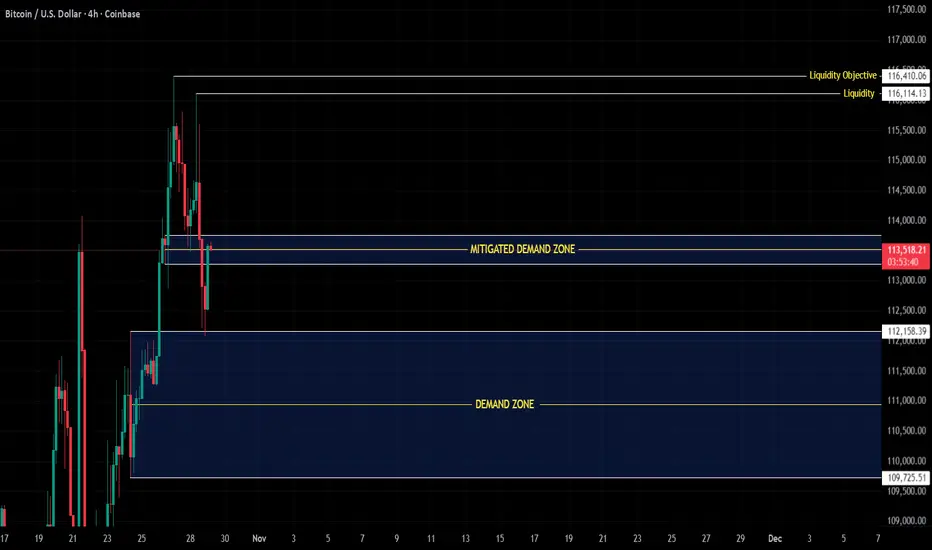
4H Structure Update-Demand Mitigated ,Next Liquidity in Sight
COINBASE:BTCUSD CRYPTO:BTCUSD BINANCE:BTCUSD KRAKEN:BTCUSD
$BTC/Price has reacted strongly from the deeper demand zone (112.15K – 109.70K), showing a clean bullish CHOCH followed by a confirmed BOS on the lower timeframes — signaling early structural alignment for potential continuation.
This reaction confirms mitigation, not reversal, as long as 109.70K remains protected.
Momentum and structure across micro and mid timeframes have now turned bullish, indicating renewed intent from buyers.
The next liquidity objective sits between 116.11K – 116.41K, where previous imbalance and resting liquidity align.
That zone also holds reversal potential, as price may face reaction or redistribution once it reaches those highs.
For now, this remains a healthy corrective phase within the bullish macro structure —
a controlled absorption and expansion sequence in play.
Structure first. Liquidity second.
Confirmation always. 💎
ATCryptoScan: BTCUSD Waiting to spring into 2026 TOPSo, from previous posts... outcome comments in white. Self-explanatory, close enough, good enough.
Importantly, going forward...
1. wide range moves expected
2. 100K bounce in December, rally to Top
3. Top likely 160K in early Feb 2026
Technically, MACD is losing steam, but it price can be pumped. Weekly candlesticks have a bit of a bullish harami, so look out until Monday for a strong bounce to end the week bullish. Else, pushing down to 100K to make a sandwich stack candlestick.
Heads up yeah?
Short sharp and sweet...

Can LITECOIN copy ZEC's enormous rally?Zcash (ZECUSD) marginally broke its May 10 2021 Cycle Top (orange trend-line) this week, rising by more than +800% in just 2 months.
Throughout its trading history, it has been tightly correlated with Litecoin (LTCUSD). It's not uncommon to see ZEC lead the way and then LTC (purple) follow. As this chart shows, whenever the two diverged, the one always caught up with the other and converged again.
Does this mean that LTC will eventually catch up to this enormous rally? If it does indeed, the Top of the previous Cycle that it 'has to' fill is at $415.
-------------------------------------------------------------------------------
** Please LIKE 👍, FOLLOW ✅, SHARE 🙌 and COMMENT ✍ if you enjoy this idea! Also share your ideas and charts in the comments section below! This is best way to keep it relevant, support us, keep the content here free and allow the idea to reach as many people as possible. **
-------------------------------------------------------------------------------
💸💸💸💸💸💸
👇 👇 👇 👇 👇 👇

Bitcoin lost its low time frame — red day pressure aheadBitcoin has lost the low time frame structure around the $114.6K – $114.8K zone, signaling a possible shift in short-term momentum.
The break below this area indicates weakness, and BTC is now testing the mid-range levels while showing signs of slowing volume.
📉 Short-term view:
Momentum has turned bearish after rejection from $115.8K.
Next support zone sits around $108K – $109K, where buyers may try to step in.
If this level fails to hold, BTC could revisit $103K support — the key demand area from the previous range.
📊 Technical observation:
BTC’s structure shows a completed short-term top followed by a lower high formation.
This setup often confirms a local downtrend and can lead to several red candles before a new base forms.
💬 Summary:
Bitcoin lost its low time frame momentum, and we could be entering a red session.
We’ll monitor how price reacts near the $108K support zone to evaluate if buyers can regain control or if a deeper correction begins.
We follow the data, at this moment the marketview seems to be red, we will follow if this continues in the coming hours.

DIA enters breakdown trendDIA has officially entered a breakdown phase after losing its key short-term structure and falling back into the breakdown volume zone.
The sharp rejection from the $0.86 level triggered heavy selling pressure, confirming a shift in short-term trend momentum.
📉 Current outlook:
Price is now consolidating between $0.60 – $0.38 within the breakdown range.
Volume is elevated, suggesting distribution rather than accumulation.
Unless DIA reclaims $0.65+, the trend remains bearish.
📊 Observation:
This move resembles a post-hype correction where early buyers exit and liquidity thins out.
The next key level to monitor for reaction sits near $0.38 support — a potential short-term base if selling slows down.
💬 Summary:
DIA is currently trading in a breakdown trend, with risk leaning to the downside until structure rebuilds above $0.65.


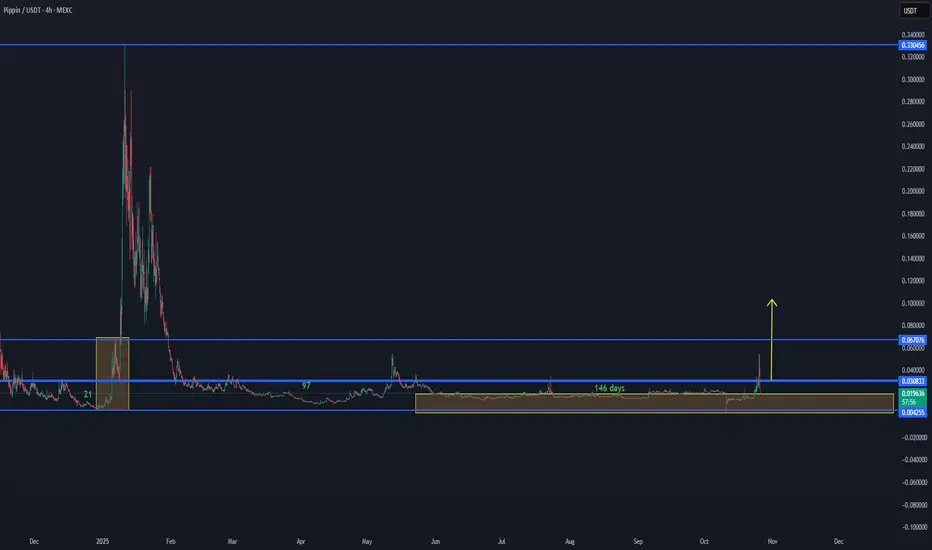
PIPPIN:USDT Market Outlook – Volume Range Formation💠 PIPPIN:USDT Market Outlook – Volume Range Formation
PIPPIN:USDT is showing early signs of new volume activation after an extended 146-day accumulation period within the lower range between 0.0042 – 0.0308 USDT.
This current setup indicates a potential volume range development, similar to the previous expansion phase observed earlier in the chart.
If momentum continues to build and volume sustains, the next major resistance zone sits around 0.067 USDT, followed by a broader target area toward 0.33 USDT on higher timeframes.
At this stage, stability above 0.018–0.020 USDT would confirm the base structure and strengthen the bullish outlook.
📊 Summary:
Range support: 0.0042 – 0.018 USDT
Key activation zone: 0.018–0.030 USDT
Target zones: 0.067 → 0.33 USDT
Structure: Accumulation → Early volume build-up
🔎 Focus: Watching for continuation of volume inflow and break above 0.0308 USDT to confirm next phase expansion.