We got the first profit! Next is 10k. Who's with me? ^_^
We got our perfect entry and reached our TP. Now that big institutions and whales are showing interest in BINANCE:ETHUSDT reaching 10k is more likely once the captial starts moving to ETH.
I too, with the experts have a similar view on ETH's future performance!
Not gonna list out things y'all already know. Feel free to drop your idea even if contradicting.
Good luck!
#BTC #ETH #bullrun #technicalanalysis #crypto #fundamentalanalysis #priceaction
Cryptocurrency
Bitcoin Forecast: Sept 2025 | Bulls in Control?🔮 Bitcoin (BTCUSD) Technical Analysis & Trading Strategy
Date: September 6, 2025 | Closing Price: $110,656.71
🎯 Executive Summary & Market Outlook
Bitcoin is showcasing formidable strength, closing above the critical $110k psychological level. Our multi-indicator analysis suggests a bullish bias 🟢 with eyes on new all-time highs. However, the rally is maturing, and traders must be vigilant for potential volatility or a bear trap formation. This report outlines precise intraday and swing trading strategies for the week ahead.
📊 Comprehensive Technical Breakdown
1. Chart Pattern & Theory Synthesis:
Elliott Wave Theory: Price action suggests we are likely in a powerful Wave 3 of a larger impulsive bull cycle. The next minor pullback (Wave 4) should be bought into, targeting a final Wave 5 push higher.
Wyckoff Theory: Analysis points to a potential Sign of Strength (SOS) following a prolonged reaccumulation phase. A successful back-test of the breakout level ($105k - $107k) would confirm continued upward movement.
Gann Analysis: Using the Square of 9, key resistance levels are identified at $112,500 and $115,200. Gann angles from the last major low provide dynamic support; a break below could signal a deeper retracement.
Other Patterns: No classic Head & Shoulders top is present. The trend is characterized by bull flags and ascending triangles, indicating consolidation before continuation.
2. Key Indicators & Momentum:
RSI (14-period): On the daily chart, RSI is in the 60-70 range, indicating strong bullish momentum without being severely overbought. There is room for further upside before a correction becomes likely.
Bollinger Bands (BB): Price is riding the upper band, a sign of a strong trend. A move back inside the bands would signal a cooling of momentum, not necessarily a reversal.
Moving Averages: The order is perfectly bullish: Price > EMA(21) > EMA(50) > SMA(200). This "stacking" is a classic sign of a strong uptrend. Any pullback towards the EMA(21) (~$108k) would be a key intraday support.
Volume & VWAP: Anchored VWAP from the last significant low shows price trading well above it, confirming the Strong Bullish Trend ✅. Volume has been supportive on up-moves.
⚔️ Trading Strategy: Intraday (5M - 4H Charts)
Bias: cautiously bullish
Long Entries (3:1 R:R Minimum):
On a pullback to support (e.g., $109,200, $108,500, or the 21-EMA) with bullish reversal candlesticks (hammer, bullish engulfing) and increasing volume.
A breakout above the Asian session high with volume confirmation.
Short Entries (Counter-Trend, Higher Risk):
Only at clear resistance levels ($111,500, $112,500) with bearish rejection candles (shooting star, doji) and divergences on the RSI.
Stop-Loss: Tight stops, just below the recent swing low or key support level.
Take-Profit: Scale out at previous resistance levels turned support.
📈 Trading Strategy: Swing (4H - Daily Charts)
Bias: Bullish
Strategy: "Buy the Dip". Look for opportunities on any pullback into the key support zone of $105,000 - $107,000. This zone represents the previous resistance and the 50-EMA.
Invalidation: A daily close below $102,000 would invalidate the immediate bullish swing outlook and suggest a deeper correction to the $95k - $98k area.
Profit Targets:
Target 1: $115,000
Target 2: $118,000
Target 3: $125,000 (Extension)
⚠️ Risk Management & Trap Warning
Bull Trap 🚨🐂: A false breakout above $112k followed by a swift rejection and close back below $110k could lure in late buyers before a sharp drop. Confirmation: Low volume on the breakout.
Bear Trap 🚨🐻: A sharp, volatile wick down to $105k-$107k that is quickly bought up, trapping aggressive short sellers. Confirmation: A long-legged doji or hammer candle on high volume.
Always use stop-loss orders. Position size appropriately. The key is to protect capital.
💡 Conclusion
BTCUSD is in a confirmed uptrend. The path of least resistance is higher, favoring both long intraday positions and swing longs on dips. Traders should be agile, respect key support levels, and watch for trap formations at new highs. The integration of Gann targets, Elliott Wave structure, and Wyckoff phases provides a high-probability roadmap for the week ahead.
✅ Happy Trading! ✅
For individuals seeking to enhance their trading abilities based on the analyses provided, I recommend exploring the mentoring program offered by Shunya Trade. (Website: shunya dot trade)
I would appreciate your feedback on this analysis, as it will serve as a valuable resource for future endeavors.
Sincerely,
Shunya.Trade
Website: shunya dot trade
⚠️Disclaimer: This post is intended solely for educational purposes and does not constitute investment advice, financial advice, or trading recommendations. The views expressed herein are derived from technical analysis and are shared for informational purposes only. The stock market inherently carries risks, including the potential for capital loss. Therefore, readers are strongly advised to exercise prudent judgment before making any investment decisions. We assume no liability for any actions taken based on this content. For personalized guidance, it is recommended to consult a certified financial advisor.

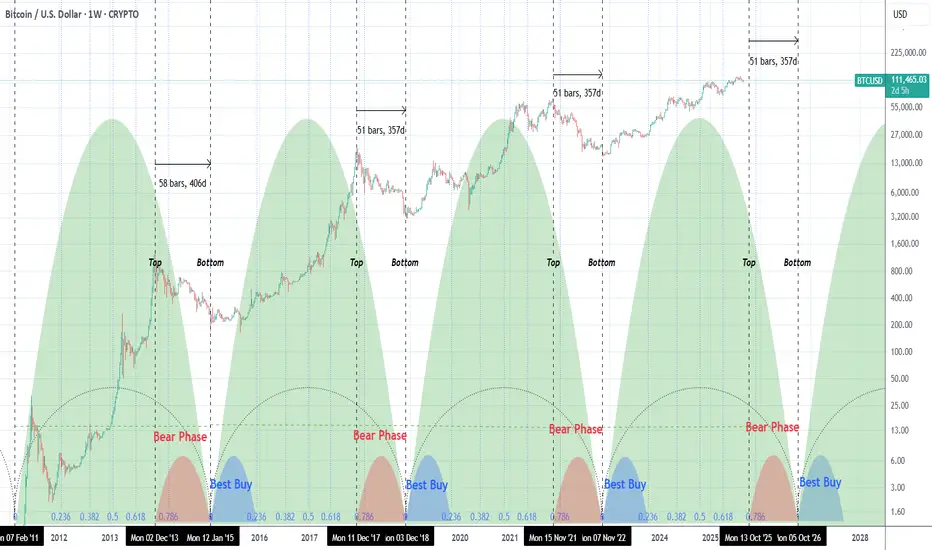
BITCOIN Is the end of the Bull Cycle approaching?Bitcoin (BTCUSD) may be approaching the end of its current Bull Cycle and a few weeks ago we have issued a first reminder of the dynamics of this Cycle in relation to all previous. The historic symmetry is high and this time we've presented it using the Time Cycles and Time Fibonacci levels.
As mentioned on previous studies, measuring the Super Cycle from bottom-to-bottom, the Top tends to be formed around the 0.786 Time Fib. Naturally the distance from the 0.786 Fib and 1.0 is the Bear Phase (red). What follows next is the Bear Buy (blue) of the Bull Phase from Fib 0.0 to Fib 0.236.
What concerns us most at this stage is the fact that 0.786 Time Fib is on the week starting December 01 2025. To make things more alarming, if the next Bear Phase follows the last two that measured 51 days from Top-to-Bottom, since the Super Cycle ends on October 05 2026, the next potential Top of this Cycle could be on the week starting October 13 2025!
Certainly food for thought, surely the current Cycle got derailed/ delayed a few months by Trump's tarrifs but above all this serves as a reminder that booking profits in trading is key. And especially since very few actually manage to do so on Tops.
So are you booking profits for this Cycle or not yet? Feel free to let us know in the comments section below!
-------------------------------------------------------------------------------
** Please LIKE 👍, FOLLOW ✅, SHARE 🙌 and COMMENT ✍ if you enjoy this idea! Also share your ideas and charts in the comments section below! This is best way to keep it relevant, support us, keep the content here free and allow the idea to reach as many people as possible. **
-------------------------------------------------------------------------------
💸💸💸💸💸💸
👇 👇 👇 👇 👇 👇
BTC ANALYSIS📊 #BTC Analysis
✅There is a formation of Descending Channel Pattern in daily time frame in #BTC .
Also there is a perfect breakout and retest. There is an instant major resistance and major support zone and if #BTC breaks the resistance zone then we would see a bullish move
👀Current Price: $1,10,800
🎯 Target Price : $1,21,700
⚡️What to do ?
👀Keep an eye on #BTC price action and volume. We can trade according to the chart and make some profits⚡️⚡️
#BTC #Cryptocurrency #Breakout #TechnicalAnalysis #DYOR

Bitcoin trade planGot rejected from 112k , Looking forward to build a short position to 100k as swing short!
Close below 110k and we go short..
Waiting
Let's see how it plays...

DOGE Accumulation Cylinder about to take-off.Dogecoin (DOGEUSD) has been flat in August and so far on September's 1M candle, while being supported by its 1M MA50 (blue trend-line) for almost 1 year (October 2024).
This fits the pre parabolic rally pattern of the Accumulation Cylinder that both previous Cycles had. As you can see, it is that exact pattern (Accumulation Cylinder) that historically makes Doge's transition from its Bear Cycle bottom to the Bull Cycle. Once the 1M MA50 is established as the Support, the Accumulation Cylinder gives way to a Parabolic Rally take-off.
Both Cycles reached at least the 1.618 Fibonacci extension from their previous All Time High (ATH) before the Cycle peaked. This time, the realistic Target before the Cycle ends is at least $1.00, unless the Cycle gets a little prolonged in which case we could se an over-extension to $3.50 (the 1.618 Fib ext).
Which one are you aiming for?
-------------------------------------------------------------------------------
** Please LIKE 👍, FOLLOW ✅, SHARE 🙌 and COMMENT ✍ if you enjoy this idea! Also share your ideas and charts in the comments section below! This is best way to keep it relevant, support us, keep the content here free and allow the idea to reach as many people as possible. **
-------------------------------------------------------------------------------
💸💸💸💸💸💸
👇 👇 👇 👇 👇 👇

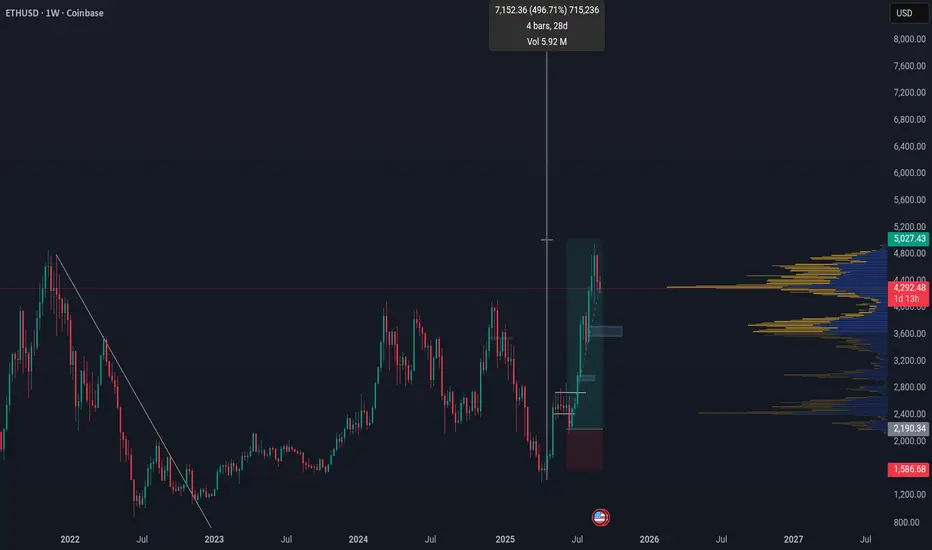
ETH/USDT | Hits $4950 ATH After 130% Rally – More Gains Ahead?By analyzing the Ethereum (ETH) chart on the weekly timeframe, we can see that, as expected, price has continued its bullish rally since our last analysis — successfully hitting all three targets at $4000, $4400, and $4900. With a remarkable 130% growth in just 77 days, Ethereum finally printed a new ATH at $4950!
Currently, ETH is trading around $4300, and as long as the price holds above the $3330–$3950 support zone, we can expect another strong bullish wave in the near future.
This analysis will be updated — stay tuned for the next move!
Please support me with your likes and comments to motivate me to share more analysis with you and share your opinion about the possible trend of this chart with me !
Best Regards , Arman Shaban

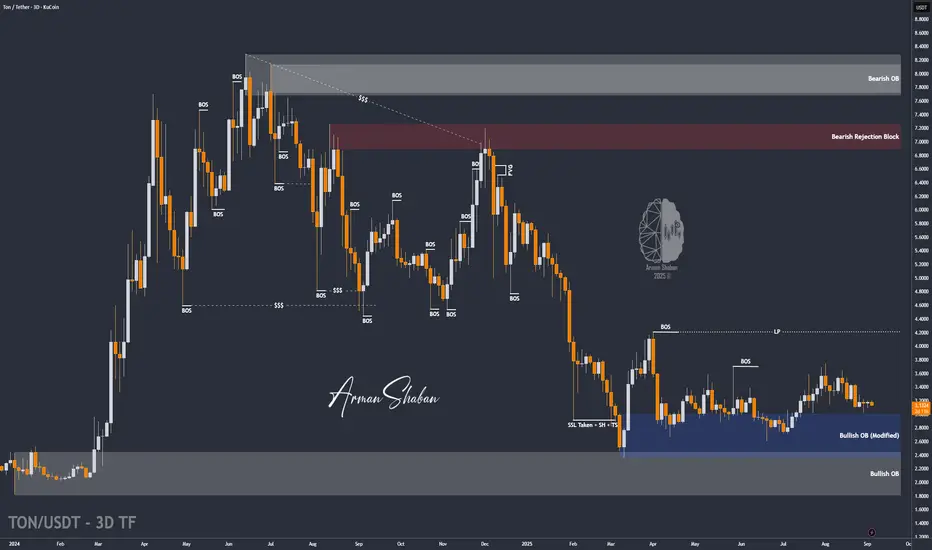
TON/USDT | TON Gearing Up for a Bullish Wave – Key Targets AheadBy analyzing the TON Coin chart on the 3-day timeframe, we can see that the price is currently consolidating around the key level of $3.13. This stabilization suggests that a strong bullish wave may be on the horizon.
The potential upside targets for this move are $3.63, $3.75, $4.20, and $4.68.
Keep an eye on this zone — momentum could kick in soon!
Please support me with your likes and comments to motivate me to share more analysis with you and share your opinion about the possible trend of this chart with me !
Best Regards , Arman Shaban
BITCOIN 4H Bullish Cross formed. Can it sustain a rally to 124k?Bitcoin (BTCUSD) just completed its first Bullish Cross on the 4H time-frame between the MA20 (red trend-line) and the MA50 (blue trend-line). Following a rejection after marginally breaching above the 4H MA100 (green trend-line), this pattern looks very similar to the Bullish Cross of June 25.
Both took place after a strong medium-term correction is the form of Channel Down patterns, with the Bullish Crosses getting formed after a Lower Highs break-out. If fact even the August 07 MA20/50 Bullish Cross led to a strong rally.
As a result, if BTC manages to turn its 4H MA100 into a Support, we expect it to initiate a new rally to test at least the previous High above $124k, similar to the July 03 High test. The 0.786 and 0618 Fibonacci levels can be used as Resistance and Support levels upon break-outs and pull-backs respectively.
So do you think this 4H MA20/50 Bullish Cross can kickstart a new rally? Feel free to let us know in the comments section below!
-------------------------------------------------------------------------------
** Please LIKE 👍, FOLLOW ✅, SHARE 🙌 and COMMENT ✍ if you enjoy this idea! Also share your ideas and charts in the comments section below! This is best way to keep it relevant, support us, keep the content here free and allow the idea to reach as many people as possible. **
-------------------------------------------------------------------------------
💸💸💸💸💸💸
👇 👇 👇 👇 👇 👇

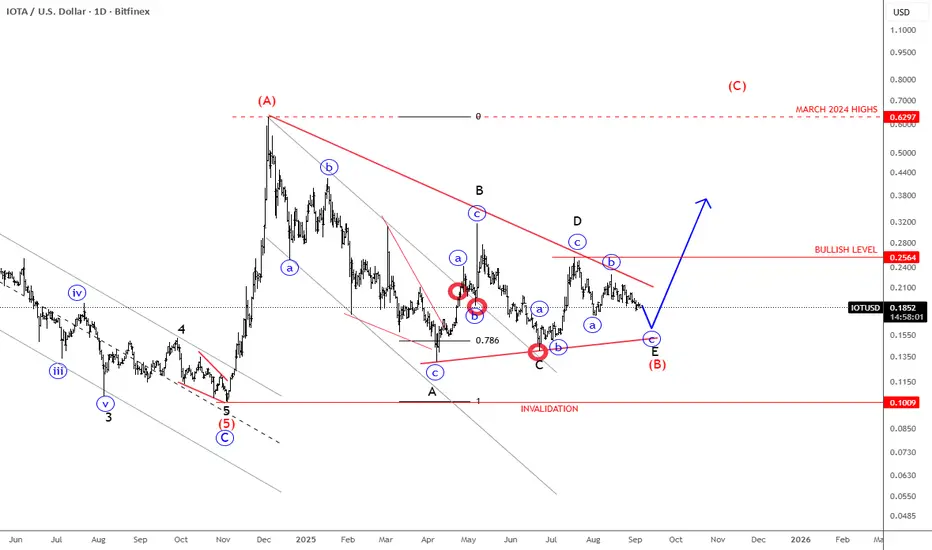
IOTA Finishing A Bullish Triangle?IOTA can be finishing a bullish triangle pattern that can send the price higher from technical point of view and by Elliott wave theory.
Cryptocurrency IOTA with ticker IOTUSD remains in sideways consolidation, and it more and more looks like a bullish ABCDE triangle pattern in wave (B) that can be coming to an end soon. We are actually tracking final subwave “c” of E of (B), so soon watch out for a strong bullish breakout into wave (C), which can send the price back to March 2024 highs. Keep in mind that bullish confirmation is only above upper triangle line and 0.25 level.
IOTA is a cryptocurrency designed for the Internet of Things (IoT). Unlike traditional blockchains, it uses a unique technology called the Tangle—a directed acyclic graph (DAG) that allows transactions to be feeless, scalable, and lightweight. This makes it well-suited for machine-to-machine payments, microtransactions, and secure data transfer. IOTA’s goal is to be the backbone of a machine economy, enabling devices to transact and share data autonomously.
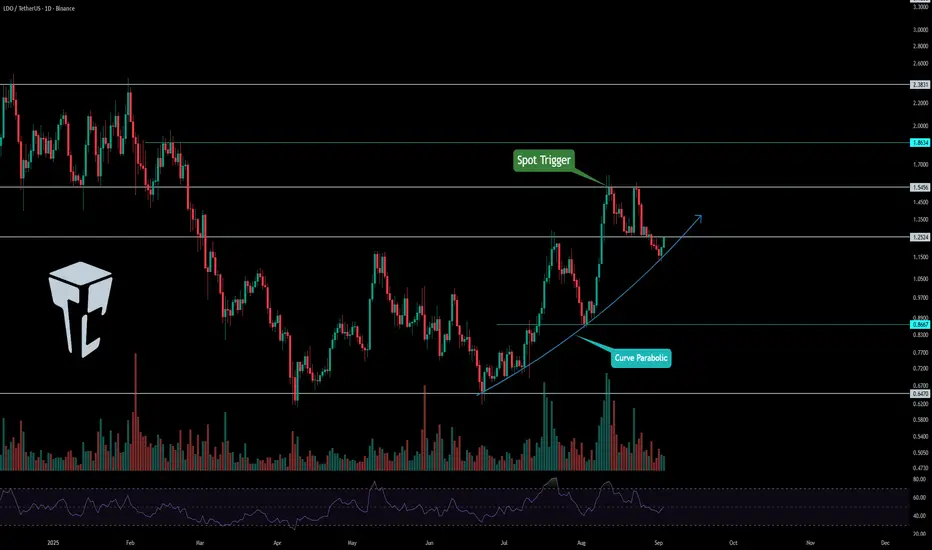
TradeCityPro | LDOUSDT The Best Spot Entry Point👋 Welcome to TradeCityPro Channel!
Let's move on to the LDO analysis, which has the most Ethereum possible in this staking network, and its job is to form nodes and structure transactions, and it has solved the problem of having 32 Ethereum to be a validator.
🌐 Overview of Bitcoin
Before starting the analysis, let me remind you again that we moved the Bitcoin analysis section out of this part and made it a separate daily analysis as per your request, so we can discuss Bitcoin’s condition in more detail and analyze its charts and dominance separately.
This is the general Bitcoin dominance analysis that we promised to cover separately and analyze in longer time frames:
🔗
📊 Weekly Timeframe
After the previous decline, LDO reached the important weekly support at 0.647 and showed a reaction.
With buyer presence, the price moved upward and is now sitting right under a resistance that once acted as a strong support. After breaking that level in the past, the price made a sharp move which makes this an important zone to watch.
🔗
📊 Daily Timeframe
On the daily chart, after bouncing from the 0.647 support area, LDO built a new structure.
Gradually, this move formed into a parabolic curve where every bounce from it triggered sharp upward movements.
For a spot buy entry, a risky strategy would be to buy on this curve reaction with a wide stop-loss (e.g., 0.8667).
However, I personally prefer waiting for the breakout of 1.5450, since that will allow me to set a tighter stop-loss and manage my capital more effectively, enabling me to take on higher risk within my risk management rules.
📝 Final Thoughts
Stay calm, trade wisely, and let's capture the market's best opportunities!
This analysis reflects our opinions and is not financial advice.
Share your thoughts in the comments, and don’t forget to share this analysis with your friends! ❤️
PEPEUSD Can the 1W MA100 make it skyrocket?Pepe (PEPEUSD) has been trading within an aggressive Channel Up from its very first trading day. Since the May 2025 High though, it has been basically trading sideways, consolidation possibly before the next big move.
As long as the 1W MA100 (green trend-line) is holding (which has been tested just this week), there are more probabilities for this move to be upwards. The fact that the 1W CCI is approaching is -100.00 oversold barrier, further supports this notion.
The last similar consolidation at the bottom of this pattern was from Sep 2023 to Feb 2024 and delivered a massive Bullish Leg that breached the 2.618 Fibonacci extension. As a result, if the pattern doesn't break, we might see 0.00010 as this Cycle's Top.
-------------------------------------------------------------------------------
** Please LIKE 👍, FOLLOW ✅, SHARE 🙌 and COMMENT ✍ if you enjoy this idea! Also share your ideas and charts in the comments section below! This is best way to keep it relevant, support us, keep the content here free and allow the idea to reach as many people as possible. **
-------------------------------------------------------------------------------
💸💸💸💸💸💸
👇 👇 👇 👇 👇 👇

TradeCityPro | ARBUSDT Easiest Short Trigger!👋 Welcome to TradeCityPro Channel!
Let’s go for the analysis of Arbitrum (ARB/USDT), one of the favorite coins among airdrop hunters with great memories, and still one of the most popular DeFi tokens.
🌐 Overview of Bitcoin
Before starting the analysis, let me remind you again that we moved the Bitcoin analysis section out of this part and made it a separate daily analysis as per your request, so we can discuss Bitcoin’s condition in more detail and analyze its charts and dominance separately.
This is the general Bitcoin dominance analysis that we promised to cover separately and analyze in longer time frames:
📈 On the 4H timeframe, ARB experienced a strong bullish wave. After breaking 0.4059 and moving out of the range box (0.36–0.40), it had a sharp rally reaching 0.6146.
❌ After rejection from this key weekly resistance, ARB formed a lower high and sharply corrected, eventually breaking below a resistance trendline.
📉 It has now reached the strong support at 0.4738, which also aligns with the 50% Fibonacci retracement level. According to Dow theory, the 50% level is also a very critical area, making this point an important PRZ (Potential Reversal Zone).
✅ For long positions: It’s still a bit early. With a trendline breakout you could attempt something, but personally, I’d wait for a higher high and higher low structure before going long.
⚠️ For short positions: The setup is much clearer. After breaking below 0.4738, we can open a short position targeting 0.4358, while keeping risk management in mind for opening positions.
📝 Final Thoughts
Stay calm, trade wisely, and let's capture the market's best opportunities!
This analysis reflects our opinions and is not financial advice.
Share your thoughts in the comments, and don’t forget to share this analysis with your friends! ❤️

BITCOIN dominance crashing. Are we ahead of a major Altseason?Bitcoin (BTCUSD) is on a relative correction lately, down more than $15000 from its last All Time High (ATH). Despite this obvious technical weakness, there is one indicator that delivers a very promising signal, not just for BTC but for the crypto market as a whole.
That is Bitcoin's Dominance (BTC.D, blue trend-line), which got rejected on its 8-year Lower Highs trend-line in mid-June and is pulling-back every since. This chart shows that both last two Cycles, such a rejection that took place in the last year of the Cycle, not only initiated a BTC rally but also an even stronger rise on the altcoin market, what is otherwise known as an 'Altseason'.
This time it took place about 6 months before the end of the year (projected end of the Bull Cycle), which is exactly what happened in 2017, the Cycle that the current one looks most like it.
As a result, we expect the current market weakness last at most another 2 weeks, which is roughly by the time of the next Fed meeting where the majority of the market is eagerly anticipating the first Rate Cut in years.
Do you think that is the signal of an upcoming final rally on Bitcoin and an Altseason? Feel free to let us know in the comments section below!
-------------------------------------------------------------------------------
** Please LIKE 👍, FOLLOW ✅, SHARE 🙌 and COMMENT ✍ if you enjoy this idea! Also share your ideas and charts in the comments section below! This is best way to keep it relevant, support us, keep the content here free and allow the idea to reach as many people as possible. **
-------------------------------------------------------------------------------
💸💸💸💸💸💸
👇 👇 👇 👇 👇 👇

BITCOIN BEARISH TRANDLINE WITH DOUBLE BOTTOM - READ CAPTIONHi trade's
Bitcoin is currently trading under a bearish trendline and attempting to form a possible double bottom near support.
Price is showing multiple rejections from lower support areas, indicating short-term buyers are defending this zone.
If the market retraces upward, the first resistance to watch is 110000.
A breakout above this resistance may open the way toward the supply zone
support zone 108200-107300
resistance zone 110000
supply zone 113000
👉 If you find this idea useful, follow for more daily updates 🔔
💬 What do you think about this setup – will Bitcoin hold support or break lower?

XRP Is Ready For Blast Off!I foresee a big pump coming for XRP. When support is found, the big picture accumulation pattern should take us soaring to new all-time highs in a mass adoption phase. I am very excited about this coin and firmly believe we will see a strong run. Based on fractal analysis, it looks very similar to its first accumulation fractal.
As always, stay profitable.
- Dalin Anderson

ETH Warrning !!!BINANCE:ETHUSDT The Ethereum is forming an expanding triangle + stochastic divergance.
Best wishes to you all
Markets Titan

TradeCityPro | LIKNUSDT Best Opportunity for Trading👋 Welcome to TradeCityPro Channel!
Let’s go to the LINK chart, the popular cryptocurrency, and analyze it together.
🌐 Overview of Bitcoin
Before starting the analysis, I want to remind you again that we moved the Bitcoin analysis section from the analysis section to a separate analysis at your request, so that we can discuss the status of Bitcoin in more detail every day and analyze its charts and dominances together.
This is the general analysis of Bitcoin dominance, which we promised you in the analysis to analyze separately and analyze it for you in longer time frames.
📊 Weekly Timeframe
On the weekly timeframe, LINK has been one of the cryptocurrencies that remained in a range for 500 days. After breaking out, we have seen the beginning of an uptrend.
This is exactly what I mean by avoiding capital lock-up. We waited weeks for the 8.06 trigger to break, allowing us to buy with momentum confirmation rather than buying inside the range and waiting in a high-risk market.
You might say, "Why not buy inside the range to avoid missing the 8.06 breakout?" My answer is that hundreds of coins are still stuck in similar ranges without showing any bullish moves, and even now, they could trap your capital for a long time, causing frustration!
📊 Daily Timeframe
In the daily timeframe, after being inside the range box between 11.58 and 15.50 and ranging in this area, we finally broke out and formed a curve movement.
Currently, after our uptrend, we have reached the 26.88 resistance, which previously rejected us from this area and is our most important resistance.
If we form a higher low in this area, we can make our spot buy after breaking 26.88.
📈 4H Timeframe
In the 4-hour timeframe, we experienced a very good uptrend and then entered a range phase, which increases the probability of a correction.
For a short position, after breaking 23.05, we can open a position with low risk and take profit quickly because the trend is bullish and we are not supposed to hold short positions for too long.
For a long position, we need to break the continuation trendline, and after activating the 23.89 trigger, we can open our long position. Our main trigger will be 26.5.
📝 Final Thoughts
Stay calm, trade wisely, and let's capture the market's best opportunities!
This analysis reflects our opinions and is not financial advice.
Share your thoughts in the comments, and don’t forget to share this analysis with your friends! ❤️

BTC 3-Drive Pullback. 113.5KMorning folks,
BTC for now is moving accurately from one our target to another. First it was 108.4K, now it is 108K. Next should be 104-105K...
Still, price stands at strong support area and is forming bullish reversal session on daily chart. On 1H chart we have clear 3-Drive Buy pattern. So, chances are above zero that before it keep going down, the pullback happens...
That's why if you want to go short we call you to wait for the bounce and try to sell the rally instead. The minimum 3-Drive target is above 113K top, where we have also K-resistance area. So, just watch for it, if you want to sell.
Also we have no objections against long entry with 3-Drive. Although it doesn't correspond to overall context and we do not include this trade in our plan. But, now this trade has a small risk and could be considered, if you want.
I sign this update with "Long" idea, but only for pullback. Context remains bearish.

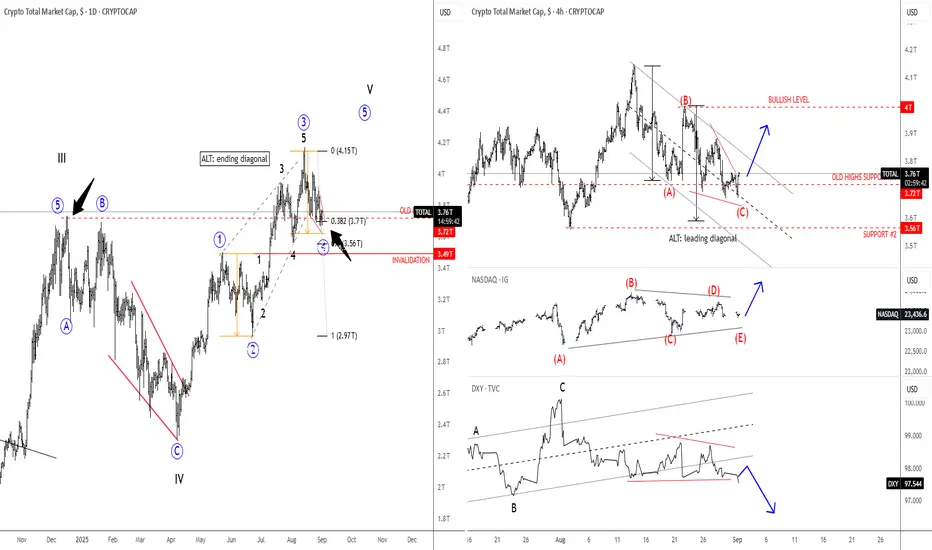
Crypto Market Approaching Support, While Finishing A CorrectionGood morning Crypto traders! Crypto market continues to slow down due to consolidation in stocks, but notice that the US dollar remains bearish, while gold is experiencing a strong bullish breakout. This suggests that we are still in a risk-on environment, meaning stocks could continue higher, while cryptocurrencies may soon stabilize. Crypto TOTAL market cap chart now appears to be approaching the key 3.6 - 3.5T support area within a three-wave ABC correction for wave 4, from where bulls for wave 5 may show up again, especially considering that the NASDAQ could be completing a bullish running triangle, while the US dollar index (DXY) is forming a bearish one.
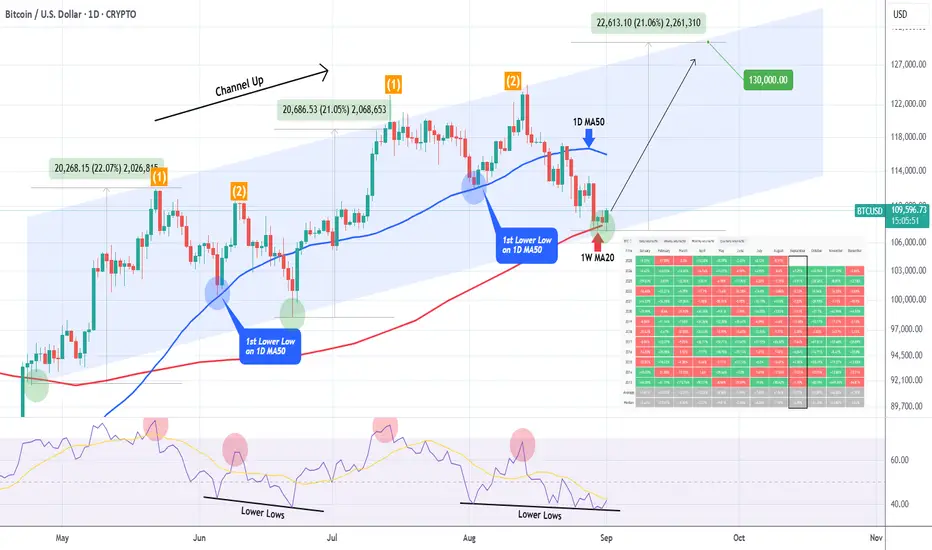
BITCOIN ahead of September crash on historically worst month??Despite the obvious hint of 2 potential rate hikes by the end of this year, Bitcoin (BTCUSD) has found itself on a downtrend. And as today we entered the first day of September, this sentiment is further empowered by one simple statistical fact: that September has historically been BTC's worst performing month.
As this table on the chart shows (source: CoinGlass), September's average returns have been -3.77%, the worst average score out of all months since 2013. An interesting fact however is that out of all the Septembers that ended in green (4), they did so when there was a red August (like the one we just closed at -5.91%). At the same time out of all the times August was red (8) four times September followed in red. This shows that historical probabilities are equally distributed there.
Statistics aside, the market has a strong case of a bottom on the current levels and that's purely a technical one. As you can see, since May 01, Bitcoin has been trading within a Channel Up. This pattern has seen so far two Bullish Legs of almost identical rise (+22.07% and +21.05% respectively) and when they corrected (Bearish Legs), the first Low was on the 1D MA50 (blue trend-line) and the second on the Channel Up bottom.
This time there is an even stronger technical case, as the price hit the 1W MA20 (red trend-line), which as we've shown on a recent study, is a Support level that historically kickstarts the final rallies during Bull Cycles.
Even their 1D RSI sequences are similar, with the indicator currently being on a Lower Lows formation that previously marked the June 22 (Higher) Low.
As a result, assuming we will see the 'minimum' of +21.07% Bullish Leg, we should be expecting a $130000 Higher High, which matches our realistic Cycle Top study, based on most studies we've conducted.
So do you think Bitcoin will again declined this September or we are currently forming a new bottom? Feel free to let us know in the comments section below!
-------------------------------------------------------------------------------
** Please LIKE 👍, FOLLOW ✅, SHARE 🙌 and COMMENT ✍ if you enjoy this idea! Also share your ideas and charts in the comments section below! This is best way to keep it relevant, support us, keep the content here free and allow the idea to reach as many people as possible. **
-------------------------------------------------------------------------------
💸💸💸💸💸💸
👇 👇 👇 👇 👇 👇
Bitcoin testing 116k zoneIf we are successful in breaking above the 116k zone resistance. Bitcoin will pump hard to 120k and 123k next. As the high time frame trend continues to stay uptrend. Let's see if bitcoin breaks it now or has some other plans.
Stay tuned!

Ethereum Price Roadmap: Bullish Outlook into 2026The larger structure remains bullish, but the simultaneous test of the channel top and the ATH zone makes a cooling-off / ranging phase likely.
Ethereum has held support above the lower boundary of the channel and has now reached the top of the second channel. The bullish outlook remains intact, and if the price secures a weekly close above $4,900, it may enter the green channel. In that case, reactions at both the mid-levels and tops of the channels can be expected as the trend continues.
Key support levels to watch are in the $4,200–4,300 zone (previous breakout area), followed by $3,300–3,500 (aligned with EMA20 and the channel midline), and then $2,900–3,100 (cluster of EMA50/100). As long as these supports hold, the overall bullish structure remains valid.
The uptrend is projected to extend into mid-2026, unless Ethereum breaks down and falls back into the lowest channel, which would invalidate the bullish outlook.
Additionally, the bearish structure of the Bitcoin dominance chart further supports this bullish scenario for Ethereum.
