BUY TEZOS NOWWBased on the XTZ/USDT 30-minute chart using Heikin Ashi candles:
• Current Price: The price is around $0.5636 (as of 20:49 on November 06, 2025).
• Support Zone: The chart shows a strong support area around $0.5252. The price has touched and held firm above this level in recent days, showing consolidation in this region, which indicates buying pressure is starting to emerge and preventing the price from dropping lower.
• Trade Setup:
• Entry: Currently around the market price, approximately $0.5636.
• Stop Loss: Placed below the nearest support zone, around $0.5252 (or slightly lower to avoid wick-hunts).
• Take Profit: A relatively distant target, around $1.0762 (based on the peak level drawn on the chart).
• Candlestick Signal: Using Heikin Ashi candles, small green candles are starting to appear after a period of red accumulation, which is an early sign of a reversal or at least an impending upward move.
• Risk/Reward Ratio (R:R): With Risk: $0.5636 - $0.5252 = $0.0384 and Reward: $1.0762 - $0.5636 = $0.5126. The R:R ratio is $0.5126 / $0.0384 \approx 13.3:1. This is an extremely attractive ratio, suggesting that a successful trade could yield massive profits relative to the risk.
Cryptomarket

PENGU / USDT : Bullish continuation setup / Target 10-15%Pengu / USDT is showing strength to continue its bullish momentum after the recent pullback.
Price is approaching key support zones that could trigger a 10–15% short-term move if held successfully. Watch these levels closely for confirmation.
Manage risk wisely and avoid early entries.

TradeCityPro | Bitcoin Daily Analysis #212👋 Welcome to TradeCity Pro!
Let’s dive into the Bitcoin analysis. The market has entered a corrective phase and is preparing for the next wave of movement.
⏳ 1-Hour Timeframe
On the 1-hour timeframe, Bitcoin started correcting after reaching the support at 100,308 and has now retraced to the 0.382 Fibonacci level.
📊 Market volume significantly increased around the 100,308 support, indicating that this zone is very sensitive and important, with price reacting to it.
✨ Currently, volume has decreased slightly, and the price is in a corrective phase. If this correction continues, the next resistance zones will be at the 0.5 and 0.618 Fibonacci levels.
⭐ However, if the price continues its downward movement, we can open a position with a candlestick setup when the volume increases towards 100,308, or wait for the break of the 100,308 support to open a position.
✅ For a long position, if buying volume increases, the break of the 0.382 Fibonacci level would be a good trigger for a long entry.
❌ Disclaimer ❌
Trading futures is highly risky and dangerous. If you're not an expert, these triggers may not be suitable for you. You should first learn risk and capital management. You can also use the educational content from this channel.
Finally, these triggers reflect my personal opinions on price action, and the market may move completely against this analysis. So, do your own research before opening any position.

TradeCityPro | HBAR: Support Zone and Key Resistance Levels👋 Welcome to TradeCity Pro!
In this analysis, I want to review the HBAR coin,one of the RWA (Real-World Asset) coins, with a market cap of $7.22 billion, currently ranked 19th on CoinMarketCap.
⏳ 4-Hour Timeframe
On the 4-hour timeframe, this coin is sitting on a very important support level. Unlike most altcoins that have lost their support levels, HBAR has managed to stay above its support zone.
🔔 A double top pattern formed below the 0.20789 level, and after the trigger activated at 0.19028, it made a downward move until it reached its support level and hit the pattern's target.
💥 Currently, after the price reached this zone, the market has reacted to it, showing a small bullish correction with low volume.
✨ The price has corrected to 0.17532. If the price gets rejected from this zone, we can consider entering a short position if the support breaks.
✅ If the price stabilizes above 0.17532, it may undergo deeper corrections up to 0.19028.
📊 For a long position, the 0.17532 break is not a very strong trigger because the market's momentum is still bearish. I believe the main long trigger is breaking 0.20789. We can take earlier triggers if a new structure forms.
💡 The main confirmation for a bullish trend will come with a break of 0.23093. For a short position, as mentioned, our trigger is the break of the support zone.
📝 Final Thoughts
Stay calm, trade wisely, and let's capture the market's best opportunities!
This analysis reflects our opinions and is not financial advice.
Share your thoughts in the comments, and don’t forget to share this analysis with your friends! ❤️

Bitcoin Monthly Chart Analysis : Bullish Scenario Bitcoin Monthly Chart Analysis : Bullish Scenario
*We already cleared last previous month low and back in last month range.
*Daily still looking bearish so expecting a rejection from daily SIBI-D(Red rectangle-Resistance)
*Next Big Support area is Monthly BISI-M ($95773-$98242)

BTCUSDT Review November 6 2025Short-term price movement ideas.
The price has made a monthly liquidity grab of the high, which with high probability should lead us toward the monthly long FVG. At the moment, we’ve seen a weekly liquidity sweep on the long side and left equal lows just before the monthly FVG.
The nearest area from which we can expect a continuation of the downward movement is the daily FVG and BtS zone. In case of a test of one of these zones and confirmation on a lower timeframe, short positions can be considered with the target of taking out the previous low.
Be flexible, adapt to the market, and the results will come quickly. Good luck to everyone.

BTCUSD H1 | Bearish Drop OffBitcoin (BTC/USD) has rejected the sell entry at 104,504.68, which is a pullback resistance that lines up with the 59% Fibonacci retracement and could drop from this level to the downside.
Stop loss is at 105,308.55, which is a pullback resistance that lines up with the 61.8% Fibonacci retracemnt.
Take profit is at 98,945.84, which is a pullback support.
Stratos Markets Limited (tradu.com ):
CFDs are complex instruments and come with a high risk of losing money rapidly due to leverage. 68% of retail investor accounts lose money when trading CFDs with this provider. You should consider whether you understand how CFDs work and whether you can afford to take the high risk of losing your money.
Stratos Europe Ltd (tradu.com ):
CFDs are complex instruments and come with a high risk of losing money rapidly due to leverage. 70% of retail investor accounts lose money when trading CFDs with this provider. You should consider whether you understand how CFDs work and whether you can afford to take the high risk of losing your money.

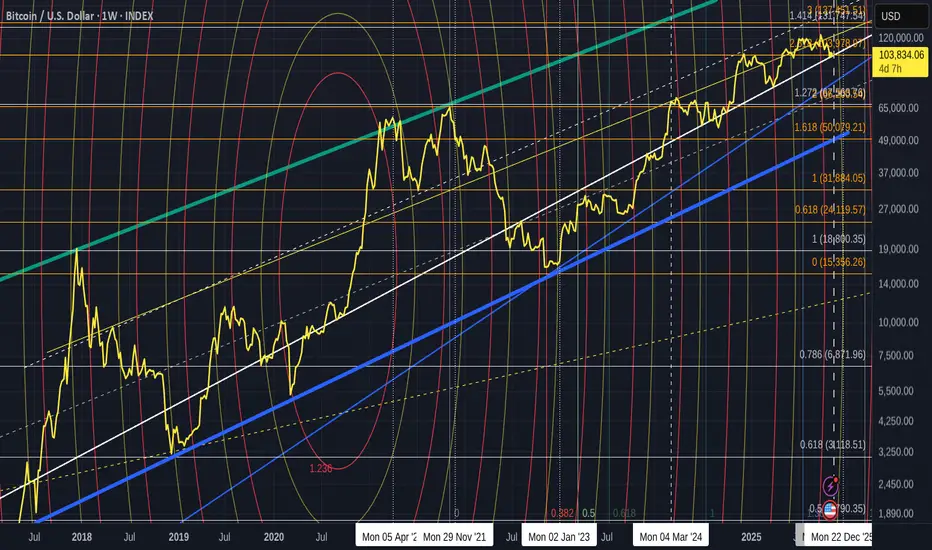
Quick Bitcoin Update - BTC entered a Squeeze. Needs to react
Simply, PA is now on a line of support that goes way back to 2017
PA Rose above it in 2019, COVID caused a Drop below but PA Recovered.
The 2022 Bear kept PA below for a Long Time but we broke back over.
And now, we test it again at te end of the 3rd Ranging period this Cycle.
There are things that Both Support and wtroy the idea that Oa can stay here and so we really do need to remain vigilant...
This Zoomed chart explains the situation clearly.
So we see, PA is now in a triangle, with the 2.618 Fib extension at around 103978, acting as resistance and the Long Term line f support mentioned above , as support.
This is a tight Squeeze. The Apex is around 17 November
PA ALWAYS REACTS BEFIRE THE APEX
This could be abytime from now till then.....
Be Ready
Bulls....We need you
BTC 4H Trade Idea Here is an trade idea for Bitcoin on 4H time frame.
BTC has renounced from important daily reversal zone. Looks good here for upside.
Entry & Exit Points are given with RR of 2.13. Amazing!!!!!
DYOR NFA..

BTC Long Term Trend: From Warning to Stress Test. Two weeks ago, I highlighted that BTC had transitioned from bullish to warning phase, with yellow candles replacing green, sentiment rolling over, and my proprietary COMPOSITE index collapsing below 0.50. That signal came just before the 10/10 crash, and the structure shifted exactly as expected.
Now, with social media screaming “bear market,” it is time to ask the real question: is this the start of a new downtrend, or a volatility adjusted correction within a still intact macro uptrend?
Let’s break it down across three lenses: Weekly, Daily, and 4H, to separate noise from structure using a rigorous statistical and mathematical framework. Let the science speak.
1️⃣ Weekly Setup: The Long Term Structure
Despite the headlines, the data does not confirm a full reversal yet. The long term channel remains technically upward biased, even though it is clearly under pressure.
Unlike previous corrections that stayed comfortably within the ML channel or barely dipped below its baseline temporarily, this move has pushed price to its lower boundary in a stronger form, even moving the 2 sigma derived white point that I use not only as a stop level but also as a trend indicator. However, despite the unquestionable pressure mounting, price has not broken the structure yet.
The cyan histogram (my Composite Index) on the lower panel tells an even deeper story. Past pullbacks were very well telegraphed by the collapse of the red line, which signaled temporary structural resets. This time it is messy, less coherent, more disorderly, with the red line unable to telegraph a temporary move. This suggests a much more serious test for the long term trend is happening, although the final damage has not been inflicted yet.
🧭 Statistically, this remains an upward system under heavy stress, not a reversed one.
2️⃣ Daily Setup: Tactical Deterioration
On the daily chart, the short term structure has clearly rolled over. Price action closed well below the ML channel baseline, confirming dominance of selling momentum.
My composite sentiment aggregator is more coherent here, clearly tilted to the downside, printing negative readings that are consistent with distribution rather than accumulation. This frame says that bears control the short term flow, but we have not yet triggered the full structural breakdown seen in prior cycle reversals.
3️⃣ 4H Setup: Micro Structure (Swing View)
Zooming into the 4 hour view, we see a textbook micro replica of the daily structure. Price fell hard below the baseline, then briefly rebounded inside the ML channel. That rebound is a technical reaction, not a trend change.
Strictly speaking from a statistical point of view, this current rebound is noise against a broader deterioration visible in higher timeframes. Until the daily and weekly setups recover, every 4H bounce remains a countertrend move, not a reversal.
Conclusion: The Crossroad Moment
We are standing at an inflection point.
Weekly: Upward trend under stress.
Daily: Active short term downtrend.
4H: Temporary rebounds within that weakness.
A sustained break of the weekly ML midline would confirm a deeper phase shift, possibly the start of a true bear regime. Until that happens, this remains a stress test of the long term structure, not its collapse.
If you would like to see how these ML based indicators are built and why they adapt faster than most traditional systems, just ask for it in the comment section below or connect.

Pullback or Freefall? Bitcoin’s Battle Around $100K?Bitcoin dropped below $100K yesterday, setting a new lower low and confirming the ongoing bearish momentum.
Currently, the price is pulling back toward the $105K–$106K zone, which aligns with a key Fibonacci retracement level.
What’s next?
I expect a rejection from this area, followed by a retest of $100K, and possibly a move below that — meaning we might soon see a four-digit Bitcoin again.
As always, this is not financial advice, just a personal market observation.
#BTCUSD #BitcoinAnalysis #Crypto #TradingView #PriceAction

TradeCityPro | Bitcoin Daily Analysis #211👋 Welcome to TradeCity Pro!
Let’s dive into the Bitcoin analysis. The market is still in a downtrend and has reached its next support!
⏳ 4-Hour Timeframe
Bitcoin finally broke the important support at 106,396 yesterday, and with a very high selling volume, it managed to start its new downward wave.
💥 The RSI oscillator also entered the oversold zone at the same time as the 106,396 break, which was another reason for the market's drop.
⚡️ This downward move has reached the 100,308 support, and the price has calmed down a bit now.
✅ The psychological level of 100,000 is extremely important. Despite the massive selling volume and bearish momentum in the market, buyers haven’t allowed the price to stabilize below this level, and now the market is in a corrective phase.
🧩 After the price reacted to this zone, the volume has significantly decreased, which favors the sellers. If the buying volume remains low, the price will likely start falling again with the entrance of new selling volume.
🔔 However, since the RSI has faked the 30 level and the market momentum could turn bullish, we could see a reversal. If the volume starts to increase and considering the bullish trend on higher timeframes like the weekly chart, we could open a position.
🔍 For now, the first long trigger we have in this timeframe is 111,789. If the price can sharply recover to this level, a very strong bullish trend could begin.
💡 The main resistance zone we have is 115,771, and breaking this level will confirm the start of Bitcoin's new upward wave. We can look to enter the trend after breaking 111,789. If the price builds further structure, we can enter earlier with smaller triggers.
❌ Disclaimer ❌
Trading futures is highly risky and dangerous. If you're not an expert, these triggers may not be suitable for you. You should first learn risk and capital management. You can also use the educational content from this channel.
Finally, these triggers reflect my personal opinions on price action, and the market may move completely against this analysis. So, do your own research before opening any position.

#AAVE Bears Ready For Further Downside | Must Watch For Bears Yello Paradisers! Are you watching what’s unfolding on #AAVEUSDT right now? Because if you’re not, this could catch you completely off guard. There’s a potential bearish breakdown brewing that could send #AAVE into much deeper territory. Let’s dive in before it's too late:
💎#AAVE has been trading inside a symmetrical triangle, caught between a descending resistance and ascending support. Each test of the upper boundary has been weaker, showing fading bullish momentum. Now, we’re pressing against the lower support line with sellers gaining control.
💎The current price is $222, and we’re right on the edge. A confirmed breakdown below the ascending support will flip the entire structure bearish. The 50 EMA is now acting as resistance, reinforcing this downward pressure and aligning with the broader setup.
💎If this bearish scenario confirms, the next downside target becomes the Support Zone around $195–180, but the real liquidity lies deeper. A sharp move could easily send #AAVEUSD into the Strong Demand Zone between $133–123, where we expect stronger buyers to finally show up.
💎However, this setup is invalidated if #AAVE breaks back above the Resistance Zone at $263. That would signal strength and likely trigger a fast bullish reversal targeting higher levels above $280.
Trade smart, Paradisers. This setup will reward only the disciplined.
MyCryptoParadise
iFeel the success🌴

SNX : SIGNALHello friends
Given the good growth we had and the arrival of buyers, now that the price is correcting, there is a good opportunity to buy in steps with risk and capital management and move towards the specified goals.
*Trade safely with us*

TRUMP : SIGNALHello friends
Given the good growth we had and the entry of buyers, now that the price is correcting and a double bottom pattern has formed, there is a good opportunity to buy with risk and capital management and move towards the specified goals.
*Trade safely with us*

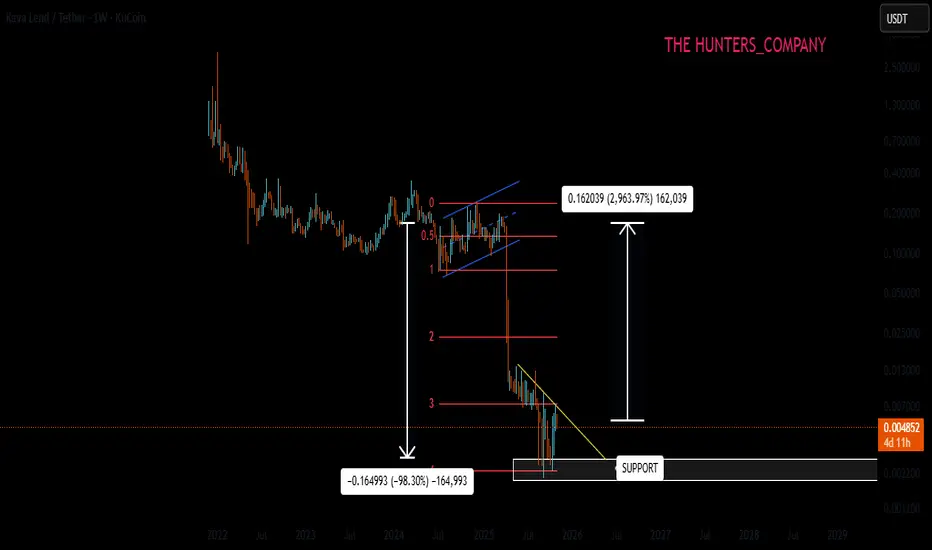
HARD Hello friends
Given the recent decline, this currency has almost reached the verge of destruction, but it seems to be supported and it remains to be seen whether this support will continue or not.
Don't forget risk and capital management.
*Trade safely with us*

Bitcoin Daily Analysis #11 – November 05, 2025 Scared? 😅
Good — pay close attention to how you feel these days and journal everything. The most valuable financial lessons come exactly from moments like these. 📖
As you can see, Bitcoin is under heavy selling pressure, and its sharp drop around the $100,000 zone has so far been supported by buyers.
If that support breaks again, you could consider opening a short position, but ⚠️ don’t hold it too long — the overall trend remains bullish, and a strong rebound could follow.
Around $104,000, we might see a risky long trigger, but only with tight risk management and a controlled position size.
If Bitcoin tests $104,000 and gets rejected, a deeper correction or even a sharp drop could follow.
We’re in a phase where the market could swing both ways — once it breaks out of this uncertainty, expect a powerful move. ⚡
Macro data and recent economic news still favor Bitcoin, and interestingly, during this decline, the big players have mostly stayed on the sidelines, with lower-than-average trading volume. 📈
No matter which way Bitcoin moves, your risk management will determine your success. 🎯
So avoid emotional decisions and let the chart structure guide you. 📊
Disclaimer:
This content is for informational purposes only and does not constitute financial or investment advice. © DIBAPRISM
Larry D.Kohn

Crypto is going crazyBitcoin just lost its major daily support — but is it the end or just a reset? Let’s break down the real situation in crypto this November using data, psychology, and Dow theory.

TradeCityPro | ZEC: Bullish Trend & Key Resistance Levels👋 Welcome to TradeCity Pro!
In this analysis, I want to review the ZEC coin—one of the privacy coins, with a market cap of $7.12 billion, currently ranked 19th on CoinMarketCap.
⏳ 4-Hour Timeframe
This coin is moving completely independently from the market, and while Bitcoin and other altcoins are experiencing significant declines, ZEC continues its bullish trend.
🔔 Currently, the price is within a steep ascending channel, which was formed after breaking the 292 level.
✅ The resistance the price is currently facing is the 474.83 level, and I believe that if this level is broken, we can look for the next long position.
🎲 If this resistance is broken, a bullish leg towards the upper boundary of the channel could form.
💥 The RSI oscillator is moving within a box between 50 and 70, and the 50 level serves as a strong momentum support for this coin.
✨ As long as the RSI stays above 50, the bullish wave will continue, and we can open positions with broken triggers. If the 70 level breaks and enters the overbought zone, the bullish move will become even sharper.
📊 This coin is not suitable for short positions. There are plenty of altcoins that are in a downtrend and have short triggers, so it’s better to focus our attention on ZEC for long positions only.
📝 Final Thoughts
Stay calm, trade wisely, and let's capture the market's best opportunities!
This analysis reflects our opinions and is not financial advice.
Share your thoughts in the comments, and don’t forget to share this analysis with your friends! ❤️

One Final Run for Bitcoin?Bitcoin is getting hammered. But I think it have enough stamina for one final push to cycle top. My original target for the top is 135k-150k zone but I won't risk trying to catch the very top so my TP target is 133k. Hope it fell to 99k and trigger my long.

Liquidity Zones Explained: Where Smart Money GoesMarkets don’t move randomly. Every candle, spike, or reversal happens for a reason and that reason is liquidity.
Liquidity is what fuels price movement. It’s where buy and sell orders are concentrated, and where large players execute positions without showing their hand.
Understanding where liquidity lies gives traders a major advantage, because price doesn’t move to levels by accident. It moves there to fill orders.
Liquidity represents the pool of resting orders waiting to be filled — stop losses, pending buys, or sells.
When price reaches these areas, volume spikes, and the market finds enough counterparties for large players to enter or exit positions.
Liquidity isn’t just numbers on the book. It’s the invisible map of trader behavior:
– Stops above highs (where breakout traders get trapped)
– Stops below lows (where panic selling occurs)
– Consolidation zones (where both sides accumulate orders)
These areas become magnets for price movement.
When you see sharp wicks above or below key levels, it’s often not manipulation — it’s collection.
Smart money drives price into these zones to trigger stop losses and capture liquidity before reversing in the true direction.
The move looks random, but it’s calculated.
The goal is to fill large positions efficiently, using retail orders as exit liquidity.
Instead of chasing price, learn to wait for liquidity grabs.
The simplest method is to mark obvious highs and lows and observe how price reacts when those levels are taken.
If price breaks a key high but fails to continue — and momentum shifts back down — it’s often a sign of a liquidity sweep, not a breakout.
These moments reveal where the real players are positioning themselves.
Trading liquidity is about reaction, not prediction.
Liquidity zones reveal where traders are trapped and where professionals engage.
If you stop focusing on where price is and start paying attention to why it moves there, you’ll see the market with far more clarity.

$BTC Correction Update: Last Leg of The Correction! - 11/4/2025CRYPTOCAP:BTC Correction Update:
Wave Z—the final leg of the structure—is typically fast-paced.
Target zones:
• Equal to Wave W → $100,275
• 161.8% extension of Wave W → $93,936
The chart outlines how the correction evolved and the patterns selected to complete it.
#BTC
