XTZUSDT Analysis: Is a Big Move on the Horizon?Yello Paradisers! Ready for another deep dive into the #XTZUSDT action? Let's uncover what's brewing and how you can navigate the market like a pro.
💎Currently, SEED_DONKEYDAN_MARKET_CAP:XTZ is sitting pretty within a crucial support zone at $0.740. This position hints at a potential upward swin

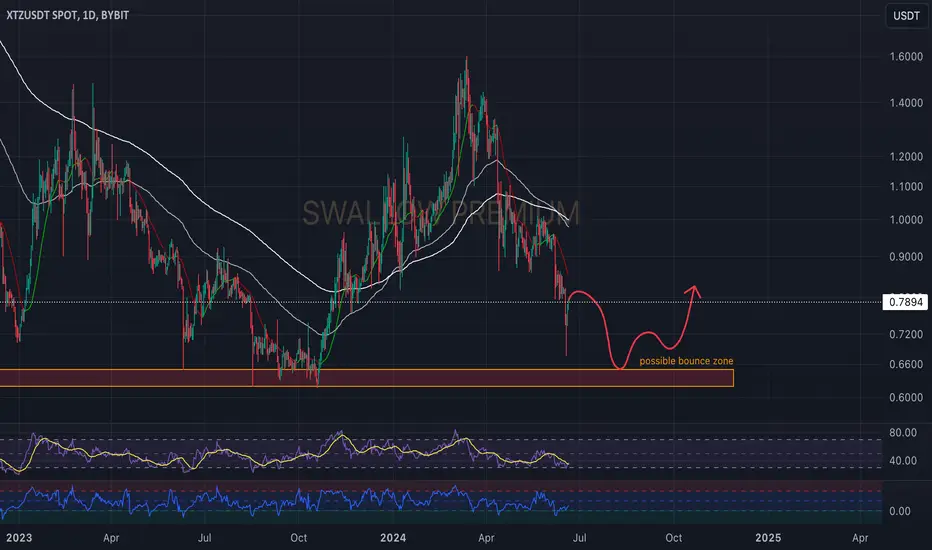
XTZUSDT: Trend in daily time framePlease pay special attention to the accurate trend, channel, and very accurate colored levels
Be careful
BEST
MT

XTZUSDT 1WXTZ ~ 1W
#XTZ We expect a double bottom from this and a short term rise of at least 20%+, Or if this fails, COINBASE:XTZUSD will bottom further.

Tezos (XTZ): Possible Bounce From Local Support / Will Drop MoreTezos is looking sweet after another rejection from upper zones.
As price has been dropping steadily we are looking at candlestick moves here mroe than regular patterns and zones.
With each daily closing below local resistance zone we will be looking for zone to be reached within the next 10 day
Long XTZ - Potential Reverse Head and Shoulder#XTZ is at the monthly support.
It is a bit early to tell but potential reverse head and shoulder is forming.
the previous day hammer candy is a good bullish sign.
Invalidate if price go below the monthly support.
Bitcoin is on the steering at moment. Rebounded at monthly support as well.
Idea

Long-TermXTZ sitting at 92% discount from ATH
Hold for 1-2 Years
Following history when BTC moves Altcoins follow

Accumulation phase - Trade entryI am pleased to share my latest trade : XTZ/USDT on Kucoin platform.
Money management strategy:
The designated capital for this trade is $500+(emergency fund of 500$). Here's how the funds will be allocated:
1st Order ($500 spot) : Placed at the current market price 0.832$. This order aims to

XTZ 4hTezos 4h 14 profit targets been taken, 1 breakeven
And again, if you ask me this is very, very not bad statistic

Tezos KDJ signalXTZ is very undervalued ..and needs to play ketchup with the alts price performance winners.
We may remember may 2021 when Red Bull Formula 1 Racing Team Partners With Tezos
and Tezos ending Red Bull sponsorship deal - in dec 2022.
Tezos is a self-upgradable and energy-efficient Proof of Stake blo


See all ideas
Frequently Asked Questions
The current price of Tezos / TetherUS (XTZ) is 0.775 USDT — it has fallen 0.51% in the past 24 hours. Try placing this info into the context by checking out what coins are also gaining and losing at the moment and seeing XTZ price chart.
Tezos / TetherUS price has fallen by 4.32% over the last week, its month performance shows a 0.39% increase, and as for the last year, Tezos / TetherUS has decreased by 4.32%. See more dynamics on XTZ price chart.
Keep track of coins' changes with our Crypto heatmap.
Keep track of coins' changes with our Crypto heatmap.
Tezos / TetherUS (XTZ) reached its highest price on Oct 4, 2021 — it amounted to 9.171 USDT. Find more insights on the XTZ price chart.
See the list of crypto gainers and choose what best fits your strategy.
See the list of crypto gainers and choose what best fits your strategy.
Tezos / TetherUS (XTZ) reached the lowest price of 0.616 USDT on Oct 19, 2023. View more Tezos / TetherUS dynamics on the price chart.
See the list of crypto losers to find unexpected opportunities.
See the list of crypto losers to find unexpected opportunities.
The safest choice when buying XTZ is to go to a well-known crypto exchange. Some of the popular names are Binance, Coinbase, Kraken. But you'll have to find a reliable broker and create an account first. You can trade XTZ right from TradingView charts — just choose a broker and connect to your account.
Crypto markets are famous for their volatility, so one should study all the available stats before adding crypto assets to their portfolio. Very often it's technical analysis that comes in handy. We prepared technical ratings for Tezos / TetherUS (XTZ): today its technical analysis shows the sell signal, and according to the 1 week rating XTZ shows the sell signal. And you'd better dig deeper and study 1 month rating too — it's sell. Find inspiration in Tezos / TetherUS trading ideas and keep track of what's moving crypto markets with our crypto news feed.
Tezos / TetherUS (XTZ) is just as reliable as any other crypto asset — this corner of the world market is highly volatile. Today, for instance, Tezos / TetherUS is estimated as 0.52% volatile. The only thing it means is that you must prepare and examine all available information before making a decision. And if you're not sure about Tezos / TetherUS, you can find more inspiration in our curated watchlists.
You can discuss Tezos / TetherUS (XTZ) with other users in our public chats, Minds or in the comments to Ideas.