BTCUSDT: short 98888.8If we exclude random pumps and dumps, the market is currently suspended in uncertainty.
BINANCE:BTCUSDT.P neither breaks below the 100,678.0 support level nor bounces back from it — it simply grinds sideways.
A clear local level has formed at 98,888.0, from which BTC has bounced twice in the past two days.
Now, the price is gradually moving toward it again, indicating a short-biased sentiment.
This lack of clarity in BTC’s behavior keeps the entire crypto market frozen.
The only movements come from baseless pumps and dumps, emerging and ending at random points.
However, I believe clarity is approaching — BTC cannot stay in this tension forever.
It will either break upward or fall lower.
My analysis suggests the next move will be down, and that’s when we’ll see the real market move.
For now — we wait.
___
System first:
Every non-systematic profit is bad.
Every non-systematic loss is bad.
Every systematic profit is good.
Every systematic loss is part of the work.
Was this analysis helpful? Leave your thoughts in the comments and follow to see more.
Cryptomarket

BTC Analysis | CME GapHello friends
Bitcoin’s critical gap between $91,500 and $92,500 could serve as a short-term correction target if selling pressure continues.
A gap that closes could set the stage for a bottom and a continuation of the uptrend.
The price’s reaction to this area will determine the market’s next direction.
Don't forget risk and capital management.
*Trade safely with us*

ALGO Pullback Opportunity – Ready for the Next Leg Higher?After a strong 28% move up from our last call, Algorand (ALGO) has pulled back into a key support zone, potentially setting up for another bullish wave. This type of retracement after a breakout is typical in trending markets and often offers high-probability re-entry points.
📌 Trade Setup:
Entry Zone: $0.15 – $0.16
Take Profit Targets:
→ Tier 1: $0.22 – $0.26
→ Tier 2: $0.28 – $0.33
Stop Loss: Just below $0.13
This setup offers a favorable risk-to-reward ratio, targeting a continuation of the prior move while protecting against deeper downside. Volume confirmation and market conditions should be monitored closely for added conviction.

Very Simple BITCOIN Daily - Hope for the weekend existsThis is a chart I posted some weeks ago, showing the possiblr results of the classic W pattern printed by Bitcoin
We seem to be playing this out and so a Low, ultimate low of around 88K exists and I will not do anything till we pass that point, IF we pass that point.
And the MACD gives us hope that we may not do so
MACD has reached the lower trendline of its descending channel and at the same time, has reached the LOW in Oversold, that Bitcoin bounced off previously
This is not a Guarantee but it does certainly offer hope for some recovery....and we would have to wait and see if that is sustained or not.
But this IS playing out Exactly to plan and has confluence with what I said may happen at the beginning of the month
For me, this is NOT the END.... but near the beginning of the next push
BUY BITCOIN

TradeCityPro | Bitcoin Daily Analysis #220👋 Welcome to TradeCity Pro!
Let’s move on to the Bitcoin analysis. The market continues its downward movement, and yesterday it recorded another bearish leg.
⏳ 1-Hour Timeframe
If you remember, yesterday we drew a bearish structure for Bitcoin with a bottom at 10,1302, which we could use as a trigger for a short position.
⭐ After that level was broken, a new downward move began, and the RSI entering the oversold zone added even more bearish momentum to the market.
✔️ As a result, the price managed to drop below the 9,9631 level in its first move. After a pullback to this zone, Bitcoin has now started another downward leg.
📊 Volume has been increasing throughout this bearish movement, and the RSI is once again approaching the oversold area, meaning that if it enters this zone, the current leg is likely to continue.
⚡️ We can also draw a curved trendline on Bitcoin’s chart, from which the price was rejected yesterday. The price is currently far from that line, but if a correction occurs, this trendline could act as a dynamic resistance. The static resistance zone is at 9,9631.
🎲 For today’s trading setup, the short trigger is at 9,7117, though it’s quite risky and has a high chance of being a fakeout. However, if market momentum remains bearish, this trigger can still be suitable for a short entry.
💡 If you already have open short positions, there’s no need to open new ones using this trigger — your entry is already at a good point. For profit-taking, you can use Dow Theory’s trend reversal signals to guide your exits.
❌ Disclaimer ❌
Trading futures is highly risky and dangerous. If you're not an expert, these triggers may not be suitable for you. You should first learn risk and capital management. You can also use the educational content from this channel.
Finally, these triggers reflect my personal opinions on price action, and the market may move completely against this analysis. So, do your own research before opening any position.

Bitcoin - Will it take the liquidity at $98.000?Bitcoin (BTC) has shown a clear downward price structure in recent days.
After a period of sideways movement and attempts at recovery, selling pressure has once again become dominant, resulting in a sharp decline toward key liquidity zones.
4h Bullish FVG Inversion
BTC has just failed to hold the 4-hour bullish FVG and has closed below it, which now acts as resistance (inversion). This opens the path toward lower levels, and the likelihood of a continued decline remains high. The bulls are currently struggling to regain ground.
Liquidity Sweep
During the most recent session, a liquidity sweep occurred, with the price dipping below previous lows and triggering many stop-losses and sell orders. Although such a move often leads to a technical bounce, overall sentiment remains bearish. The remaining liquidity below the major low around $98,000 continues to create selling pressure and could lead to further downside.
Conclusion
Despite the recent liquidity sweep, there is still no convincing bottom in sight, and downside risk continues to dominate. As long as BTC trades below the 4h FVG inversion and bearish momentum persists, a move toward $98,000 remains the most likely scenario within the current technical outlook.
-------------------------
Thanks for your support. If you enjoyed this analysis, make sure to follow me so you don't miss the next one. And if you found it helpful, feel free to drop a like 👍 and leave a comment 💬, I’d love to hear your thoughts!

ANFIBO | BTCUSD - $94.000 or $70.000? [11.6.2025]Hi traders, Anfibo's here!
BTCUSD – Technical Outlook
Technical Structure:
Price action currently respects a descending channel, with:
- Upper boundary (resistance): around $106,000 – $107,000
- Lower boundary (support): converging with the D1 trendline and the 0.618 Fibonacci retracement zone, located between $94,000 – $95,000
This confluence area at $94,000 – $95,000 will be crucial. It not only represents technical alignment between multiple structures (Trendline + Fibonacci) but also marks the boundary where short-term sentiment could shift from corrective to impulsive.
Trading Strategy:
Our tactical approach remains straightforward and adaptive:
“Trade the trend when touched – reverse the bias if the trend breaks.”
#1 – Rejection at Upper Boundary:
Should BTC retest the 106–107k resistance and fail to break through, short-term sell opportunities may arise targeting the mid-range or lower boundary (95k region).
#2 – Reaction at Lower Boundary:
If price reaches the 94–95k support zone and holds, this area could offer high-probability long entries, particularly if accompanied by bullish divergence or strong volume confirmation.
#3 – Breakdown of Structure:
A clean break below $90,000 would signal structural weakness, exposing BTC to the next major support cluster between $80,000 and $70,000. Such a move would represent a deeper corrective leg in the broader cycle and could reset the market’s medium-term trend.
Trading Plan:
>>> SELL ZONE: (x1000)
ENTRY: 106 - 108
SL: 109
TP: 95
>>> BUY ZONE:(x1000)
ENTRY: 93 - 95
SL: 90
TP: 120
Risk Management:
- Stick to small-to-medium positions within the range; increase size only on confirmed breakouts.
- Keep stops tight, as sideways phases tend to trigger false signals.
- Maintain Risk:Reward ≥ 1:2 and avoid overtrading in choppy conditions.
- Reassess bias once the channel is clearly broken.
Conclusion:
BTC is currently in a compressed, corrective phase, moving within a defined range. The key battleground lies between $95,000 and $107,000. Traders should remain flexible, respecting both boundaries of the channel and reacting based on breakout confirmations rather than anticipation.
As long as BTC holds above the $94,000 – $95,000 confluence, the broader bullish structure on the daily timeframe remains intact. However, a decisive break below $90,000 would open the door for a larger-scale correction toward the $80,000 - $70,000 zone—where long-term accumulation could once again become attractive.
GOODLUCK GUYS!!!

BTC CRACK! UPDATE WARNING!!⚠️ BTC CRACKS — Officially in a Bear Market (-24%)
Bitcoin has now broken below $97,000, down 24% from its highs, officially entering bear-market territory.
I’ve been warning about this setup for months — not because I enjoy being bearish, but because the structure was screaming caution.
This isn’t a “buy-the-dip” moment or a garden-variety correction. We’ve hit a major technical and psychological level that could decide the next phase for the entire crypto space.
If this level fails, expect a chain reaction across risk assets — leverage, liquidity, and sentiment all roll over together.
It could be years before you see another uptrend. Note: This is not a short-term trade.
Stay sharp. The real test for crypto starts now.
Thank you ALL FOR getting me up to 5,000 followers!! ))
Click boost, follow, comment nicely for more authentic, no BS, raw analysis. Let's get to 6,000 followers. ))

Bitcoin: Liquidity CycleTypical liquidity cycle is 5-6 years long (65m). Buy bitcoin before an upswing (or end of QT) and sell when liquidity tightens. Macro is the best way to analyze markets?
Adjust your stakes based on position of the cycle.
Markets can have risk-on, risk-off episodes. Where Bitcoin is a risk-on asset.
Use 10Y-02Y for guidance.

Bitcoin $BTC Correction📊 The 38.2% Fibonacci retracement at $83K remains a high-probability target in the coming months but the key question is whether #Bitcoin CRYPTOCAP:BTC will deliver a decent bounce toward $110K first.

If USDT.D Breaks 6.2%, Say Goodbye to AltsUSDT.D is now heading toward a key resistance zone. Until it reaches that level, altcoins could continue to face selling pressure.
If USDT.D breaks and holds above the marked zone, it could signal the start of a broader bearish phase for the market. However, historically, this level has acted as a strong rejection zone, so a pullback from around 6.2% could once again bring relief for altcoins.
Keep a close eye on how dominance reacts here, the next move could decide the short-term trend for the entire market.
DYOR, NFA

Quick Bitcoin Update - Daily Linear chartRefering to my previous post.
RED 236 Fib circle reached
PA reacted before APEX of Squeeze.
This is approaching a VERY GOOD BUYING oppertunity
We may go to 95K and possibly 88K but the Arrow is the Target I am looking at
Time will tell

BULLRUN IS OVER, ALTSEASON WAS A DREAM—WE ARE DONE!!!!Ladies and gentlemen, as I'm writing this idea on November 13, 2025, Bitcoin is in the midst of breaking its crucial 100k daily support. Let's dive into a quick analysis together and figure out what we should do next.
If the daily candle closes like this, what does it mean? Starting with the candle itself: upper shadow about 1.5x the body, tiny lower shadow, and a solid body. This screams that buyers tried hard to drive the price up—they burned through a ton of cash—but sellers absolutely crushed them, dragging it right back down to the support level with overwhelming force. That leaves buyers running on fumes for any follow-through, and a sharp 10-15% plunge? Totally not out of the question after a candle like this. Not trying to scare you—just calling it like the chart sees it.
Point two: Before this floor break, we were consistently printing lower highs, with volume dipping during corrections and spiking on the drops.
So, what's next? If the candle closes in this shape, come next week, every scenario shifts to short-only—we're not even entertaining longs anymore. Scenario B: If this candle reverses with a strong shadow and closes back above 100k, tomorrow we'll ABSOLUTELY hunt for long positions, as it'd form a classic V-pattern in the lower timeframes. Either way, we gotta be ready.
Interesting note: Dominance is climbing alongside Bitcoin's dump, which means shorts on altcoins could yield even sweeter profits going forward. USDT.D is closing above its daily resistance too—not a good sign for the market at all, and it supercharges our bearish scenario.
That's it... Now, after reading this, go do your own market analysis—far away from any FOMO. Grab a notebook, jot down every scenario, and map out your Plan A, B, C, D... And for the love of gains, don't forget capital management. Now get outta here.

BTC is going up BTC has the potential to rise from this its curent price of 98292
to 116551 , A key suport level to watch is at 92278. BINANCE:BTCUSDT

SPX Update📊 SPX Update
SP:SPX has broken below the blue support level 🔵
As long as it doesn’t move back above this level, it remains bearish 🔻
Structure shows continued weakness — watch for the next support zone.
BTC Update📊 CRYPTOCAP:BTC Update
Remember guys — BTC can still move toward the $92,000 area 💰
This level lines up with the CME gap that could be filled 🔄
Nothing guaranteed, but it remains a possible target if the trend continues 📈

DCR Update📊 DCR Update
DCR is testing the blue support zone 🔵
A break below this level is possible, which could signal further downside 🔻
Watch this zone closely — it’s a key level for the next move.

POL/USDT — Long Setup🟩 Entry Zone: 0.1653$ - 0.16400$
🎯 Targets:
1️⃣ 0.1710
2️⃣ 0.1810
3️⃣ 0.1900
4️⃣ 0.2100+
🔻 Stop-Loss: Below 0.150

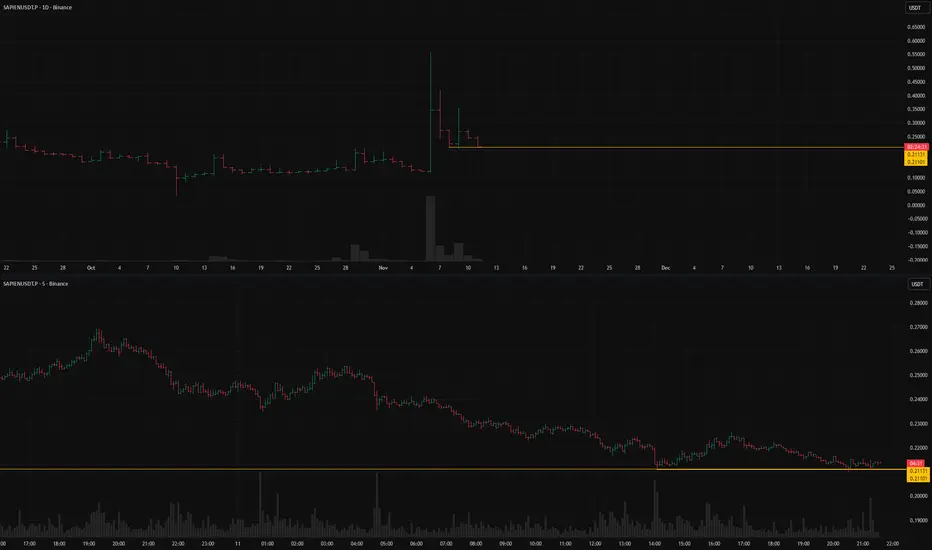
SAPIENUSDT.Pshort setup from daily support at 0.21101BINANCE:SAPIENUSDT.P is currently in a dump phase — a typical development after a strong pump.
The key level is 0.21131, which marked the previous drop’s stopping point.
This level has been confirmed multiple times, and the price is now approaching it gradually.
If low volatility persists and a valid entry point aligned with the trading system appears,
a short setup could be expected with potential continuation to the downside.
Key factors for this scenario:
Price void / low liquidity zone beyond level
Liquidity grab (false move against the trend)
Volatility contraction on approach
Immediate retest
Consolidation with price compression (squeeze)
Closing near the level
Closing near the bar's extreme
Was this analysis helpful? Leave your thoughts in the comments and follow to see more.
AERO Update📊 AERO Update
AERO has formed a double top pattern 🔴 and is now in a downtrend 🔻
It could drop about 8% more, possibly reaching the green line level 🟢
Trend remains weak, so stay cautious and watch for confirmation.

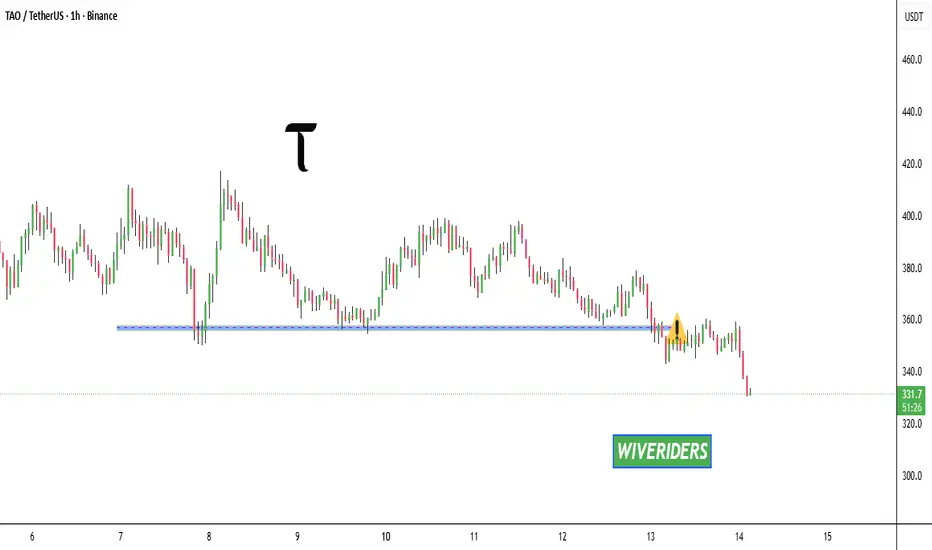
TAO Update📊 TAO Update
As we expected, TAO has broken below the blue support level 🔵
This confirms weakness in the structure and could signal a bearish move ahead 🔻
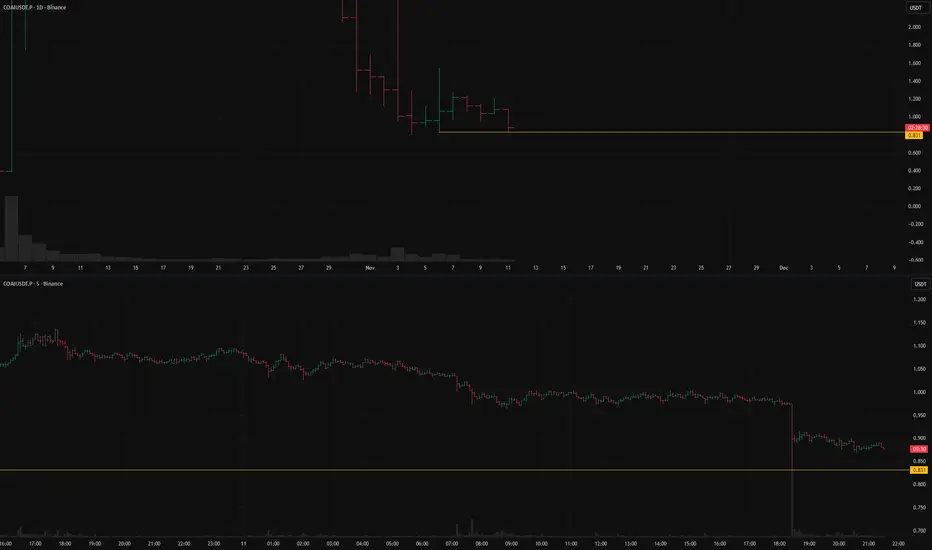
COAIUSDT.P: short setup from daily support at 0.831BINANCE:COAIUSDT.P is currently trading near its historical lows.
The setup looks ambiguous: on one hand, there are signals supporting a continuation of the short trend;
on the other, we might be seeing parabolic-style accumulation.
In any case, a local 5:1 move looks realistic in my view.
The chart stands out because on the lower timeframe, the price hit the support level almost to the tick,
a level formed a few days ago when the asset halted its drop and entered consolidation.
Such precise touches usually indicate a limit player positioned at the level —
and if that level gets broken, the asset could fall sharply.
I expect low volatility near the level,
and an additional confirmation would be a daily close below the current bar’s low or right at the level.
Key factors for this scenario:
Global & local trend alignment
Volatility contraction on approach
Price void / low liquidity zone beyond level
Momentum stall at the level
Immediate retest
No reaction after a false
Closing near the level
USDT.D(based on NEo wave)I think wave G is showing the pattern.
wave G might be a triangle or a diametric.
Im ready for both scenarios.
