LINEAUSDT plan 12-02-26LineaUSD plan 12-02-26
The price has pumped and there's a rejection in the supply area.
There, we can try setting a pending sell limit in the supply area.
Because it's not at the high end, we can adjust the order size to avoid excessive risk.
Cryptomarket

BLESSUSDT plan 12-02-26BlessUSD plan 12-02-26
The price has been pumped up into the supply area, but there has been no rejection. It continues to rise, forming a compression. In this situation, when the price enters the fresh supply area, it doesn't necessarily mean it will fall. It would be better to wait for a bearish engulfing to form in the supply area, with confirmation of a change in character on a lower timeframe.

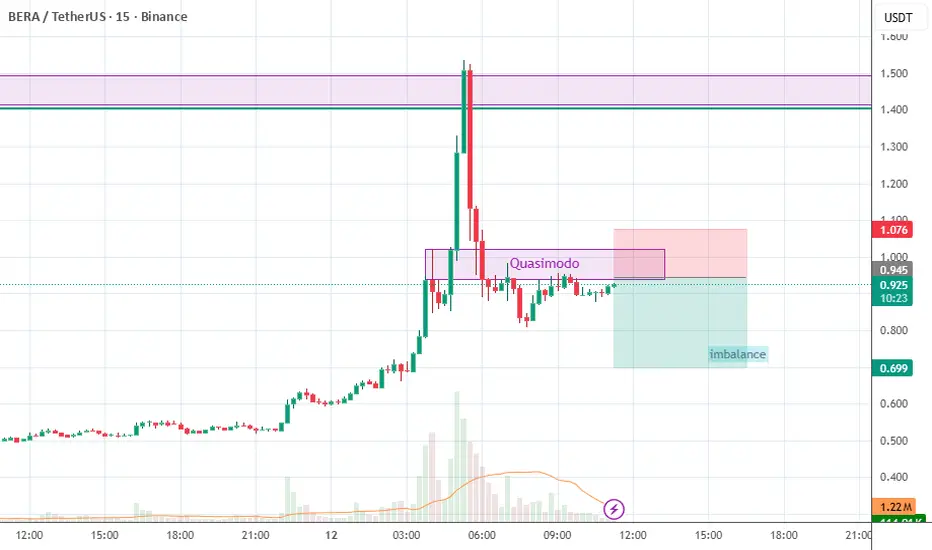
BERAUSDT plan 12-02-26BERAUSDT PLAN 12-02-26
Bera has rejected fresh supply on the high timeframe.
When we look at the 1-hour timeframe, we see a bearish engulfing. Then, we move down to the 30-minute timeframe and see a Quasimodo setup. We'll try setting a limit in that area, even though the head is too high.
LINK / USDT Reclaims Support — Bullish Move Towards $12 PossibleLINK / USDT has reclaimed its strong support zone after sweeping downside liquidity, indicating bullish strength. As long as price holds above the $8.47 – $8.43 area, a continuation towards the $12 level remains highly possible if overall market conditions stabilize. However, due to current BTC weakness, caution is advised—trade only with proper confirmation and consider taking profits at multiple targets. A breakdown below the support zone will invalidate this setup temporarily.


BTCUSD,ANALYSIS [READ CAPTION]WHAT YOU THINK ABOUT THIS ANALYSIS
Chart Overview (Technical Analysis)
Market Context
Price recently declined from the 69,000–71,000 region.
Current price appears around 66,700.
A marked support zone is highlighted between roughly 63,500 – 65,400.
A projected target is around 69,100.
🔎 Key Technical Observations
1️⃣ Support Zone
The highlighted area (~63.5k–65.4k) previously acted as consolidation.
If price revisits and holds this zone, it may confirm it as demand/support.
2️⃣ Potential Bounce Setup
The chart suggests a pullback into support followed by a bullish reaction.
W
Measured move targets point back toward ~69k (prior resistance area).
3️⃣ Risk Scenario
If price breaks and closes below ~63.5k with momentum, the bullish setup is invalidated.
That could open downside continuation.
4️⃣ Structure
Recent price action shows lower highs on the right side of the chart.
A higher low at support would be needed to shift short-term structure bullish.
📈 What Would Strengthen the Bullish Case?
Strong bullish candles off the support zone.
Increased volume on bounce.
Break and hold above 67.5k–68k resistance.

RIFUSDT 10-02-26RIFUSDT plan 10-02-26
The price has already touched the same supply area twice,
and the high and low are also higher.
To be on the safe side, we set a limit slightly above the area that has been touched.
It might be hit.

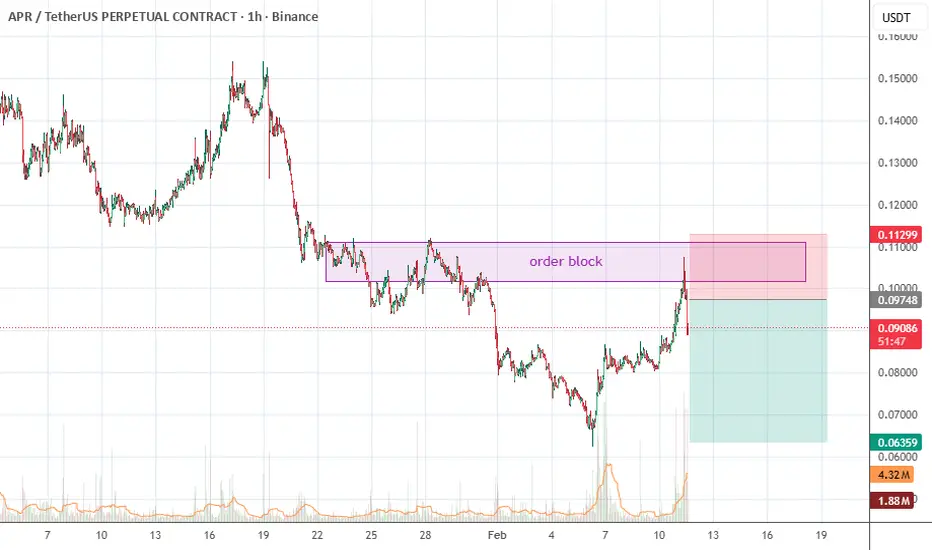
APRUSDT 11-02-26APRUSDT plan 11-02-26
APR price has touched the fresh supply area and has already rejected the order block area.
We'll try a retracement finger on a smaller timeframe to look for a re-entry.
It might trigger.
AllOUSDT 11-02-26ALLOUSDT plan 11-02-26
See, the price has been rejected in the fresh supply area at the flip area, and it looks like it's about to trigger a bearish engulfing.
Let's move down to the 1H timeframe to look for a QM setup and set a sell limit in the QM liquidity area.

BTCUSDT Intraday Short — Contextual ExpectationWithin the framework of last week’s established initial balance, the broader daily dynamics remain constructive.
However, on a local scale, signs of upside exhaustion are starting to appear.
The current context is defined by:
-a local market buyer block
-presence of minor liquidation activity
-temporary weakness in acceptance above current levels
As long as these factors remain unchanged, the near-term bias stays short-oriented.
Zone of interest for short setup:
69,800 – 70,400
Targets:
-67,300 — first target
-66,300 — second target
Idea invalidation:
Acceptance and consolidation above 72,300.
All decisions should be made according to your own trading system and risk management rules.

YALAUSDT 10-02-26It looks like the price is bearish, but the price just touched the order block in the flip area, creating a candle reversal pattern. Let's try setting a sell limit, just in case it triggers.
YShort

Bitcoin: “Buy-the-Dip” ??📌 Macro Context First (Why Bitcoin Has Been Under Pressure)
Recent macro data paints a very specific environment:
- Growth is slowing, especially in labor and consumption
(weak ADP, soft retail sales, falling job openings)
- Inflation is cooling, but not fast enough to unlock rate cuts
(sticky services prices, elevated ISM Prices)
- Central banks are frozen, not easing
(Fed, ECB, BoE all data-dependent with no urgency to cut)
This combination creates a liquidity-neutral to liquidity-tight backdrop, which is historically not friendly for speculative assets like crypto. That explains why Bitcoin has been sold aggressively rather than treated as a hedge.
In this environment, BTC doesn't act like "Digital Gold", it acts like Liquidity Insurance. When the system feels tight, participants sell their most liquid winner (BTC) to cover their losers.
📌 The Macro Fork in the Road for Bitcoin
From here, Bitcoin’s outlook hinges on which macro force breaks first: growth or inflation.
Scenario A:
Growth Weakens Faster Than Inflation (Constructive for BTC)
This is the only credible bullish macro case for a buy-the-dip.
What this would look like in the data:
- Continued weakness in jobs (low NFP, rising unemployment claims)
- Flat or negative consumer spending
- Inflation does not re-accelerate, even if it cools slowly
- Bond yields stabilize or drift lower (especially real yields)
Macro logic:
Markets begin to price future policy relief, even if cuts are months away. Liquidity expectations improve at the margin, and Bitcoin tends to front-run that shift before equities.
In this environment:
- Bitcoin behaves less like a risk asset and more like liquidity insurance
- Sharp selloffs can become position-clearing events, not trend breaks
- Dips into major demand zones can attract macro-driven buyers
- This is the only environment where “buy the dip” is justified.
Scenario B:
Inflation Stays Sticky While Growth Slows (Negative for BTC)
This is the more dangerous outcome, and it cannot be ignored.
What confirms this path:
- CPI surprises higher (especially core)
- Wage growth stalls but prices don’t fall
- Yields push higher despite weak growth
- Dollar finds renewed strength
Macro logic:
This is a stagflation-like setup. Central banks stay restrictive, liquidity remains tight, and speculative assets are forced to deleverage further.
In this scenario:
- Bitcoin remains correlated with risk assets
- Rallies are sold, not accumulated
- “Buying the dip” becomes catching a falling macro knife
📌 Where We Are Right Now
Based on the data:
- Growth is weakening ✔️
- Inflation is cooling ✔️
- But not decisively enough yet ❌
- Policy makers are not signaling urgency ❌
That places the market between these two outcomes, with no clear macro green light yet for aggressive Bitcoin longs.
This is not a high-confidence buy-the-dip moment.
📌 What Would Turn This Into a Real Opportunity?
For a macro-supported Bitcoin bounce, at least two of the following must occur:
- Labor data deteriorates further
(weak NFP + rising unemployment claims)
- CPI confirms disinflation
(especially core not accelerating)
- Bond yields stop rising
(real yields stabilize or fall)
- USD fails to extend higher
(no renewed dollar dominance)
If these conditions align, Bitcoin can rally even without rate cuts, driven by expectations, not policy actions.
📌 Practical Takeaway (Macro-Only)
- Bitcoin is not broken, but it is not supported yet
- A bounce is possible, but only as a conditional trade
- The macro backdrop demands confirmation, not anticipation
📌 The Honest Conclusion
Right now:
- Real yield pressure is easing
- BTC has room to base
- A tactical dip buy is macro-consistent if upcoming news lines up
But:
- This is not a new cycle signal
- This is relief from tightening, not expansion
Think:
“Less bad is not yet good, but it’s tradable.”


BTC Breakout Incoming?On the weekly timeframe, Bitcoin is approaching a critical decision zone that could define the next major move. Current structure still supports a broader downtrend, with a potential short-term reversal into the LVN acting as a relief move before continuation lower toward a strong support region below. That said, this area also presents a high-impact inflection point. A decisive high breakout and reclaim of previous range highs would invalidate the bearish continuation and open the door for a momentum-driven move back toward all-time highs. This chart outlines both scenarios, with key levels marked to let price confirm direction rather than forcing bias.

BTCUSD: 70K base breakout toward 80K🛠 Technical Analysis: On the H4 timeframe, BTCUSD remains in a broader bearish structure, but price is now stabilizing around the psychological 70,000 area. The chart shows consolidation in a tight range, suggesting sellers may be losing momentum after the sharp selloff. This 70K “fixation” acts as a short-term bullish factor, and the market is now building a base for a potential corrective rebound. The key trigger is a confirmed breakout above the upper consolidation boundary near 72,500–72,875, which would signal strength and open a move toward the next supply zone around 80,000–81,519. Keep in mind that the SMA 50/100/200 are still overhead, so this setup is treated as a recovery leg within a bearish trend. If price fails to hold the base and breaks below the local invalidation level, the probability of a deeper drop toward the next demand zone increases.
———————————————
❗️ Trade Parameters (BUY)
———————————————
➡️ Entry Point: 72,875.91 (buy on a confirmed breakout above 72,500)
🎯 Take Profit: 81,518.97
🔴 Stop Loss: 67,160.33
⚠️ Disclaimer: This is a potential trade idea based on current analysis; market conditions and price direction are subject to change based on news factors and volatility.

TradeCity Pro | XRP Compresses Before a Decisive Move👋 Welcome to TradeCity Pro!
In this analysis, I’m going to take a look at XRP, one of the oldest crypto projects, currently ranked #4 on CoinMarketCap with a market capitalization of $86 billion.
⌛️ 4-Hour Timeframe
On the 4-hour chart, this coin is in a downtrend. In its latest bearish leg, price moved down to 1.2113 and is currently in a corrective phase.
✔️ A compression range has formed between 1.3926 and 1.4565, and a breakout from this zone would be a strong trigger for opening a position.
✨ Since the overall trend is bearish, a break below 1.3926 is a much better trigger for entries. Breaking this level could start a move back toward 1.2113.
🎲 A clean break of 1.2113 itself would be an excellent trigger for the start of the main bearish wave. The major move is expected to happen after this level breaks.
⚡️ On the other hand, a break above 1.4565 can be considered a risky long trigger, and breaking it would give us the first bullish confirmation.
💥 The next and more reliable long trigger is 1.5175. A breakout above this level could push the price toward 1.6698.
❌ Disclaimer ❌
Trading futures is highly risky and dangerous. If you're not an expert, these triggers may not be suitable for you. You should first learn risk and capital management. You can also use the educational content from this channel.
Finally, these triggers reflect my personal opinions on price action, and the market may move completely against this analysis. So, do your own research before opening any position.

Bitcoin Long Term future. Cycle and Projections Just changed.
One of the things I do is to project into the future as much as possible, to spot continuing Trends and patterns.
By Projecting, we are able to ascertain if a trend is continuing or not, as happened with the 2013 to 2017 Fractal that I placed on Current BTC PA in October 2022
Anyone that followed this with me was able to expect certain moves until Feb 2025, when PA fell off that Fractel. Patterns work until they do not.
We knew then that things had changed.
The main chart today, is another Chart I have been using and posting for a while.
It is one that may seem a bit "out there" but, so far, it is being proved accurate in many ways.
Lets look at the bigger picture.
This is the entire Bitcoin PA
The things to see here are simply the Ascending line of Support that BTC PA has been above since March 2013
And the Blue Arc, that is a part of the Larger Fibonacci Spiral ( dashed Arc ). As you can see, This Arc has rejected EVERY BITCOIN ATH, until now.
The Blue Arc and the spiral appear to seperate and this is due to allowing a Tolerance for Error in my calculations.
On the chart above, we see a little more detail. We also see that it was Very Important for Bitcoin to break ABOVE this spiral or be pushed back under. Should PA remain below this Arc / Spiral, PA has gone past its ATH and will never reach higher.
I think few people realised just how much of a battle took place in 2025.
Bulls managed to push PA Over that spiral, allowing for the potential for a further rise higher.
On the dashed Version, PA even came back down and tested it as support.....and bounced.
But PA got exhausted doing so and so, as we see, PA got rejected.
But what is Most important to see here is how we have also dropped Below that LongTerm line of support.
That is now HUGE resistance.
Should PA remain below this line, This could create a new cycle type and pattern.
This is actualy BULLISH. We are now Below an ever rising line of Strong resistance....But it will always RISE> It is NOT an Arc like we have been under since 2013, that rose higher but was always going to start dropping at some point.
This will also prevent parabolic rises that led for 80% drops after ATH.
That is all OK
The Problem we have right now is that PA is also below Both Projections of that ARC, Spiral.
BITCOIN has a huge battle ahead.
It is Over Sold on longer time frames, giving it some strength
Currently, to rise over the dashed Arc, This could happen soon
Then it will face that Rising line of Resistance..and then, the Blue Arc.
This sequence will stay the same untill Q4 2026, when the Blue Arc drops below that Line of resistance.
PA often targets intersections of resistance to try and break through....So..This could be one to Watch.
Some projection point towards a Push to a lower High in early 2026, then retrace and a harder push / end of Bear in Q4, so this may have confluence.
And the price range that will show a level of safety ?
Once we pass and hold around 138k -142K usd
And THAT is the beauty of PROJECTONS.....TIME ALWAYS TELLS>...............
BTW, I welcome your comments on this......

Bullish Trend Resumption,Breakout Above Key Resistance in focusM/USDT is continuing its newly formed bullish trend and has already shown strength by pushing above local horizontal resistance.
However, we are looking for a clean and confirmed breakout above $1.5652 to secure a safer entry.
If price breaks and holds above this level with strong confirmation, the next upside target is $1.8149.
For now, patience is key — wait for confirmation and manage risk wisely.

PARTI/USDT – Strong Uptrend|Key Support & Breakout Zone in FocusPARTI is moving in a very healthy manner and remains in a clear uptrend. Price is currently consolidating below resistance. A strong breakout above the upper resistance can trigger a solid bullish rally.
Key zones to watch: $0.10106 – $0.09482
If price takes support from these levels with strong confirmation, it will attempt to break the upper resistance.
However, a breakdown below $0.09482 may lead to a retest of the lower support zone.
Trade with confirmation. Patience pays. 📈

TradeCityPro | Bitcoin Daily Analysis #264👋 Welcome to TradeCity Pro!
Let’s move on to Bitcoin analysis. The market is still trading inside a ranging box.
⌛️ 1-Hour Timeframe
Yesterday, Bitcoin formed a support level around 68,586.
✨ After reacting to this area, price printed a lower high, and it has now returned to test the support again.
✔️ At the moment, Bitcoin is reacting to the 68,586 zone. If this level breaks, price could resume its bearish move, and we can look to open a short position.
🔔 The main trigger for Bitcoin right now is the break of 67,735. A break of this level would also be a valid short entry. So, 68,586 is a riskier trigger, while 67,735 is the more reliable one.
🔍 Since price has formed a lower high, the probability of breaking 67,735 is higher. However, if price moves up toward 71,616, we can also look for a long position on a breakout. That said, it’s better to wait for volume confirmation on long trades, as the dominant trend is still bearish.
🎲 Today, the market could offer both short and long opportunities, so stay alert and don’t miss the setups.
❌ Disclaimer ❌
Trading futures is highly risky and dangerous. If you're not an expert, these triggers may not be suitable for you. You should first learn risk and capital management. You can also use the educational content from this channel.
Finally, these triggers reflect my personal opinions on price action, and the market may move completely against this analysis. So, do your own research before opening any position.

#HYPEUSDT Rally Is a Trap — Are You Buying or Selling?
Yello Paradisers! - Are you aware that #HYPEUSDT is now trading at a level where Elliott Wave structure strongly favors a high-probability reversal rather than continuation?
💎#HYPE is clearly developing a running flat correction following a strong impulsive move to the downside. This corrective structure has been unfolding for nearly four months, which classifies it as a major time correction. Such extended corrections typically serve the purpose of rebalancing sentiment and positioning before the dominant trend resumes.
💎Importantly, during this corrective phase, the market has successfully taken out a key liquidity zone, a common characteristic of running flats where wave B exceeds the origin of wave A. Price is now interacting with the upper boundary of the corrective Running flat structure, what further strengthens this bearish continuation scenario is the presence of hidden bearish divergence on the RSI, forming precisely at the tops of the running flat.
💎While an alternative scenario could involve a transition into an expanding flat, this outcome currently carries low probability. The structure shows limited price space for further expansion, and wave proportions are already approaching their typical extension limits.
💎From a level-based wave validation standpoint, the $60 region represents a critical resistance, coinciding with the origin of the prior impulsive decline and the invalidation zone for the primary bearish count. Failure to reclaim and hold above this level would further confirm corrective exhaustion.
💎On the downside, $21 may provide temporary reaction support, but it lacks structural significance. The true higher-timeframe support is located near $9, which aligns with projected wave targets and remains achievable over time within the current Elliott Wave framework.
This is precisely why disciplined Paradisers wait for structure confirmation rather than chasing price. Corrections exist to mislead the majority before the next impulsive move unfolds. Strive for consistency, not excitement. Execute based on structure, probability, and patience. This is the only way to survive and thrive long-term as a professional in the crypto markets.
MyCryptoParadise
iFeel the success🌴

This Is the Bitcoin Situation for the Next 3 YearsThis is the Bitcoin Situation for the Next 3 Years
Since last August I warned that the $108,000 level could not be lost in Bitcoin or else we entered a bearish cycle and it was going to be hard.
I am not a guru nor do I have a crystal ball.
But I try to get informed and I dedicate a lot of time to understanding what a Halving is. I understand mining costs. I understand staking. I understand leverage.
But above all we need to understand how all this leads us to CYCLES.
This chart is very powerful for understanding Bitcoin.
Each line is a cycle since its Halving. This event happens every 4 years.
The first cycle (the blue one) made the high somewhat earlier but the following cycles have made their highs at the same moment. All the lows have happened one year after reaching this high.
This last cycle (the strong yellow one) looks smaller and this is not a coincidence. Notice that each cycle is smaller than the previous one.
And this makes sense.
Bitcoin cycles are INFLATIONARY AND LOGARITHMIC.
Inflationary and logarithmic?
This is vital. Let me translate it for you.
Bitcoin should follow inflation because it is a finite asset like gold or real estate in certain areas.
Easy but logarithmic ?
This is something you can't IGNORE anymore.
🤔 Bitcoin cycles go up less every time.
One reason is that the more an asset capitalizes the more it costs to keep it going up. Money in the world is finite and therefore when something capitalizes billions it starts to be complicated to make it grow in a faster rate than inflation.
But you must also know that in the Halvings the rewards to miners are reduced.
At the beginning this meant a beastly reduction of many BTCs which drove the price very high. But now the reward is barely reduced by 3 or 1 BTC so the price cannot rise at the same pace.
If we pay attention to previous cycles Bitcoin will keep falling in 2026 until the end of the year before starting a recovery. This is the most likely scenario right now.
So much for Bitcoin theory so let us go to the practical part.
🚀 Where will this low happen?
I do not know and nobody knows but we have clues.
In each of the cycles we have seen the price retreat from highs.
And a lot.
The first cycle down 85%
The second down 80%
The third down 75%
And now?
Maybe 70%? It could be. It is just an approximation .
This last drop to $60,000 is already a great milestone as the price has corrected 50% but in previous cycles we see that the best is still to come. It can fall another 50% down to $30k or $40k to meet the levels close to 70% correction which would seem plausible based on previous behavior.
In terms of price it seems there is a gap to fill and in terms of time it is even better.
Correction time of first cycle is 12 months
Correction time of second cycle is 12 months
Correction time of third cycle is 12 months
If this fourth cycle lasts the same as the previous ones we will be talking about seeing the moment of maximum pain in October 2026.
That is the moment where we will all say that BTC is going to 0.
Who knows.
But, if we start accumulating in the $60k zone and save some money for the $30-40k area, we could easily average a $50k position during 2026.
After three years we should be at the next cycle peak which following a logarithmic progression could be somewhat higher than these last $120k (current cycle peak).
Let us assume $150k. (Which is a number I get from the serie of previous rallies, but there is too much math for today)
We are talking about selling the investment for triple the price in 3 years. That is a return that is not bad at all.
The risk is total. I go without a Stop Loss. It is aspirational investment and in no case is it capital protection.
And while we wait for the price to reach the right zone to keep buying, you could also make a quick trade to catch the next 10% rally.
👇 WANT MORE?
🚀 Hit the rocket, read my profile and follow so we can find each other again.

XAUUSD Range Breakout from Trendline Support – Demand Zone in FoGold is respecting a clean ascending trendline while ranging inside a well-defined consolidation box. After a sharp fake breakdown below the trendline, price quickly reclaimed the structure — a classic liquidity sweep and breakout scenario.
Now price is compressing near the upper boundary of the range while holding above trendline support, showing strength from buyers. The highlighted demand zone around 5080 is the key area to watch. A sustained move above the range high can trigger bullish continuation toward 5100–5120.
Key Points:
• Ascending trendline acting as dynamic support
• Liquidity sweep below structure followed by strong recovery
• Range consolidation before potential expansion
• Demand zone providing strong base for buyers
• Breakout setup forming for bullish continuation
Plan:
Wait for a clean breakout and retest above the range for safer long confirmation.
Patience inside ranges often leads to the best breakout trades.
