Why Bitcoin’s 4-Year Cycle Might Be Its Biggest LimitationFor years, traders have treated Bitcoin’s 4-year halving as sacred — a mechanical driver of boom and bust. But what if the real reason these cycles repeat isn’t the code… but the crowd?
Mechanically, Bitcoin’s issuance schedule is a smooth, predictable decline. The halving simply adjusts the slope of supply — it doesn’t dictate price. Yet, like clockwork, markets rise and fall every four years. Why?
Because we expect them to.
This expectation creates a self-fulfilling feedback loop:
- Pre-halving optimism fuels accumulation and speculative positioning.
- Post-halving euphoria drives parabolic rallies as new participants flood in.
- Overvaluation and leverage eventually unwind, triggering brutal corrections.
The halving became the metronome of market psychology — a narrative so powerful that it shaped behavior more than fundamentals ever did.
🧠 The Institutional Shift
Now, that narrative is being rewritten.
Institutions don’t trade on memes or cycles — they trade on models, liquidity, and risk.
Unlike retail investors, institutions hate volatility. They don’t chase euphoria; they manage exposure.
- ETFs and funds accumulate steadily through structured inflows.
- Option and futures desks hedge risk dynamically, suppressing volatility.
- Algorithmic allocators rebalance based on Sharpe ratios, not halving hype.
This structural participation acts as a volatility dampener — flattening the amplitude of Bitcoin’s historic boom-bust waves.
🌍 From “Halving Cycle” to “Liquidity Cycle”
As Bitcoin matures, the real driver of its price action is shifting away from internal events and toward macro liquidity conditions :
- When global liquidity expands (rate cuts, QE, easing credit), Bitcoin thrives.
- When liquidity contracts (rate hikes, QT, risk-off sentiment), Bitcoin cools.
In this new phase, the halving’s scarcity still matters — but it’s no longer the heartbeat.
Instead, Bitcoin is syncing to the rhythm of global capital flows.
📈 The New Market Identity
We’re watching Bitcoin transition from a reflexive narrative asset to a macro-integrated store of value .
If this continues, the implications are profound:
- Shallower drawdowns and fewer liquidation cascades.
- More consistent accumulation across cycles.
- Higher institutional allocation as volatility compresses.
Ironically, the same psychological loop that once fueled Bitcoin’s meteoric rise may now be what caps its potential.
The halving didn’t make Bitcoin cyclical — investor behavior did .
And as smart money takes over, that feedback loop may finally be breaking.
🚀 What This Might Mean for Future Bull Runs
If institutions continue to dominate Bitcoin’s liquidity, the next bull runs may look less like fireworks and more like steady expansion — smoother, slower, but more sustainable.
Instead of 12-month parabolas followed by multi-year winters, we could see:
- Extended accumulation phases where price grinds higher over longer horizons.
- More efficient corrections that reset leverage without catastrophic selloffs.
- Reduced retail blow-off tops as narrative-based speculation loses power.
That doesn’t mean the explosive upside is gone — it means the path to higher valuations might look more like a compound growth curve than a recurring bubble.
The next phase of Bitcoin’s evolution isn’t about chasing the halving — it’s about understanding liquidity, positioning, and psychology on a global scale.
- The crowd traded Bitcoin like a story.
- Institutions are turning it into a system.
Cryptomarket

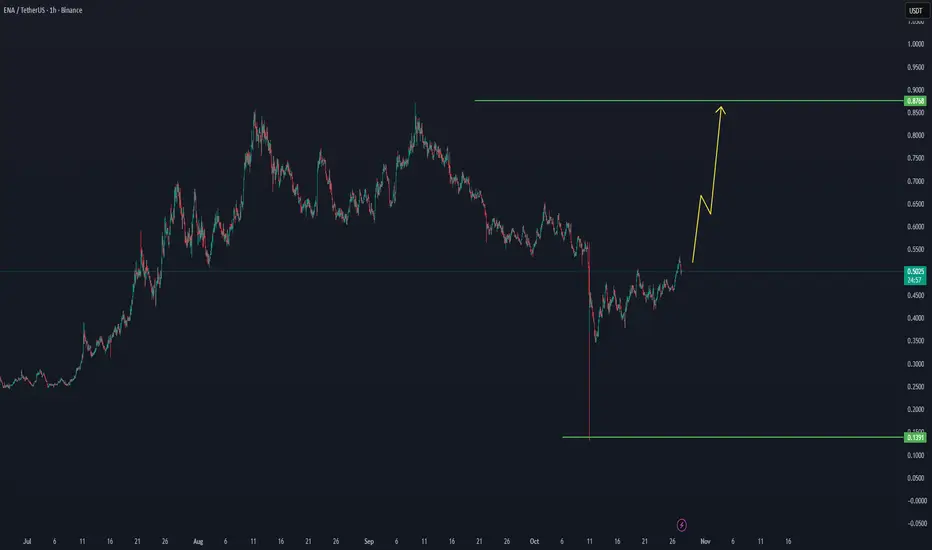
ENA/USDT — Recovery Setup Toward $0.87 in ProgressNA/USDT — Recovery Setup Toward $0.87 in Progress 🚀
ENA has shown a strong rebound from its major support zone, confirming a short-term bottom formation after the recent deep correction.
Price structure now indicates a shift from accumulation to expansion, with early signs of buyer momentum building up on the lower timeframes.
🔍 Technical Outlook:
Support Zone: $0.13 – $0.15 (strong base level)
Current Price: ~$0.50
Resistance / Target: $0.87
Pattern: Early stage of a potential impulse wave recovery
Volume: Gradually increasing, signaling renewed interest
📈 Scenario Expectation:
If ENA continues holding above the $0.45–$0.50 range, the next move could extend toward $0.65, followed by a possible breakout to $0.87, aligning with the previous major resistance zone.
A break above $0.87 would confirm a full trend reversal and open the path toward new cycle highs.
⚠️ Risk Zone:
Failure to hold above $0.45 may trigger a retest of the lower accumulation area around $0.30–$0.35 before another potential leg up.
BTC/USDT — New Volume Entry Zone Forming - 117KBTC/USDT — New Volume Entry Zone Forming 💥
Bitcoin is stabilizing above the pre-cycle range and building new volume around the $115K zone.
This could mark the next accumulation area before continuation if support holds here.
📊 Key Range: $115K–$116K
📈 Focus: Maintaining this new volume base for further upside to 117K

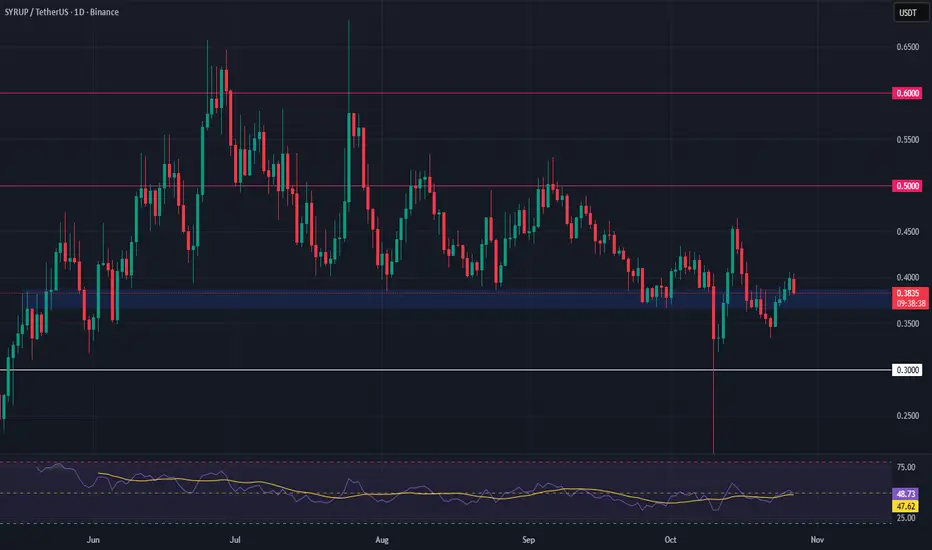
SYRUP | Long Swing Setup from Key Support ZoneSYRUP is currently trading at a major support area, offering a potential swing trade opportunity for those watching closely. Price has consolidated here before and shown bullish reactions, making it a technically sound zone to monitor for entries.
💡 Trade Plan:
Entry Zone: $0.3670 – $0.3870
Targets: $0.50 / $0.60
Stop Loss: $0.30
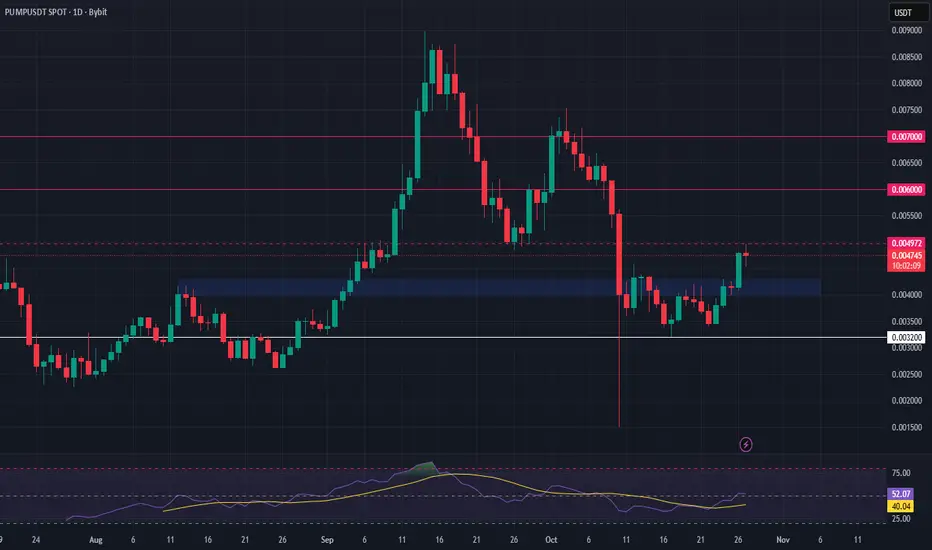
PUMPUSDT – Long Setup at Key Support ZonePUMP is retesting resistance while pulling back into a critical support zone, offering a potential spot long opportunity for those monitoring the range. The price action is forming a confluence area that could act as a base for the next upward move.
📍 Entry Zone: $0.0040 – $0.0043
🎯 Take Profit Targets:
• TP1: $0.0060
• TP2: $0.0070
🛑 Stop Loss: $0.0032
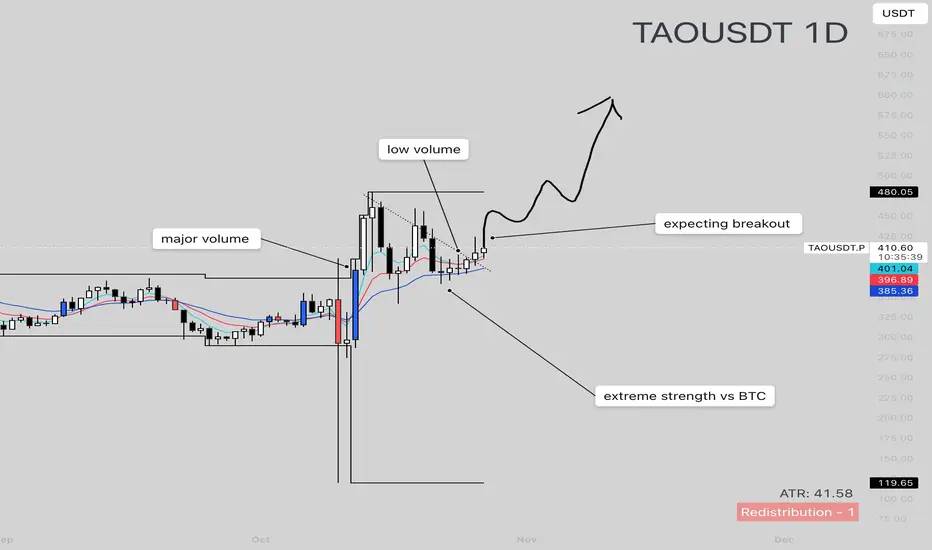
TAOUSDT — Strongest Chart in the Market Right Now?TAO just printed one of the cleanest volume–structure combinations we’ve seen this cycle. After a massive surge in buying volume, price entered a tight, low-volume contraction phase — exactly what you want to see before a breakout.
While Bitcoin broke below every major moving average, TAO has held all three — the 5, 10, and 20 MA — perfectly intact. That kind of relative strength is rare and usually signals institutional accumulation beneath the surface. Each pullback has been shallow, controlled, and met with buyers stepping in around the EMAs.
This current structure looks like absorption before expansion. If BTC begins to move higher, TAO could be one of the first to react — potentially exploding through the $480 breakout level and entering a new price discovery leg. The pattern resembles early-stage setups we’ve seen in Zcash and other strong outperformers before major runs.
There’s clear evidence of major volume commitment, followed by quiet, patient absorption — the classic smart-money footprint.
Could this be the calm before the breakout everyone misses?
Are institutions quietly positioning before the next wave?
When the move comes… will you be ready?
SOLANA - SHORT - THE WICK AND THE WHISPERTraders,
This is how I see SOL.
1. The level I care about
For me the key area is 205 to 207. Call it VAH, call it range high, call it supply. It is the place where price got stuffed before and where a lot of trapped memory lives.
What I expect is simple.
Wick it. Slip it. Fade it.
In other words I am looking for SOL to run into that 205 to 207 pocket, spike through it, clean the liquidity resting above those highs, and then fail to hold. That failure after the wick is the trigger for me. That is where I want to be heavy.
If SOL trades above that range high and then instantly falls back inside, that is a swing fail pattern at the high of the range. That is the same story I am hunting on BTC at 117.5k. Liquidity first, conviction second.
2. The downside path
If the wick and slip happens, my downside path is not small. My next meaningful target sits all the way down at 150 to 155. That zone is not just a guess.
It is where the last real demand block sat before we impulsed higher.
It is also where liquidity was never fully re balanced after the violent breakout.
Call it unfinished business. Call it imbalance that still needs to close.
The market eventually comes back to drink from the well it skipped.
3. Now we look under the hood
Price has pushed up into 200 again, yes. But the flow behind the move tells a different story than the candles.
Spot CVD
Spot CVD is bleeding down hard. Real buyers paying cash are not supporting this move. Spot is distributing into strength, not accumulating under it.
Stablecoin margined CVD
Stablecoin perp flow is also down. That means most of the USDT perp side is either taking profit into this move or outright selling into it. They are not chasing it. They are leaning against it.
Coin margined CVD
This is the biggest one. Coin margined CVD is aggressively down. That tells me coin collateral traders are smashing into the bid, basically leaning short into this push.
So ask yourself. If spot is selling, and perp flow is selling, and coin margined flow is selling, then why is SOL still pressing up
4. Open Interest is the answer
Stablecoin OI is grinding up.
Coin margined OI is going vertical.
That means positions are being added at the top, not closed. New size is entering into this level.
When coin margined OI spikes like that while coin margined CVD is negative, the usual read is this. People are opening fresh short exposure using SOL itself as collateral, hitting the bid all the way up, and still not getting the breakdown.
They are trying to fade the move. The move refuses to die. That is short fuel.
This is why SOL can still squeeze into 205 to 207. Shorts are stepping in early, and if you squeeze them one more time you get the wick.
But here is the catch. After the wick and slip, once that last round of shorts is blown and once fresh late longs FOMO in above VAH, there is nothing under price.
Spot buyers did not build a floor.
Perps did not build a floor.
The whole thing is hollow.
That is how you get air pockets.
5. How I am trading this
I am not here to wave a bull flag or scream bear. I am not interested in labels.
I am here to execute around the level.
My plan is to stalk shorts on a failed breakout of that 205 to 207 key. I do not need to nail the exact top tick. I want to see the wick into VAH, and then the rejection back inside the range. That is my trigger to build size.
Will I hold it all the way to 150 No blind loyalty. But that is where I believe the next true re balance sits, and that is the map I am working with.
If SOL breaks through 207, accepts above, and starts building structure above VAH, then this idea is invalid. I step aside. No ego. Survival first.
6. Summary
SOL is approaching a thin ceiling where liquidity sits. I believe we get a final run of that high near 205 to 207, a wick and slip, and then rotation lower. The flow supports that view.
Spot is not bidding.
Perps are selling into the move.
Open Interest is exploding at the highs.
That is the recipe for a squeeze candle into resistance, followed by a rug.
My destination if this plays out is 150 to 155, the next pool of imbalance where the market still owes a visit.
The chart is loud, but the flow is louder.
The candles brag.
The data whispers.
I listen to the whisper.

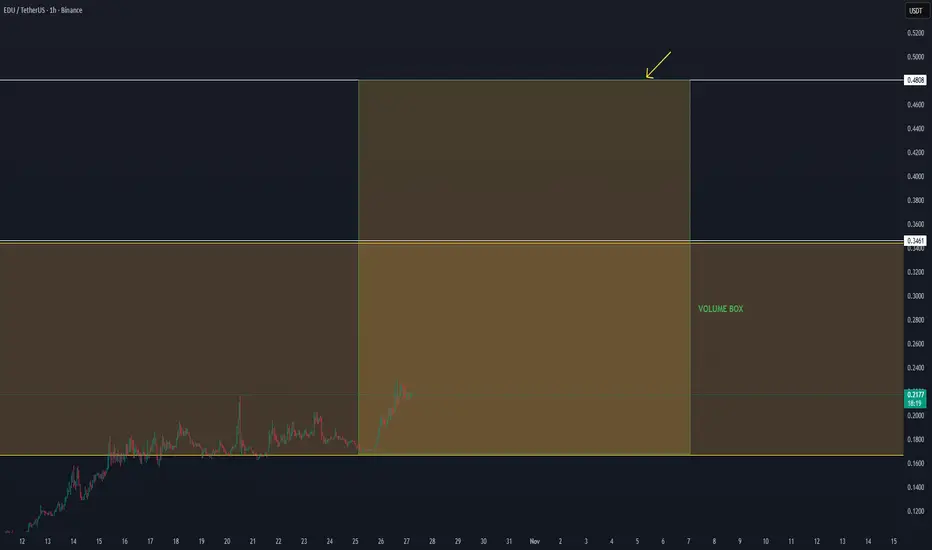
EDU/USDT – Volume Expansion Setup🔹 EDU/USDT – Volume Expansion Setup
EDU continues to show strong structure after the last move up, holding steady inside the volume box. The pair is building momentum with consistent volume increase on the lower time frames, showing clear accumulation signals.
If the current structure remains stable, EDU can continue this short-term uptrend and target the next resistance zone around $0.48, where the main reaction level is expected.
We follow the data and volume development closely — as long as the price stays supported inside the box, the momentum remains valid for a potential breakout continuation toward the upper range.
AAVE/USDT – New Volume Box Activation🔹 AAVE/USDT – New Volume Box Activation
AAVE is forming a new volume box structure between $203 – $385, showing renewed momentum after the last low recovery. Price is currently stabilizing around the lower range with growing volume, suggesting early accumulation activity.
As long as AAVE holds above the $200 support zone, we follow for a possible continuation inside this box. The first target for structure development sits around $322, followed by $385 as the main breakout resistance level.
The setup remains active as long as the current momentum and volume stay consistent — confirmation on lower time frames will define the strength of the next move.

Cookie 1H analysisCookie can provide good move on upside.
You can buy it on 1H closing above blue line.
Expected targets are given on chart.
DYOR NFA

MAKE or BREAK for Ethereum: New ATH or Epic SHAKEOUT?This week is shaping up to be ABSOLUTELY CRUCIAL for ETHEREUM!
Low Exchange RESERVES are still drawing in investors like moths to a flame. But hold on—something feels OFF the table here.
The news is glaringly OBVIOUS to everyone: rate cuts, QE, trade deals, and all those technical factors screaming "bull run ahead." But in crypto, when EVERYONE knows something, it rarely plays out as expected. Contrarian vibes, anyone?
My gut is screaming: This will be a VOLATILE WEEK , and a SHAKEOUT is essential for a rock-solid BULL RUN in Ethereum during this cycle. Without it, hitting a new ALL-TIME HIGH could feel flimsy, leading to a HISTORICAL DUMP right after the hype fades.
Pro tip: Keep EXTRA MARGINS in your account to dodge those sneaky WHALE TRAPS.
Follow and like if this analysis fired you up! 🚀📉

Long on EthereumWe are currently above the 50 EMA and 200 EMA.
Breaking out of the giant ascending triangle with a retest.
This could be a 4/5x from here with a top target of approximately $20,000 per ETH.
I’ll be long Ethereum until we hit or get close to the price action trendline.

SOLUSD | Approaching Major Resistance LevelSOL/USD is rising towards the sell entry, which is an overlap resistance and could reverse from this level to the downside.
Sell entry is at 198.22, which is an overlap resistance.
Stop loss is at 206.24, which is a swing high resistance that aligns with the 138.2% Fibonacci extension.
Take profit is at 187.02, which is an overlap support.
Stratos Markets Limited (tradu.com ):
CFDs are complex instruments and come with a high risk of losing money rapidly due to leverage. 68% of retail investor accounts lose money when trading CFDs with this provider. You should consider whether you understand how CFDs work and whether you can afford to take the high risk of losing your money.
Stratos Europe Ltd (thttps://tradu.com/eu ):
CFDs are complex instruments and come with a high risk of losing money rapidly due to leverage. 70% of retail investor accounts lose money when trading CFDs with this provider. You should consider whether you understand how CFDs work and whether you can afford to take the high risk of losing your money.

DOGEUSD | Bullish Bounce Off SupportThe price has bounced off the buy entry, which is a pullback support, and oculd rise from this level to he take profit.
Buy entry is at 0.19401, which is a pullback support.
Stop loss is at 0.18966, which is a pullback support.
Take profit is at 0.20603, which is an overlap resistance.
Stratos Markets Limited (tradu.com ):
CFDs are complex instruments and come with a high risk of losing money rapidly due to leverage. 68% of retail investor accounts lose money when trading CFDs with this provider. You should consider whether you understand how CFDs work and whether you can afford to take the high risk of losing your money.
Stratos Europe Ltd (tradu.com ):
CFDs are complex instruments and come with a high risk of losing money rapidly due to leverage. 70% of retail investor accounts lose money when trading CFDs with this provider. You should consider whether you understand how CFDs work and whether you can afford to take the high risk of losing your money.

EOS/USD | Bullish Momentum Building After BounceEOS/USD has bounced off the buy entry and could rise from this level to the upside.
Buy entry is at 0.2748, which is a pullback support.
Stop loss is at 0.2703, which is a pullbakc support.
Take profit is at 0.2908, which is an overlap resistance that is slightly below thhe 61.8% Fibonacci retracement.
Stratos Markets Limited (tradu.com ):
CFDs are complex instruments and come with a high risk of losing money rapidly due to leverage. 68% of retail investor accounts lose money when trading CFDs with this provider. You should consider whether you understand how CFDs work and whether you can afford to take the high risk of losing your money.
Stratos Europe Ltd (tradu.com ):
CFDs are complex instruments and come with a high risk of losing money rapidly due to leverage. 70% of retail investor accounts lose money when trading CFDs with this provider. You should consider whether you understand how CFDs work and whether you can afford to take the high risk of losing your money.

Ethereum's decision timeMy stance of course is I am embarrassed, but we have two scenarios here to play out in my opinion and it's quite clear what I have drawn here. I believe lower this week but only time will tell

US vs China: should we be worried?Another ''Buy the rumor''? What EVERY trader should have in mind amid US-China Trade talks:
1. Beijing balks at enforcement or verification terms
China could reject U.S.‑demanded mechanisms for monitoring compliance, such as agricultural purchase tracking or fentanyl control checkpoints.
Past talks collapsed over the same issue, the U.S. insisting on verification, China citing sovereignty .
If Beijing signals “framework only, no enforcement,” Washington may treat it as stalling and re‑activate the 155 % tariff threat for Nov 1 .
2. Rare‑earth or tech export retaliation
China still holds leverage through critical‑mineral exports. If it re‑tightens rare‑earth or semiconductor‑material shipments, Washington could impose new export controls on Chinese tech, reigniting escalation.
That “supply‑chain weaponization” was what caused the early‑October market sell‑off and would likely repeat—hurting metals, EV, and chip stocks first.
3. Unexpected Trump pivot under political pressure
Analysts warn that Trump tends to shift abruptly when domestic optics change.
A new social‑media statement accusing Beijing of backsliding could nullify the deal narrative overnight .
Morgan Stanley’s Mike Wilson noted that any such reversal could trigger a 10–15 % equity correction due to “positioning unwind and tariff risk repricing” .
4. National‑security or Taiwan language slips
The framework explicitly avoids defense issues, but if Trump or Xi reference Taiwan or South China Sea policy during press remarks, it could politicize the summit and freeze trade clauses .
5. Market complacency and over‑positioning
Even with a signed “mini‑deal,” markets may have already priced it in.
JPMorgan research warns that a “buy‑the‑rumor, sell‑the‑news” reaction is likely if investors had pre‑emptively rotated into cyclicals .
Thin liquidity plus leveraged optimism could amplify any disappointment.
Bottom line:
Unless both leaders explicitly confirm a tariff suspension and avoid new geopolitical flashpoints, markets remain only one headline away from reversal. The biggest red flags to watch this week are (1) a stalled verification clause, (2) talk of renewed tech or rare‑earth restrictions, or (3) Trump implying that tariffs will still “go forward pending review.” Any of these could instantly shift sentiment from optimism to a fresh wave of selling.
#trade #correction #economy #finance #us #china #tariff #bitcoin #crypto #stocks #equities #trading

ZECUSDT - another leg up ahead!Keep your eyes on it — just like I told you before. Its target was $250–$280, and it actually hit $298 exactly. It then entered a temporary corrective phase, forming a falling wedge pattern.
This coin is an ideal pick for the current phase, and don’t worry — its bullish run isn’t over yet.
Next target: $360. I’ll keep posting updates about it regularly.
Best regards:
Ceciliones🎯

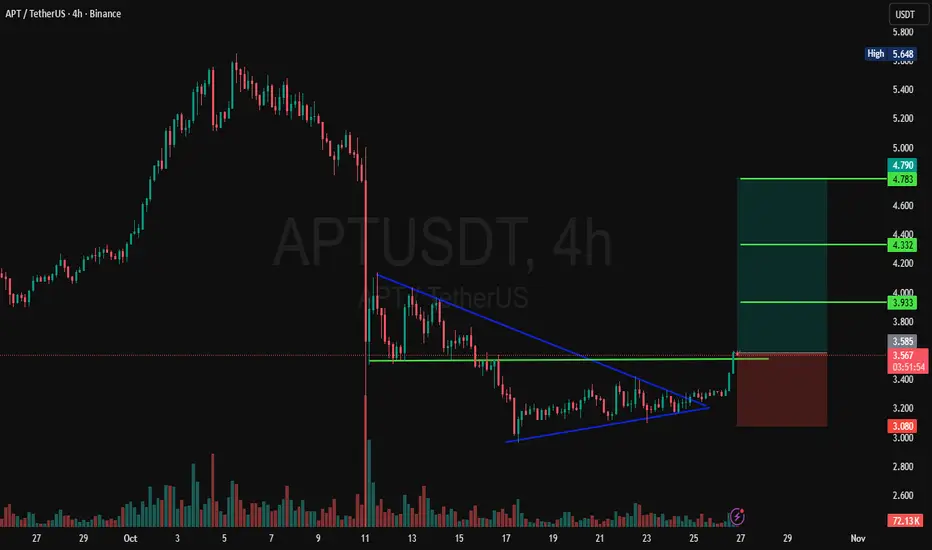
APT 4H Trade IdeaAptos looks bullish here on 4H time frame.
It has broke sideways & important level. Looks like a good accumulation done.
Entry & Exit points are on the chart.
NFA DYOR
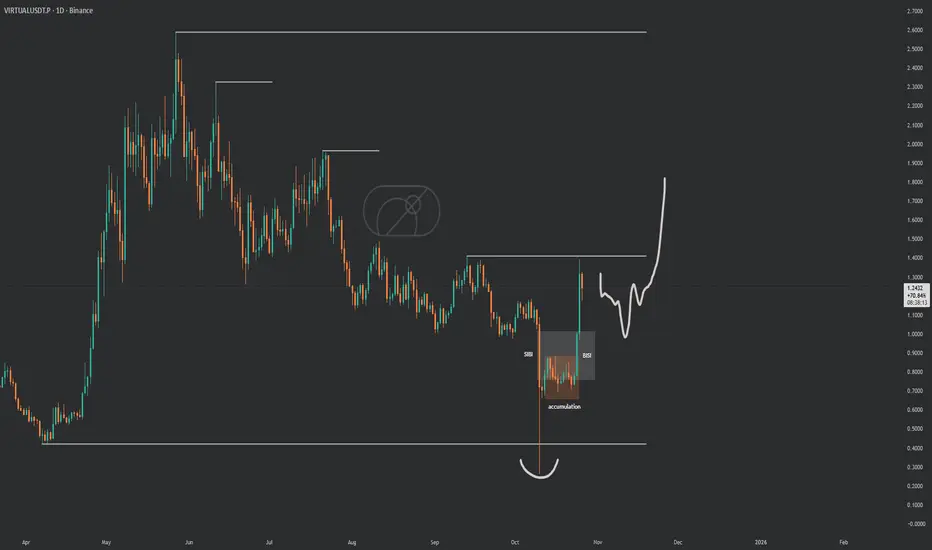
$VIRTUAL got that clean range clean price actionSPARKS:VIRTUAL got that clean range clean price action straight textbook accumulation. Lot of coins looking just like this, coiling up for the first real upside blast !If it dips to hand us $1, that's the golden entry.
new month watch list : SEED_WANDERIN_JIMZIP900:ASTER AMEX:XPL SPARKS:VIRTUAL
Inside the channel and Flies.If you look at market patterns and Bollinger bands, price always goes from high volatility to price discovery, tightens. Market shows clear direction, ie 🟢 or 🔴.
The same when using longterm charts, they fluctuate and you can almost find where the important channel gonna be.
It's psychology.
85% bullish. 15% it fails, imo.:)

USDT.D – 4H Technical Summary (Oct 26, 2025)USDT.D – 4H Technical Summary (Oct 26, 2025)
Structure: USDT Dominance has broken below the short-term BOS (Break of Structure) after multiple rejections from the premium zone, indicating a potential shift from bullish to bearish momentum.
Price Action: The dominance failed to hold above Equilibrium (≈4.84%) and is now trading toward the discount zone, signaling risk-on sentiment across crypto assets.
Moving Averages: Price is currently testing below the EMA89 (blue) while the EMA200 (yellow) sits near 4.70% — a key area for reaction. A clean break below this confluence would reinforce further downside.
Liquidity Zones:
Immediate support: 4.70% (discount / EMA confluence)
Next target: 4.40% – 4.20% (strong demand & previous accumulation zone)
Resistance: 4.90% – 5.00% (equilibrium retest / prior supply)
Momentum: The stochastic oscillator remains in the oversold region, hinting at a possible short-term bounce, but structure favors continued downside after retracements.
Trading Plan:
Bias: Bearish – expecting further decline in USDT dominance.
Scenario: Watch for minor pullback to 4.85% – 4.90% to confirm rejection before continuation lower.
Targets: 4.70% → 4.40%.
Invalidation: Sustained move back above 5.00%.
➡️ Outlook: Weakening USDT dominance supports bullish continuation for Bitcoin and altcoins as capital rotates out of stable assets into risk-on markets.

BTCUSDT – 1H Technical Summary (Oct 26, 2025)Structure: Bitcoin continues to respect the ascending channel, showing consistent higher highs and higher lows — confirming bullish structure.
Liquidity: Price broke above PDH (~112,800) and tapped into the premium / weak high zone (~114,000), suggesting buy-side liquidity has been taken.
Momentum: Strong bullish impulse candle with high volume; stochastic in the overbought zone → possible short-term consolidation before continuation.
Key Levels:
Support: 111,800 – 112,000 (Equilibrium / PDH retest zone)
Resistance: 114,000 – 115,000 (premium supply area)
Trading Plan:
Look for pullback buys near 112,000 – 112,500 zone.
Targets: 114,800 → 116,000 → 118,000 (channel top / PWH).
Stop-Loss: Below 111,000 (below structure & equilibrium).
➡️ Bias: Bullish – favoring buy setups on pullbacks while price stays above 111K support.
